| Param | Original file | Final file |
|---|---|---|
| Filename | modeM0/AS1A14_127T09_9000006520_54532cztM0_level2.fits | modeM0/AS1A14_127T09_9000006520_54532cztM0_level2_quad_clean.evt |
| Size (bytes) | 530,038,080 | 98,642,880 |
| Size | 505.5 MB | 94.1 MB |
| Events in quadrant A | 3,498,937 | 670,074 |
| Events in quadrant B | 4,091,554 | 699,567 |
| Events in quadrant C | 7,813,296 | 538,251 |
| Events in quadrant D | 3,680,041 | 598,028 |
| Mode M0 | |||
|---|---|---|---|
| Quadrant | BADHDUFLAG | Total packets | Discarded packets |
| A | 0 | 15421 | 2 |
| B | 0 | 17079 | 2 |
| C | 0 | 28179 | 2 |
| D | 0 | 15964 | 2 |
| Mode SS | |||
|---|---|---|---|
| Quadrant | BADHDUFLAG | Total packets | Discarded packets |
| A | 0 | 140 | 0 |
| B | 0 | 140 | 0 |
| C | 0 | 140 | 0 |
| D | 0 | 140 | 0 |
| Mode M9 | |||
|---|---|---|---|
| Quadrant | BADHDUFLAG | Total packets | Discarded packets |
| A | 0 | 16 | 0 |
| B | 0 | 16 | 0 |
| C | 0 | 17 | 0 |
| D | 0 | 17 | 0 |
| Quadrant | Total seconds | Saturated seconds | Saturation percentage |
|---|---|---|---|
| A | 6903 | 118 | 1.709402% |
| B | 6903 | 318 | 4.606693% |
| C | 6903 | 1431 | 20.730117% |
| D | 6903 | 104 | 1.506591% |
Noise dominated data is calculated using 1-second bins in cleaned event files. If a bin has >2000 counts, and if more than 50% of those come from <1% of pixels, then it is considered to be noise-dominated and hence unusable.
| Quadrant | # 1 sec bins | Bins with >0 counts | Bins with >2000 counts | High rate bins dominated by noise | Noise dominated (total time) | Noise dominated (detector-on time) | Marked lightcurve |
|---|---|---|---|---|---|---|---|
| A | 7978 | 6904 | 88 | 88 | 1.10% | 1.27% | 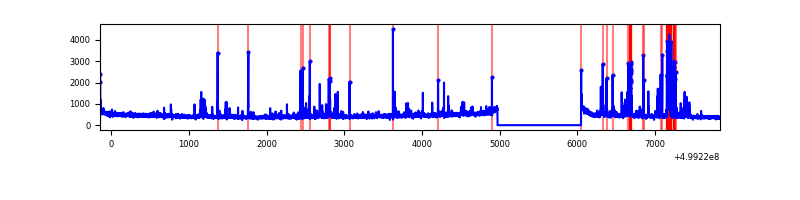 |
| B | 7978 | 6904 | 204 | 204 | 2.56% | 2.95% | 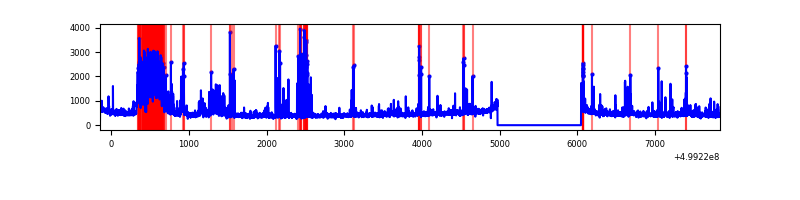 |
| C | 7978 | 6904 | 1293 | 1293 | 16.21% | 18.73% | 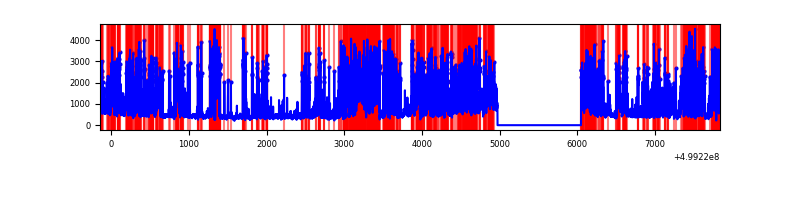 |
| D | 7978 | 6904 | 100 | 100 | 1.25% | 1.45% | 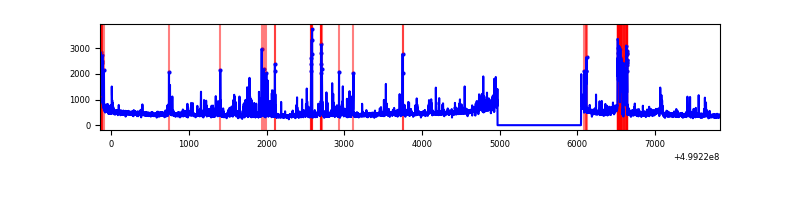 |
Top three noisy pixels from each quadrant. If the there are fewer than three noisy pixels in the level2.evt file, extra rows are filled as -1
| Pixel properties | Quadrant properties | ||||||
|---|---|---|---|---|---|---|---|
| Quadrant | DetID | PixID | Counts | Sigma | Mean | Median | Sigma |
| A | 4 | 249 | 467771 | 2532.38 | 745 | 729 | 184.4 |
| A | 3 | 110 | 36835 | 195.77 | 745 | 729 | 184.4 |
| A | 4 | 3 | 28591 | 151.07 | 745 | 729 | 184.4 |
| B | 5 | 185 | 619622 | 3890.2 | 739 | 713 | 159.1 |
| B | 1 | 207 | 201410 | 1261.5 | 739 | 713 | 159.1 |
| B | 10 | 14 | 170226 | 1065.49 | 739 | 713 | 159.1 |
| C | 4 | 5 | 4373150 | 23818.88 | 666 | 659 | 183.6 |
| C | 12 | 252 | 440218 | 2394.47 | 666 | 659 | 183.6 |
| C | 1 | 16 | 79829 | 431.27 | 666 | 659 | 183.6 |
| D | 2 | 172 | 315879 | 1527.07 | 719 | 685 | 206.4 |
| D | 3 | 224 | 192563 | 929.62 | 719 | 685 | 206.4 |
| D | 6 | 239 | 177645 | 857.35 | 719 | 685 | 206.4 |
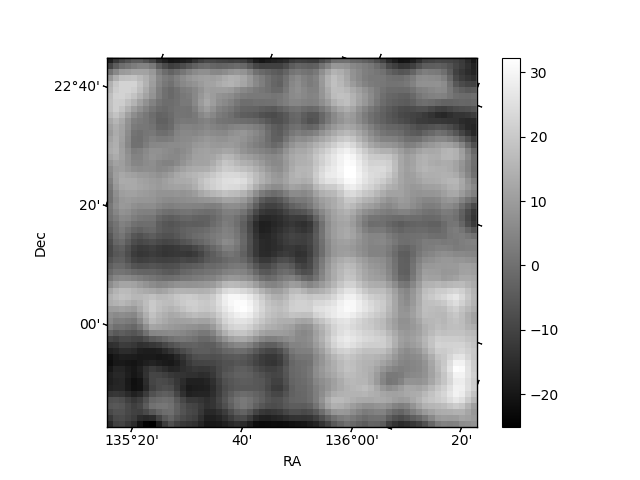
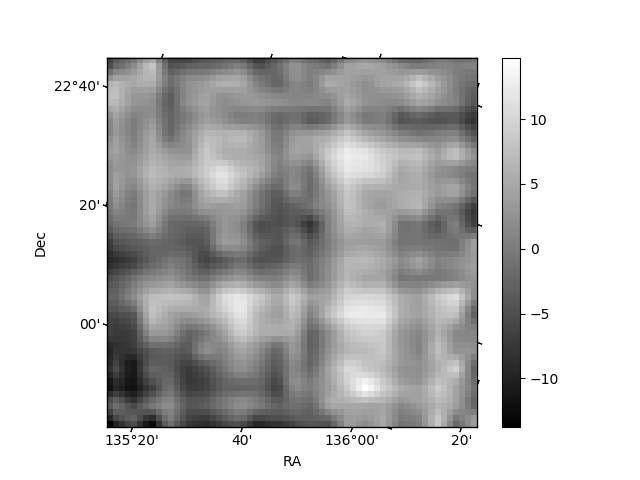
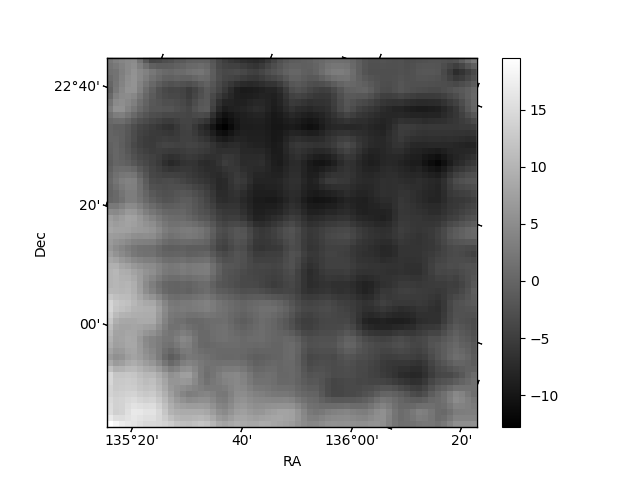
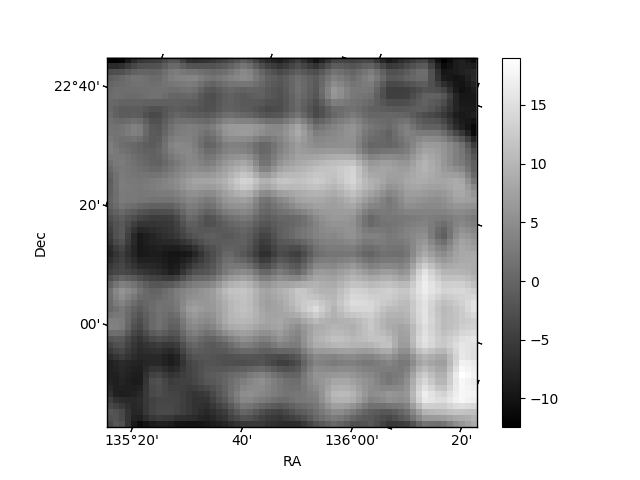
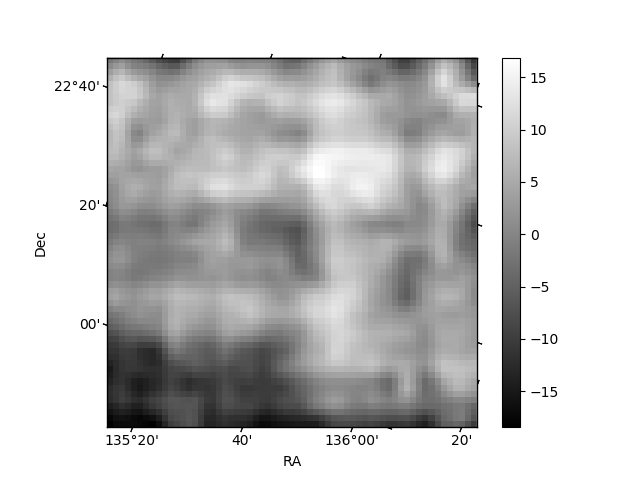
Histogram calculated using DETX and DETY for each event in the final _common_clean file
| Quadrant A | 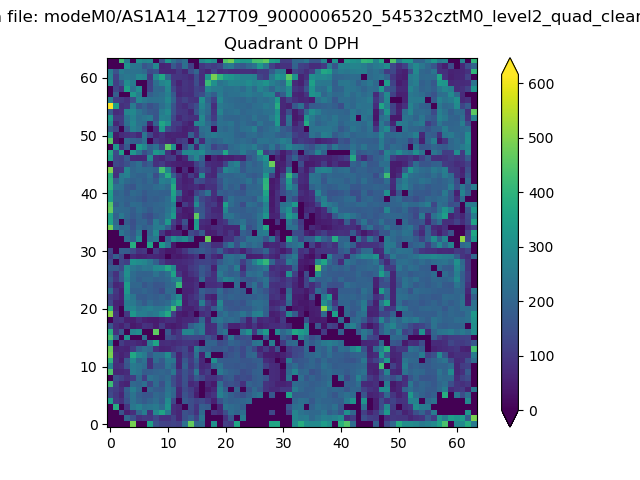 |
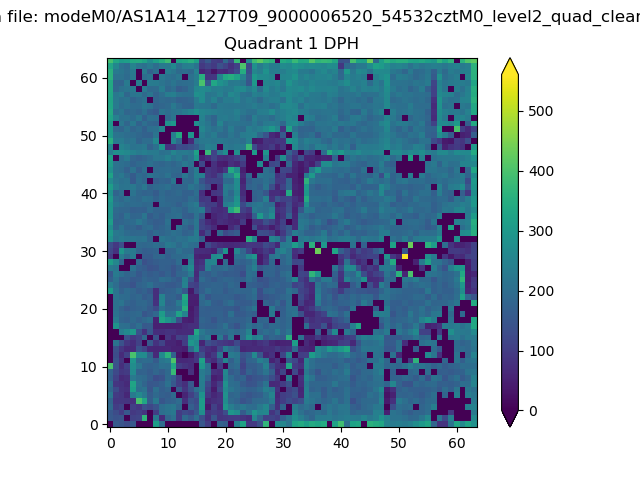 |
Quadrant B |
|---|---|---|---|
| Quadrant D | 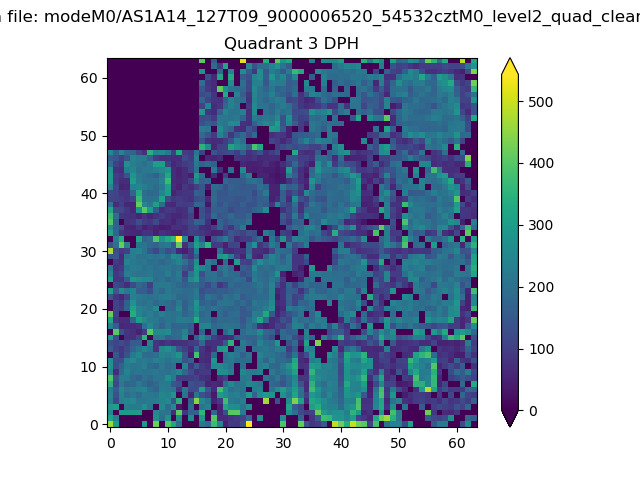 |
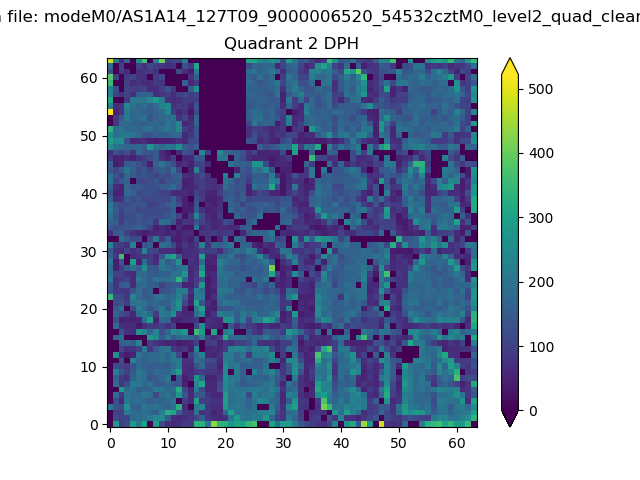 |
Quadrant C |
| Plot type | Count rate plots | Images |
|---|---|---|
| Comparison with Poisson distribution Blue bars denote a histogram of data divided into 1 sec bins. Red curve is a Poisson curve with rate = median count rate of data. |
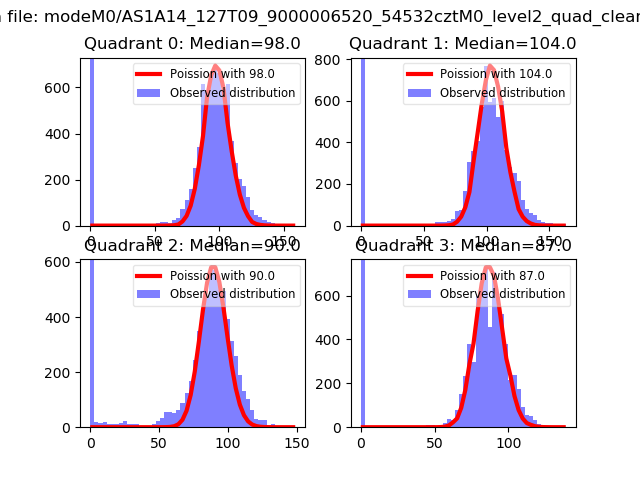 |
 |
| Quadrant-wise count rates Data is divided into 100 sec bins |
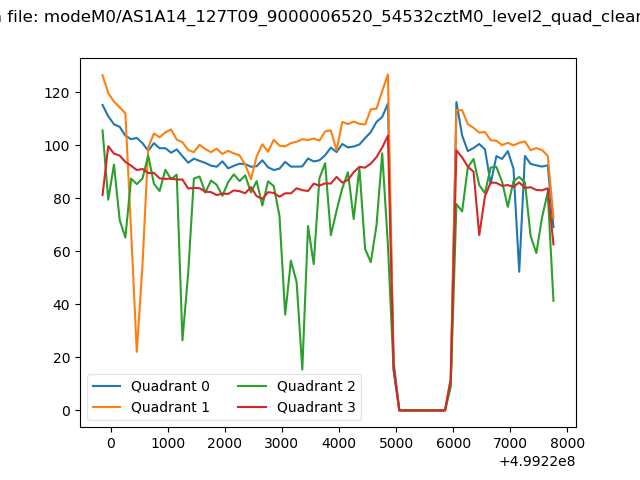 |
|
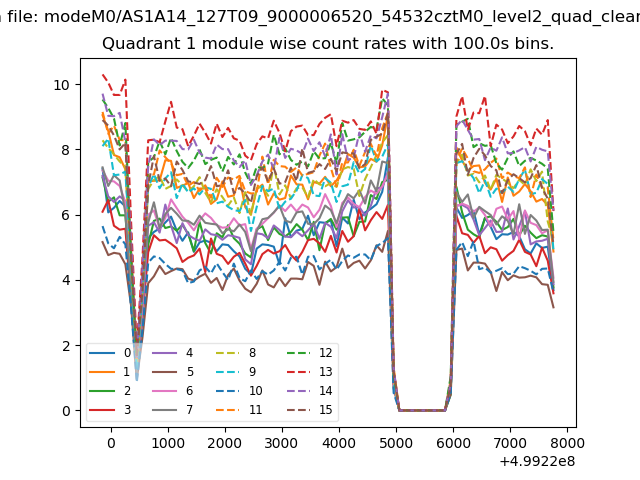
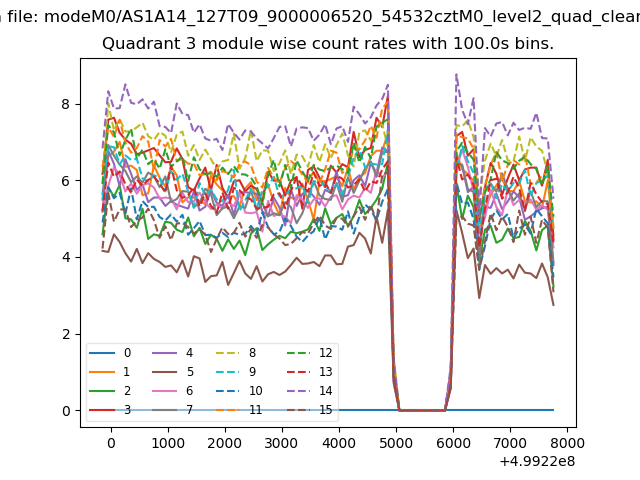
| Module-wise count rates for Quadrant A Data is divided into 100 sec bins |
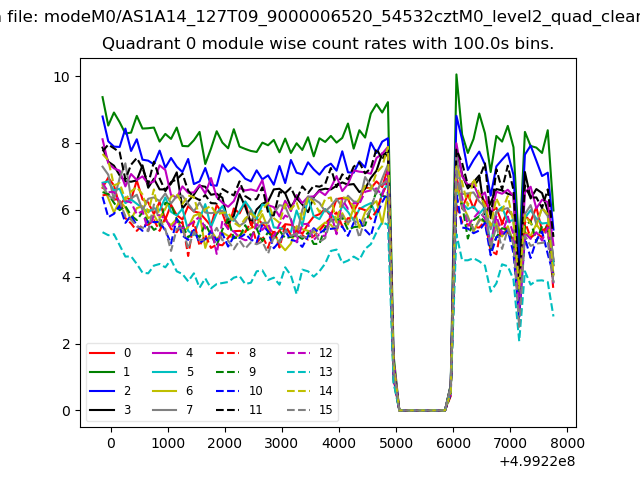 |
 |
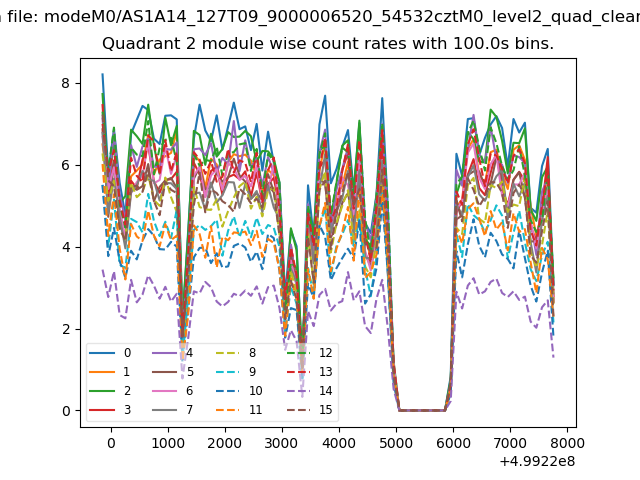
| Module-wise count rates for Quadrant B Data is divided into 100 sec bins |
 |
 |
| Module-wise count rates for Quadrant C Data is divided into 100 sec bins |
 |
 |
| Module-wise count rates for Quadrant D Data is divided into 100 sec bins |
 |
 |
| Parameter | Plot |
|---|---|
| CZT HV Monitor | 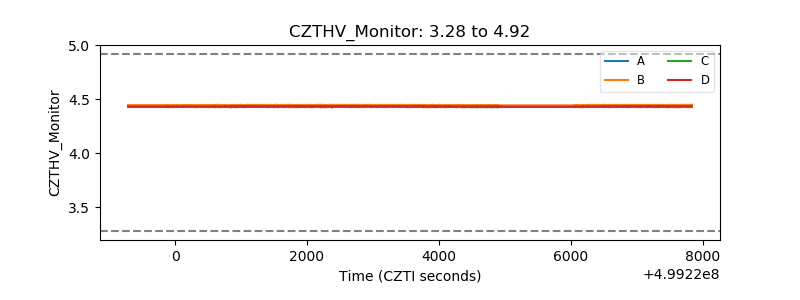 |
| D_VDD | 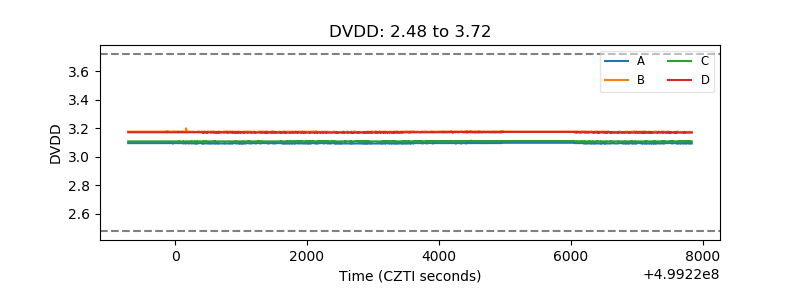 |
| Temperature 1 | 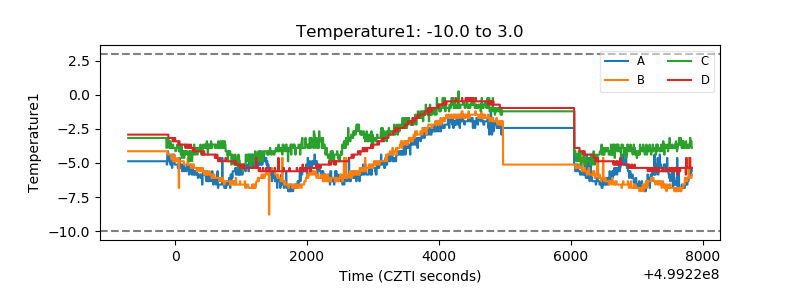 |
| Veto HV Monitor | 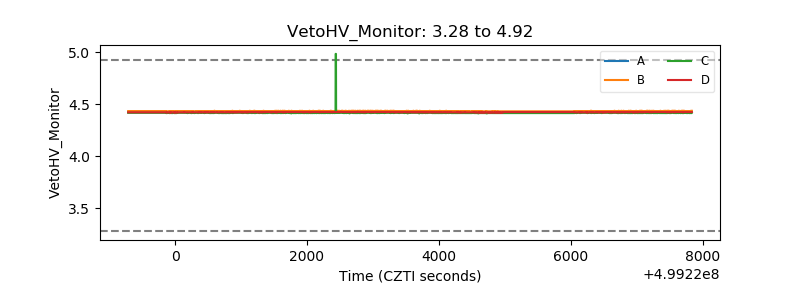 |
| Veto LLD | 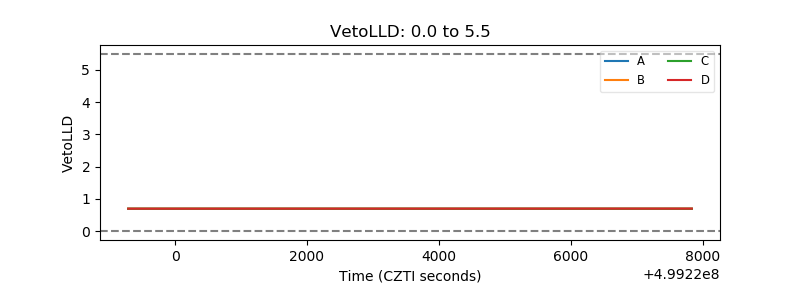 |
| Alpha Counter | 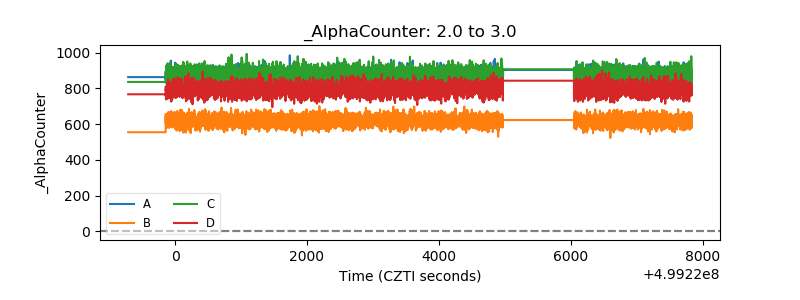 |
| _CPM_Rate | 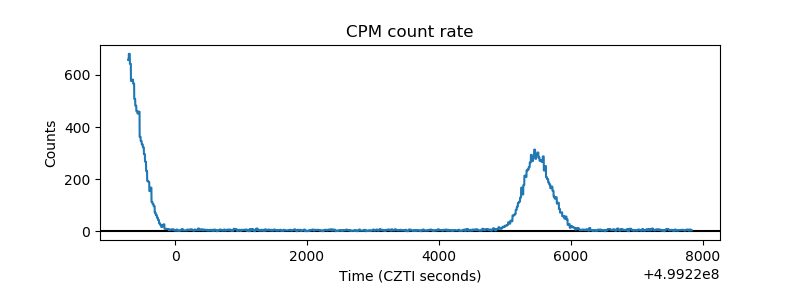 |
| CZT Counter | 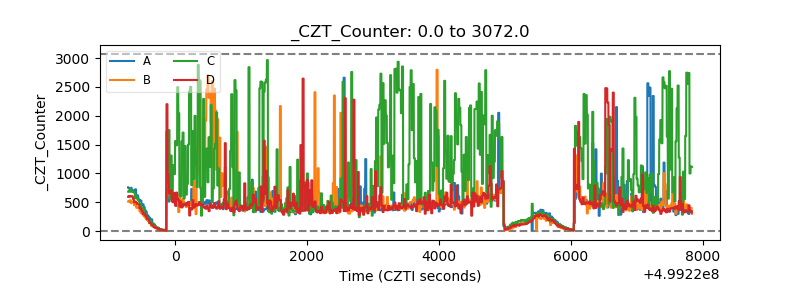 |
| +2.5 Volts monitor |  |
| +5 Volts monitor |  |
| _ROLL_ROT | 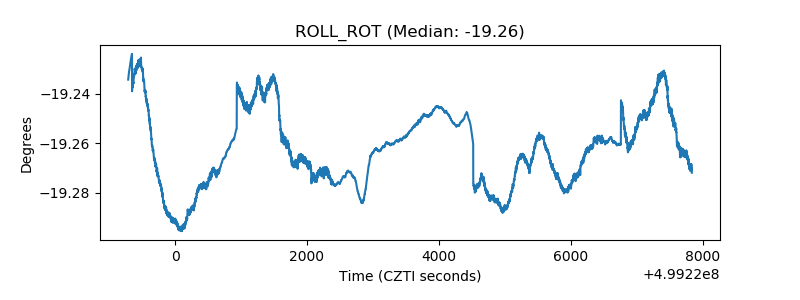 |
| _Roll_DEC | 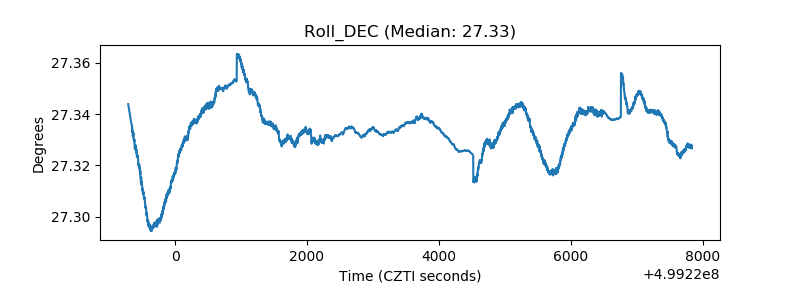 |
| _Roll_RA | 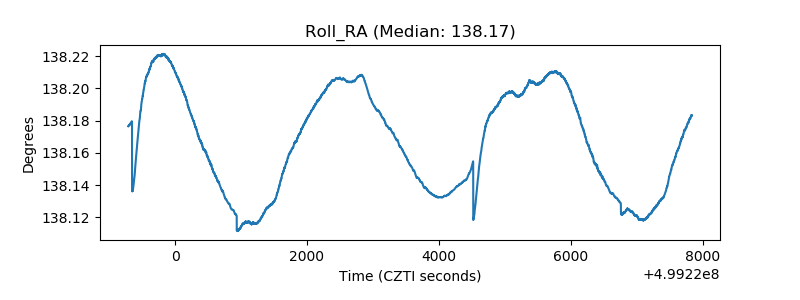 |
| Veto Counter | 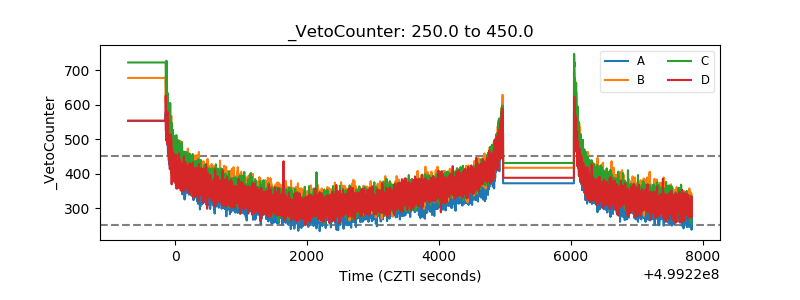 |