| Param | Original file | Final file |
|---|---|---|
| Filename | modeM0/AS1A14_127T09_9000006520_54533cztM0_level2.fits | modeM0/AS1A14_127T09_9000006520_54533cztM0_level2_quad_clean.evt |
| Size (bytes) | 539,087,040 | 102,539,520 |
| Size | 514.1 MB | 97.8 MB |
| Events in quadrant A | 3,611,678 | 683,166 |
| Events in quadrant B | 3,941,730 | 726,793 |
| Events in quadrant C | 6,903,806 | 594,309 |
| Events in quadrant D | 4,940,633 | 600,442 |
| Mode M0 | |||
|---|---|---|---|
| Quadrant | BADHDUFLAG | Total packets | Discarded packets |
| A | 0 | 16121 | 2 |
| B | 0 | 16922 | 2 |
| C | 0 | 25565 | 2 |
| D | 0 | 19796 | 4 |
| Mode SS | |||
|---|---|---|---|
| Quadrant | BADHDUFLAG | Total packets | Discarded packets |
| A | 0 | 146 | 0 |
| B | 0 | 146 | 0 |
| C | 0 | 146 | 0 |
| D | 0 | 146 | 0 |
| Mode M9 | |||
|---|---|---|---|
| Quadrant | BADHDUFLAG | Total packets | Discarded packets |
| A | 0 | 13 | 0 |
| B | 0 | 13 | 0 |
| C | 0 | 14 | 0 |
| D | 0 | 14 | 0 |
| Quadrant | Total seconds | Saturated seconds | Saturation percentage |
|---|---|---|---|
| A | 7180 | 119 | 1.657382% |
| B | 7180 | 208 | 2.896936% |
| C | 7180 | 850 | 11.838440% |
| D | 7179 | 239 | 3.329154% |
Noise dominated data is calculated using 1-second bins in cleaned event files. If a bin has >2000 counts, and if more than 50% of those come from <1% of pixels, then it is considered to be noise-dominated and hence unusable.
| Quadrant | # 1 sec bins | Bins with >0 counts | Bins with >2000 counts | High rate bins dominated by noise | Noise dominated (total time) | Noise dominated (detector-on time) | Marked lightcurve |
|---|---|---|---|---|---|---|---|
| A | 8015 | 7181 | 94 | 94 | 1.17% | 1.31% | 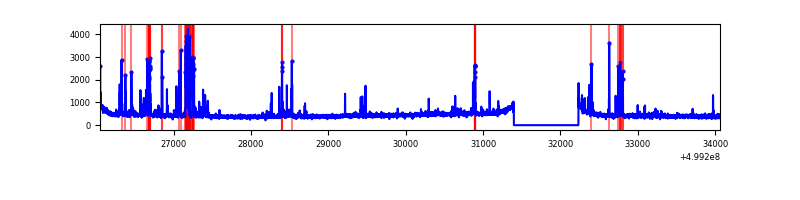 |
| B | 8015 | 7181 | 88 | 88 | 1.10% | 1.23% | 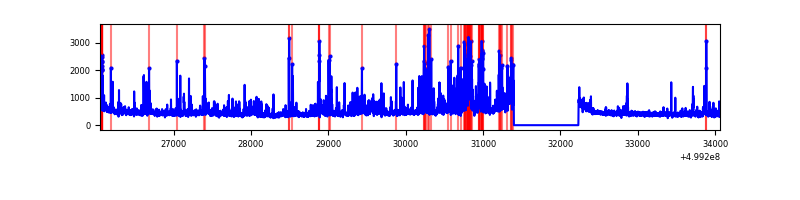 |
| C | 8015 | 7180 | 775 | 775 | 9.67% | 10.79% | 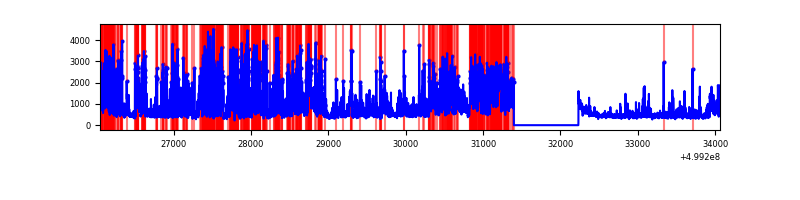 |
| D | 8014 | 7180 | 287 | 287 | 3.58% | 4.00% | 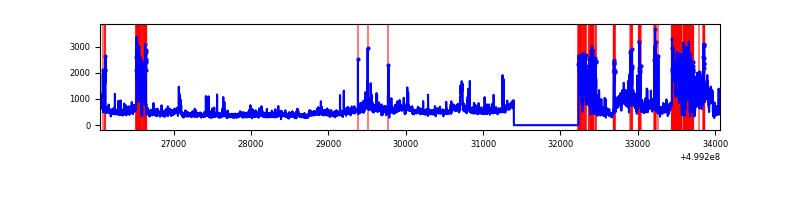 |
Top three noisy pixels from each quadrant. If the there are fewer than three noisy pixels in the level2.evt file, extra rows are filled as -1
| Pixel properties | Quadrant properties | ||||||
|---|---|---|---|---|---|---|---|
| Quadrant | DetID | PixID | Counts | Sigma | Mean | Median | Sigma |
| A | 4 | 249 | 468875 | 2425.0 | 774 | 756 | 193.0 |
| A | 13 | 248 | 65613 | 335.98 | 774 | 756 | 193.0 |
| A | 4 | 3 | 34615 | 175.4 | 774 | 756 | 193.0 |
| B | 5 | 185 | 272716 | 1618.66 | 767 | 738 | 168.0 |
| B | 10 | 14 | 259249 | 1538.52 | 767 | 738 | 168.0 |
| B | 2 | 249 | 98489 | 581.76 | 767 | 738 | 168.0 |
| C | 4 | 5 | 1959760 | 9874.81 | 721 | 713 | 198.4 |
| C | 12 | 252 | 1705271 | 8592.03 | 721 | 713 | 198.4 |
| C | 13 | 3 | 110394 | 552.86 | 721 | 713 | 198.4 |
| D | 2 | 172 | 1346125 | 6438.33 | 738 | 705 | 209.0 |
| D | 8 | 160 | 199613 | 951.85 | 738 | 705 | 209.0 |
| D | 3 | 144 | 105827 | 503.05 | 738 | 705 | 209.0 |
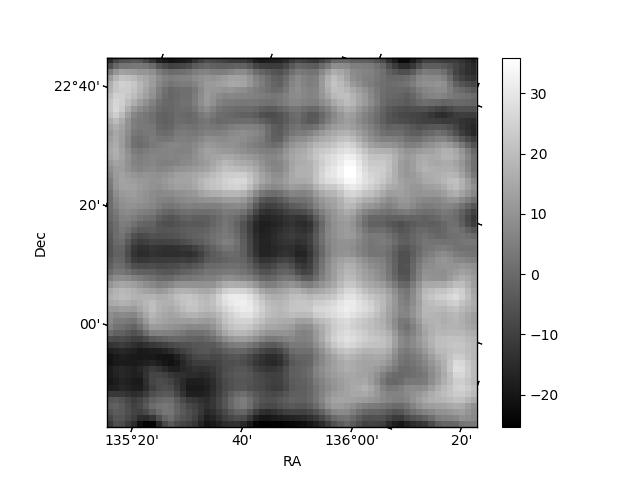
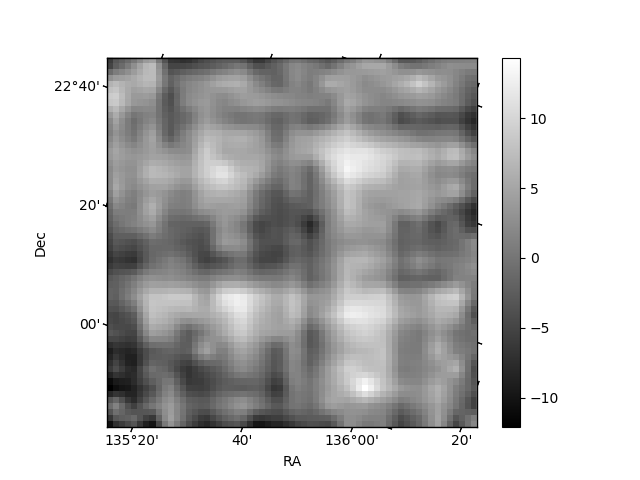
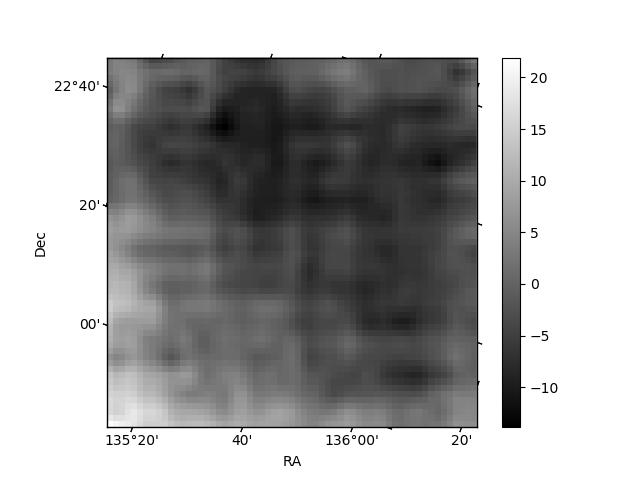
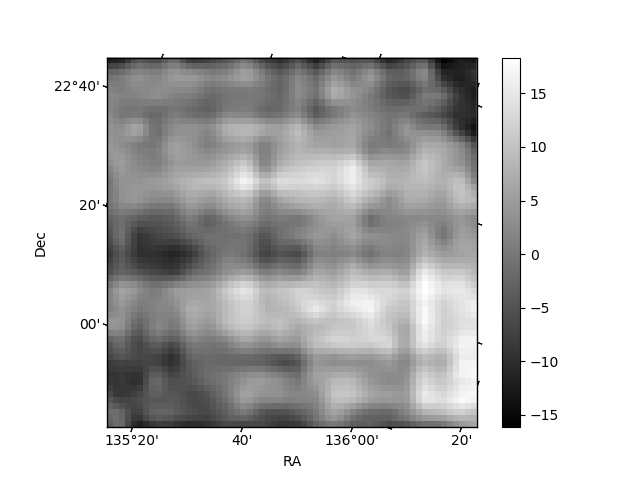
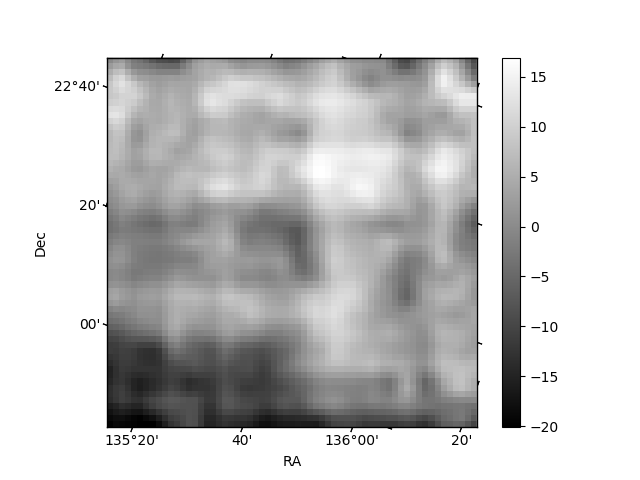
Histogram calculated using DETX and DETY for each event in the final _common_clean file
| Quadrant A | 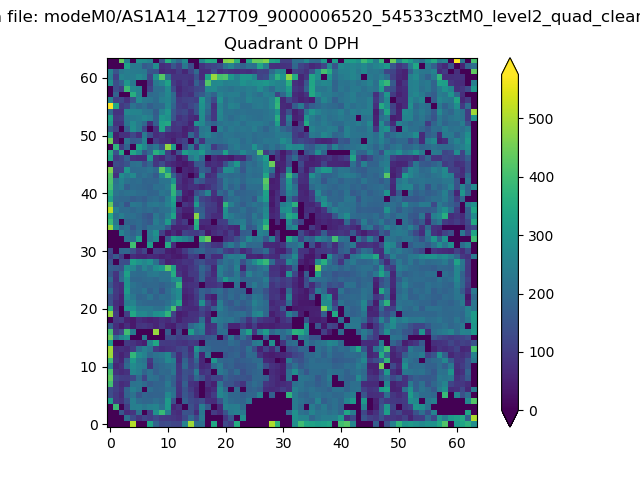 |
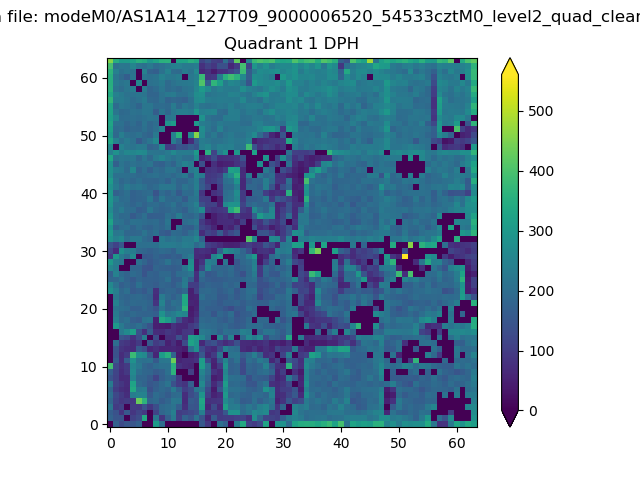 |
Quadrant B |
|---|---|---|---|
| Quadrant D | 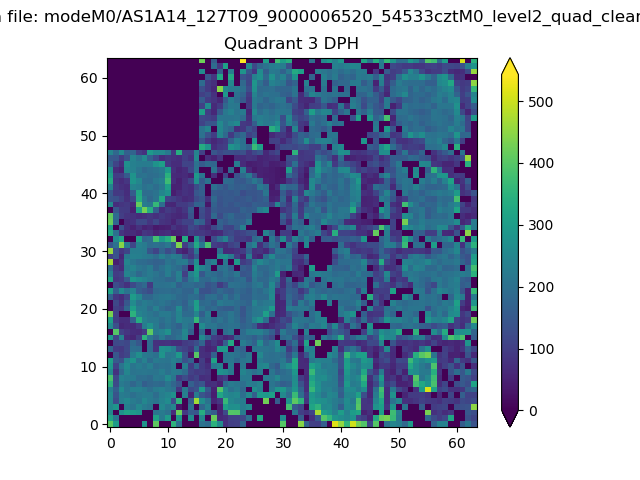 |
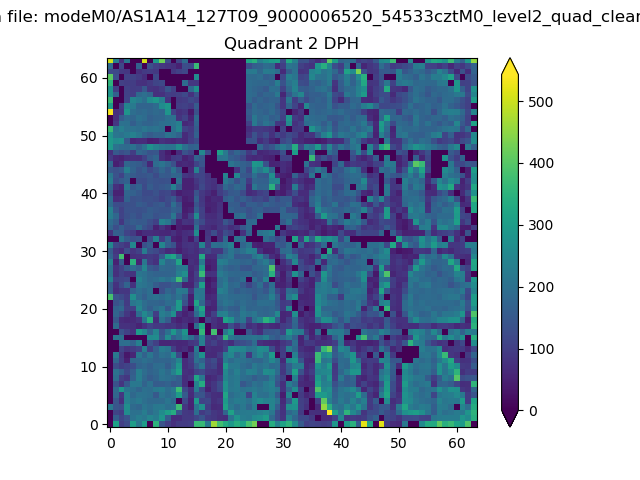 |
Quadrant C |
| Plot type | Count rate plots | Images |
|---|---|---|
| Comparison with Poisson distribution Blue bars denote a histogram of data divided into 1 sec bins. Red curve is a Poisson curve with rate = median count rate of data. |
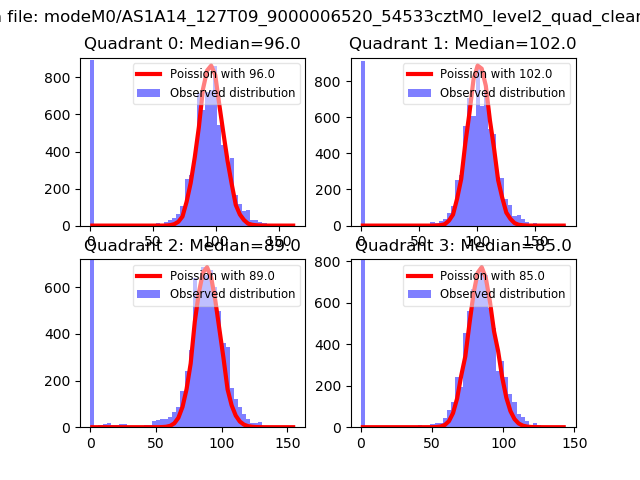 |
 |
| Quadrant-wise count rates Data is divided into 100 sec bins |
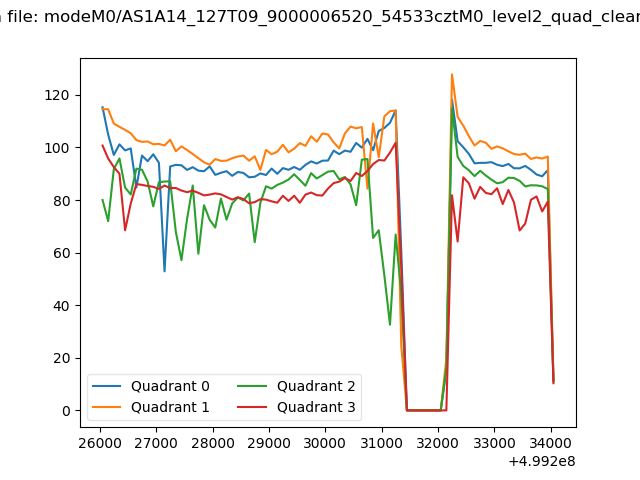 |
|
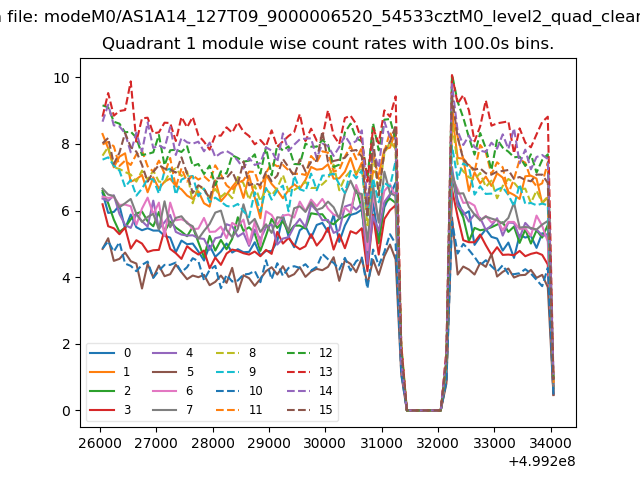
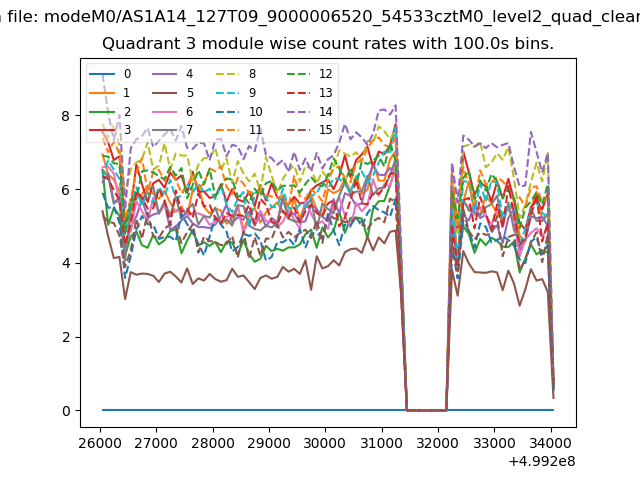
| Module-wise count rates for Quadrant A Data is divided into 100 sec bins |
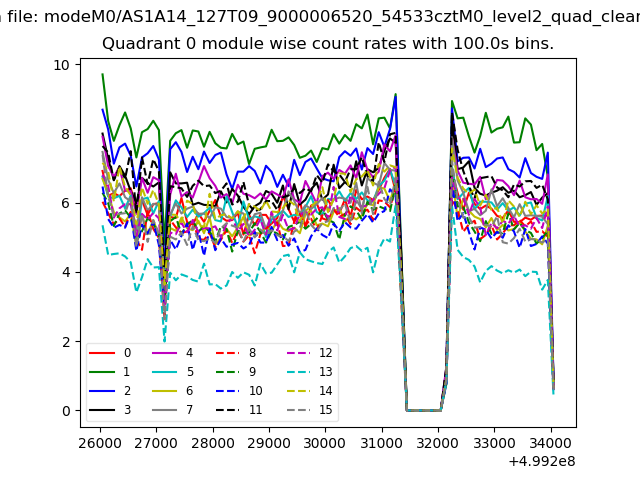 |
 |
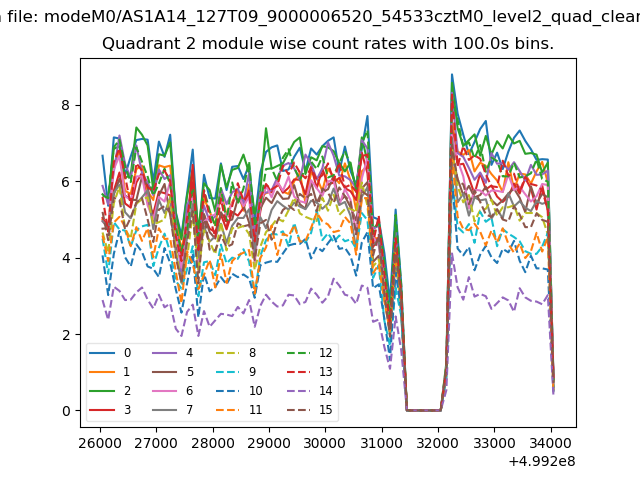
| Module-wise count rates for Quadrant B Data is divided into 100 sec bins |
 |
 |
| Module-wise count rates for Quadrant C Data is divided into 100 sec bins |
 |
 |
| Module-wise count rates for Quadrant D Data is divided into 100 sec bins |
 |
 |
| Parameter | Plot |
|---|---|
| CZT HV Monitor | 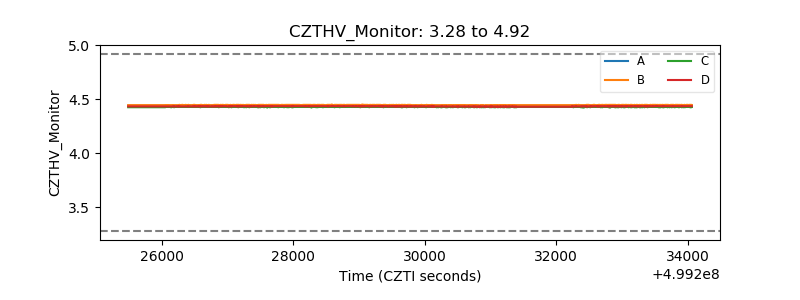 |
| D_VDD | 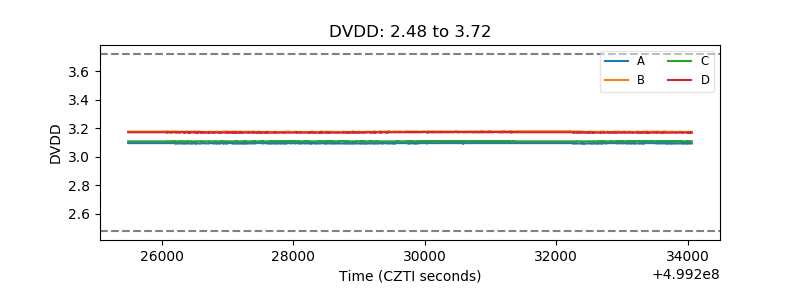 |
| Temperature 1 | 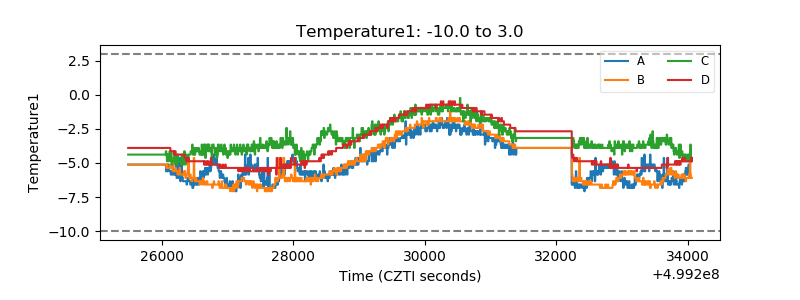 |
| Veto HV Monitor | 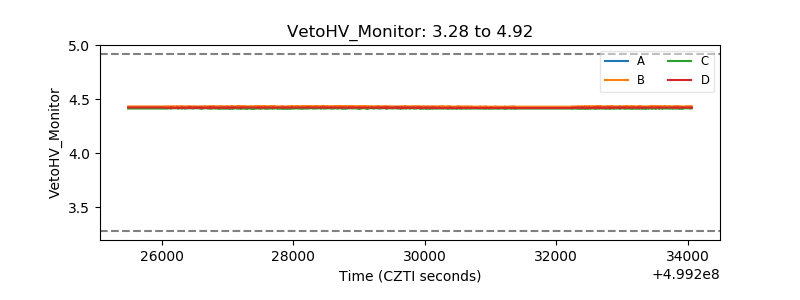 |
| Veto LLD | 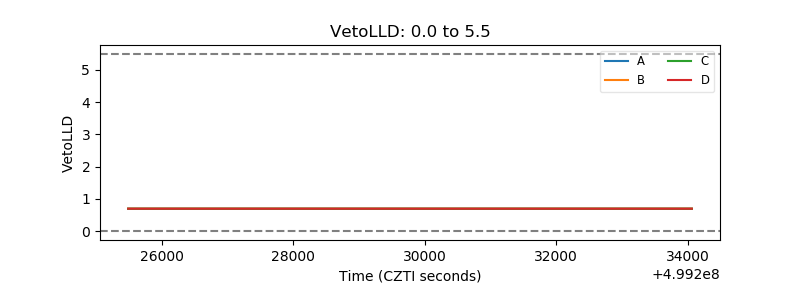 |
| Alpha Counter | 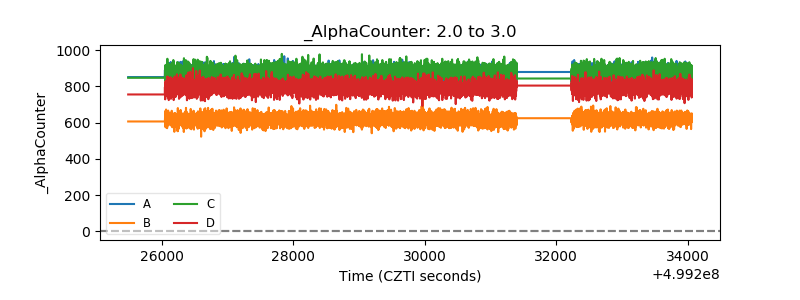 |
| _CPM_Rate | 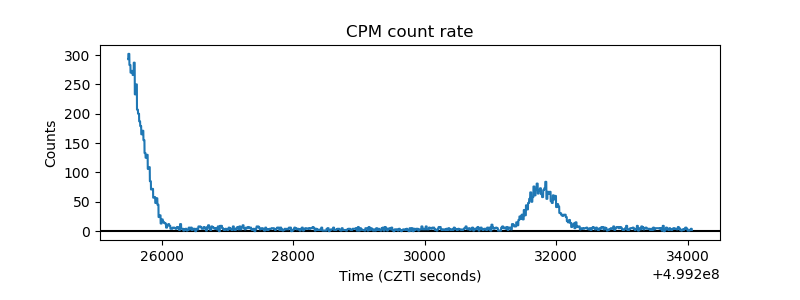 |
| CZT Counter | 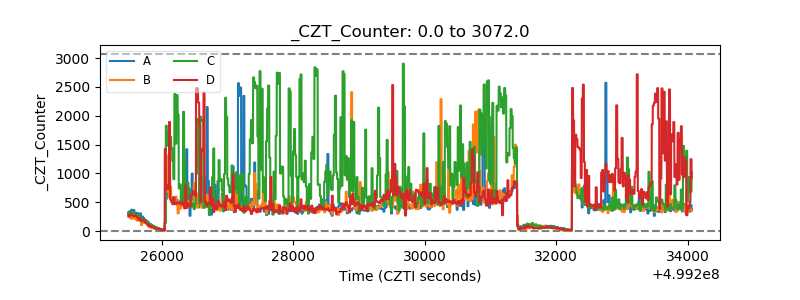 |
| +2.5 Volts monitor |  |
| +5 Volts monitor |  |
| _ROLL_ROT | 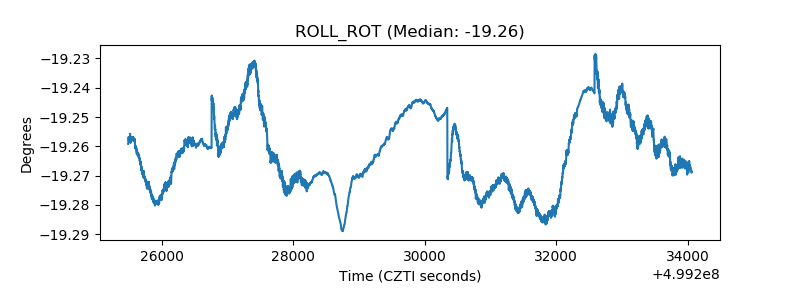 |
| _Roll_DEC | 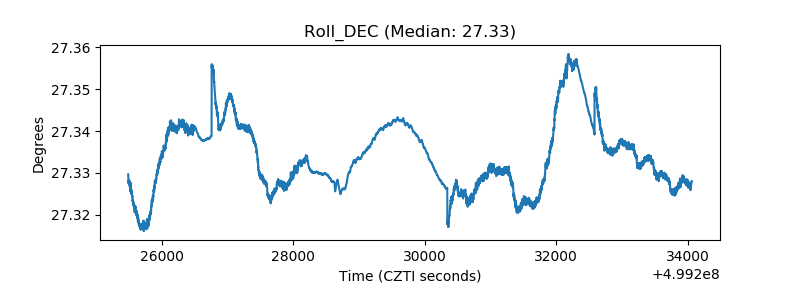 |
| _Roll_RA | 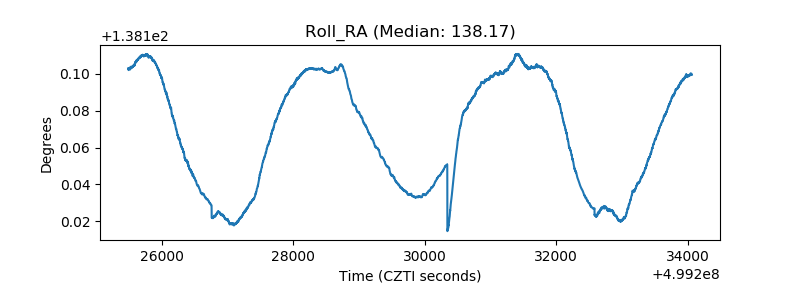 |
| Veto Counter | 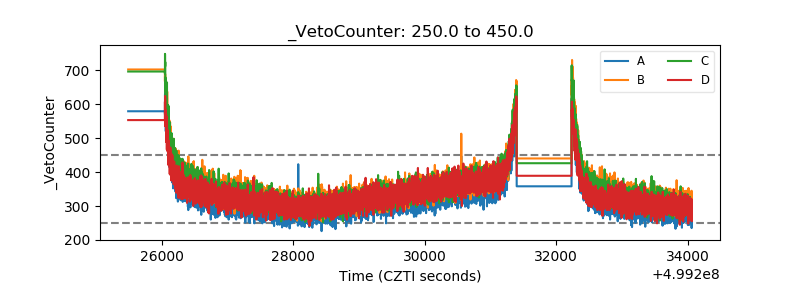 |