| Param | Original file | Final file |
|---|---|---|
| Filename | modeM0/AS1A14_127T09_9000006520_54534cztM0_level2.fits | modeM0/AS1A14_127T09_9000006520_54534cztM0_level2_quad_clean.evt |
| Size (bytes) | 575,303,040 | 111,150,720 |
| Size | 548.7 MB | 106.0 MB |
| Events in quadrant A | 3,872,495 | 738,917 |
| Events in quadrant B | 4,837,153 | 762,073 |
| Events in quadrant C | 5,237,243 | 696,241 |
| Events in quadrant D | 6,740,859 | 623,863 |
| Mode M0 | |||
|---|---|---|---|
| Quadrant | BADHDUFLAG | Total packets | Discarded packets |
| A | 0 | 17353 | 2 |
| B | 0 | 20223 | 2 |
| C | 0 | 21054 | 2 |
| D | 0 | 25510 | 2 |
| Mode SS | |||
|---|---|---|---|
| Quadrant | BADHDUFLAG | Total packets | Discarded packets |
| A | 0 | 160 | 0 |
| B | 0 | 160 | 0 |
| C | 0 | 160 | 0 |
| D | 0 | 160 | 0 |
| Mode M9 | |||
|---|---|---|---|
| Quadrant | BADHDUFLAG | Total packets | Discarded packets |
| A | 0 | 10 | 0 |
| B | 0 | 11 | 0 |
| C | 0 | 11 | 0 |
| D | 0 | 11 | 0 |
| Quadrant | Total seconds | Saturated seconds | Saturation percentage |
|---|---|---|---|
| A | 7837 | 150 | 1.913998% |
| B | 7837 | 535 | 6.826592% |
| C | 7837 | 240 | 3.062396% |
| D | 7837 | 612 | 7.809111% |
Noise dominated data is calculated using 1-second bins in cleaned event files. If a bin has >2000 counts, and if more than 50% of those come from <1% of pixels, then it is considered to be noise-dominated and hence unusable.
| Quadrant | # 1 sec bins | Bins with >0 counts | Bins with >2000 counts | High rate bins dominated by noise | Noise dominated (total time) | Noise dominated (detector-on time) | Marked lightcurve |
|---|---|---|---|---|---|---|---|
| A | 8042 | 7840 | 22 | 22 | 0.27% | 0.28% | 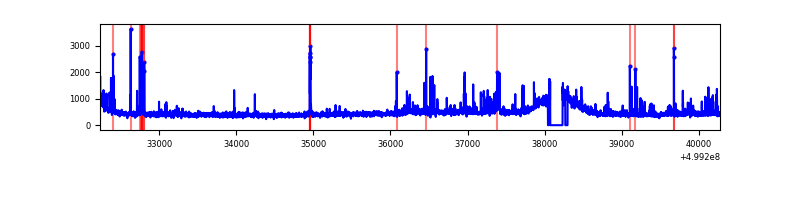 |
| B | 8042 | 7840 | 168 | 168 | 2.09% | 2.14% | 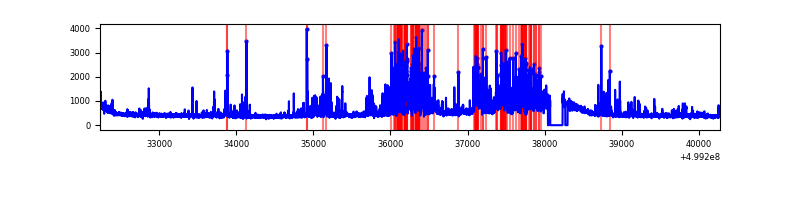 |
| C | 8042 | 7840 | 148 | 148 | 1.84% | 1.89% | 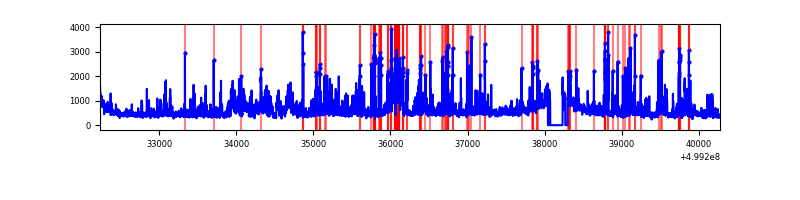 |
| D | 8042 | 7839 | 574 | 574 | 7.14% | 7.32% | 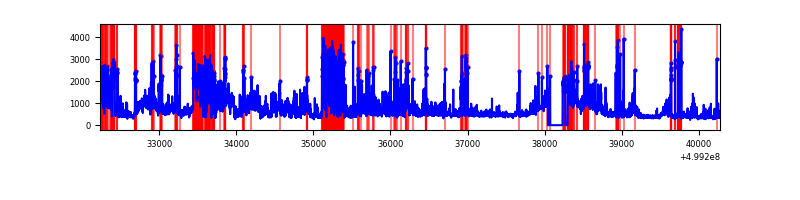 |
Top three noisy pixels from each quadrant. If the there are fewer than three noisy pixels in the level2.evt file, extra rows are filled as -1
| Pixel properties | Quadrant properties | ||||||
|---|---|---|---|---|---|---|---|
| Quadrant | DetID | PixID | Counts | Sigma | Mean | Median | Sigma |
| A | 4 | 249 | 131666 | 607.72 | 877 | 856 | 215.2 |
| A | 11 | 3 | 67275 | 308.57 | 877 | 856 | 215.2 |
| A | 13 | 248 | 63834 | 292.59 | 877 | 856 | 215.2 |
| B | 10 | 14 | 951614 | 5118.45 | 854 | 825 | 185.8 |
| B | 5 | 185 | 324363 | 1741.73 | 854 | 825 | 185.8 |
| B | 10 | 247 | 100935 | 538.93 | 854 | 825 | 185.8 |
| C | 12 | 252 | 838396 | 3617.3 | 845 | 837 | 231.5 |
| C | 4 | 5 | 464254 | 2001.43 | 845 | 837 | 231.5 |
| C | 13 | 3 | 253067 | 1089.35 | 845 | 837 | 231.5 |
| D | 2 | 172 | 2014227 | 8750.94 | 815 | 780 | 230.1 |
| D | 8 | 160 | 901935 | 3916.64 | 815 | 780 | 230.1 |
| D | 3 | 144 | 162015 | 700.77 | 815 | 780 | 230.1 |
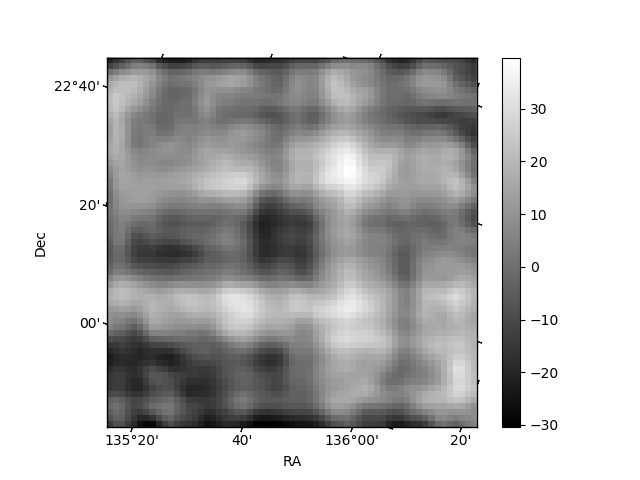
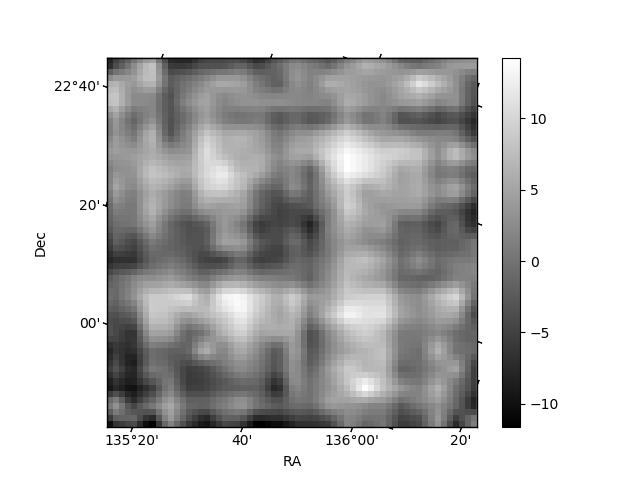
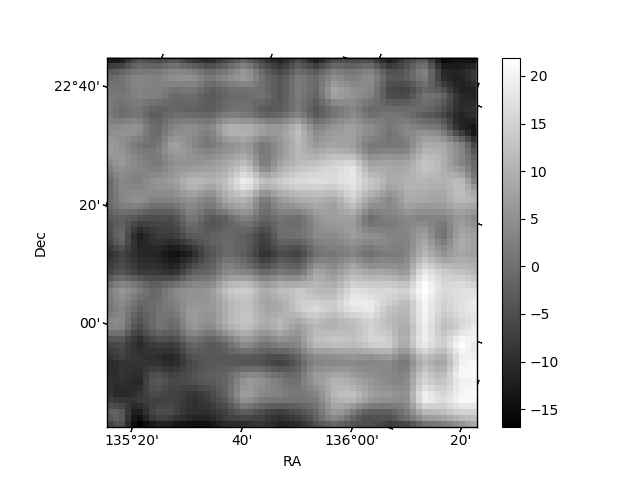
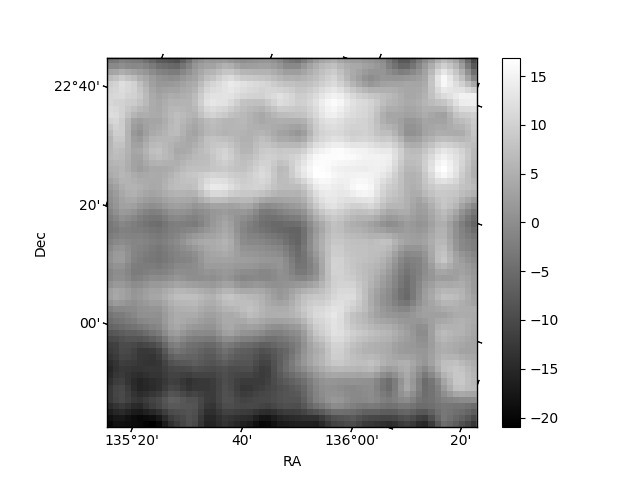
Histogram calculated using DETX and DETY for each event in the final _common_clean file
| Quadrant A | 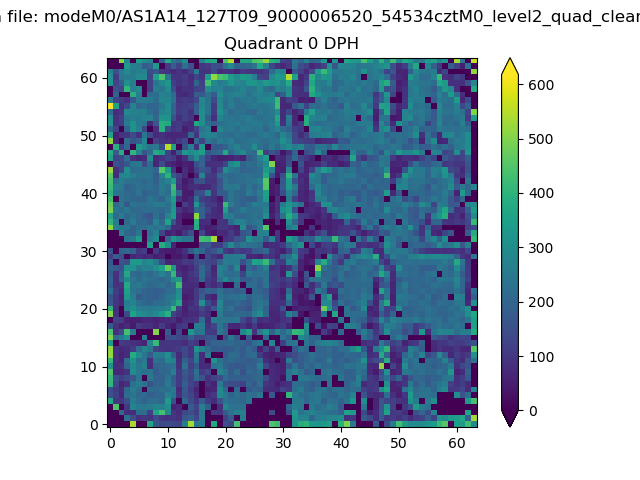 |
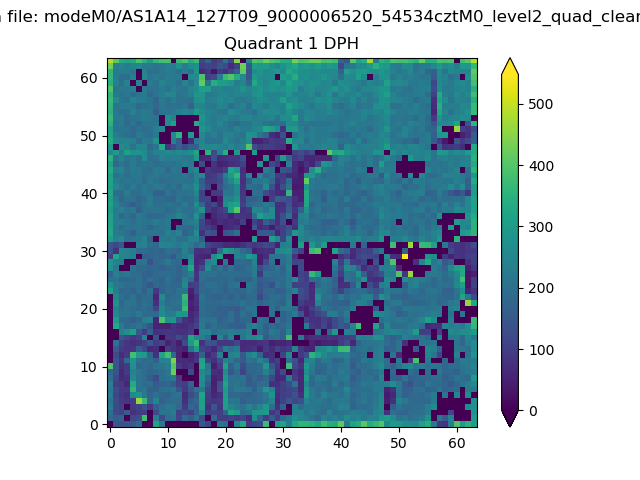 |
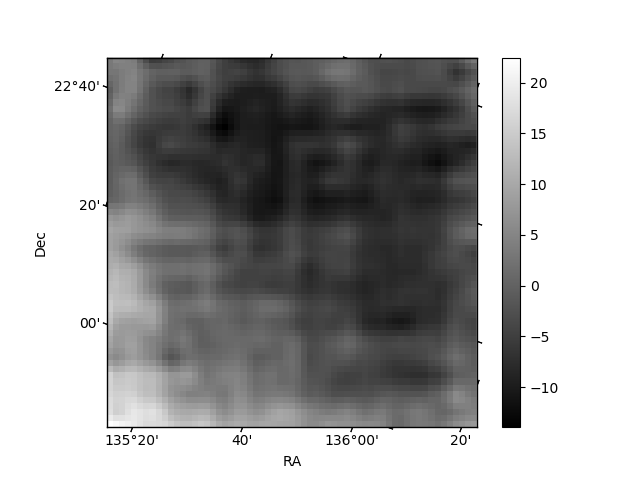
Quadrant B |
|---|---|---|---|
| Quadrant D | 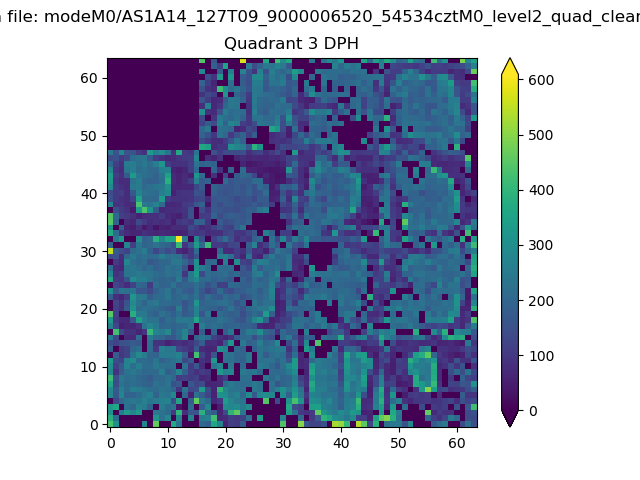 |
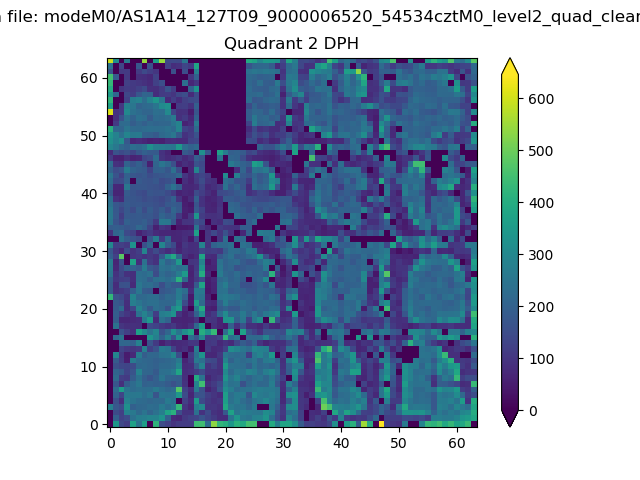 |
Quadrant C |
| Plot type | Count rate plots | Images |
|---|---|---|
| Comparison with Poisson distribution Blue bars denote a histogram of data divided into 1 sec bins. Red curve is a Poisson curve with rate = median count rate of data. |
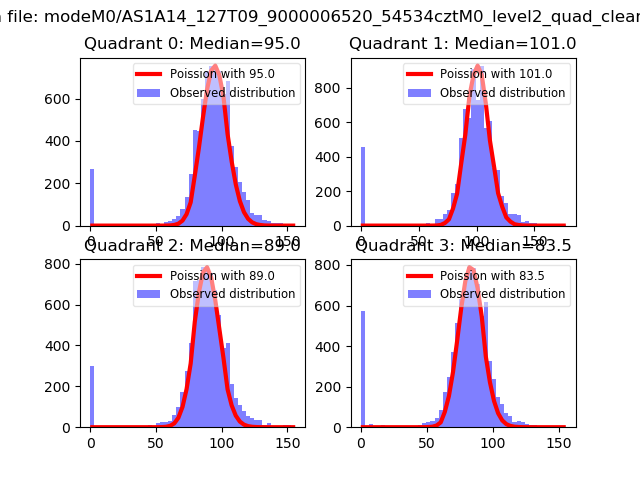 |
 |
| Quadrant-wise count rates Data is divided into 100 sec bins |
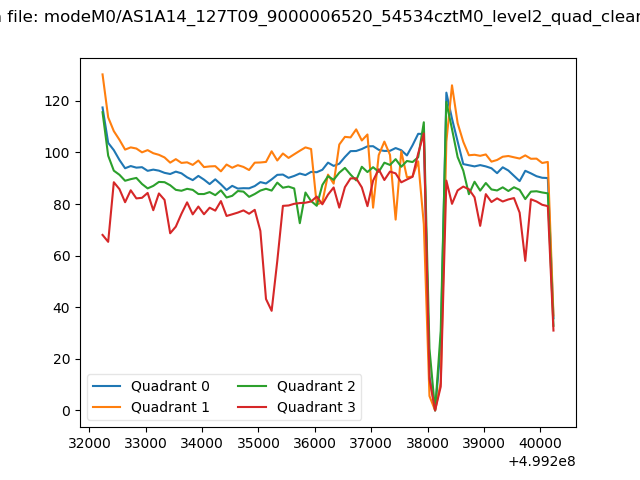 |
|
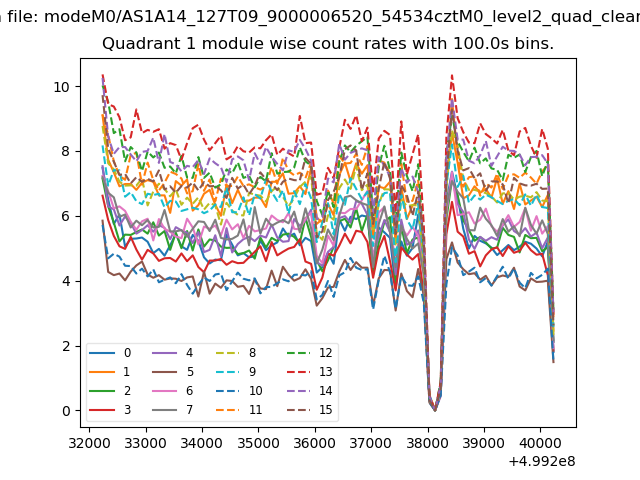
| Module-wise count rates for Quadrant A Data is divided into 100 sec bins |
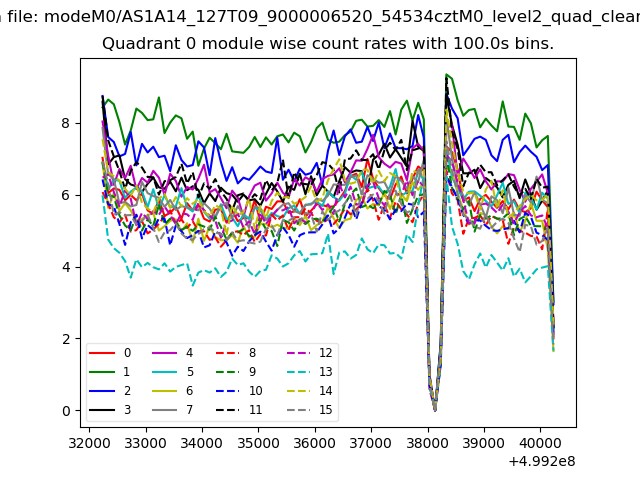 |
 |
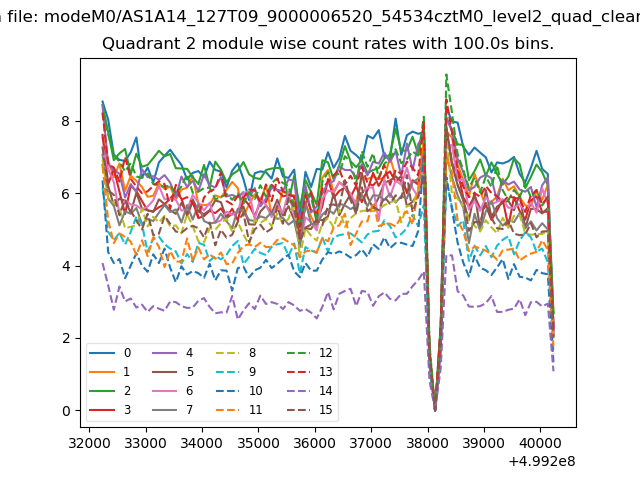
| Module-wise count rates for Quadrant B Data is divided into 100 sec bins |
 |
 |
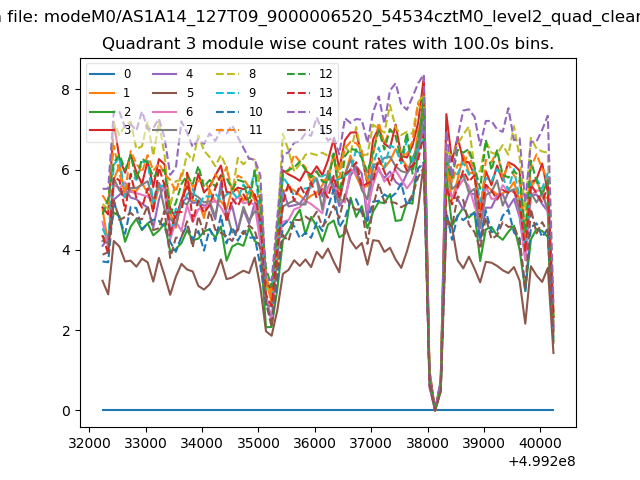
| Module-wise count rates for Quadrant C Data is divided into 100 sec bins |
 |
 |
| Module-wise count rates for Quadrant D Data is divided into 100 sec bins |
 |
 |
| Parameter | Plot |
|---|---|
| CZT HV Monitor | 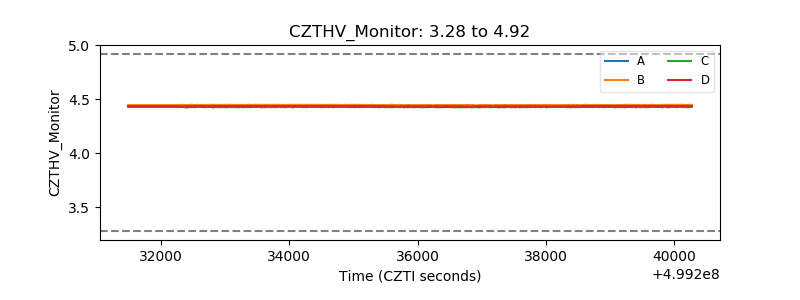 |
| D_VDD | 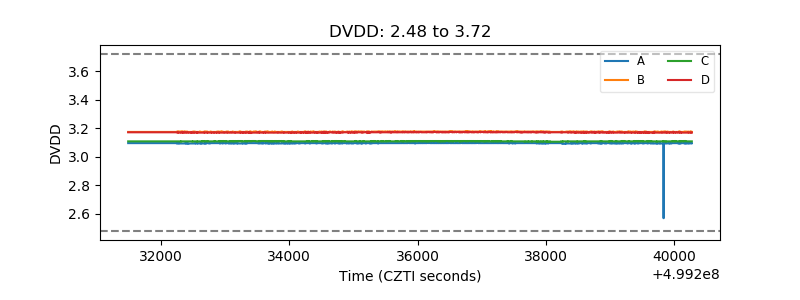 |
| Temperature 1 | 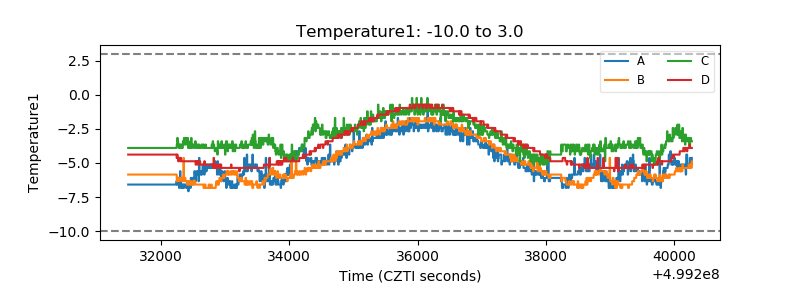 |
| Veto HV Monitor | 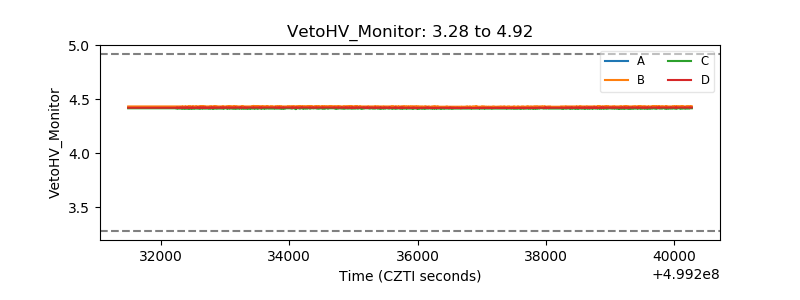 |
| Veto LLD | 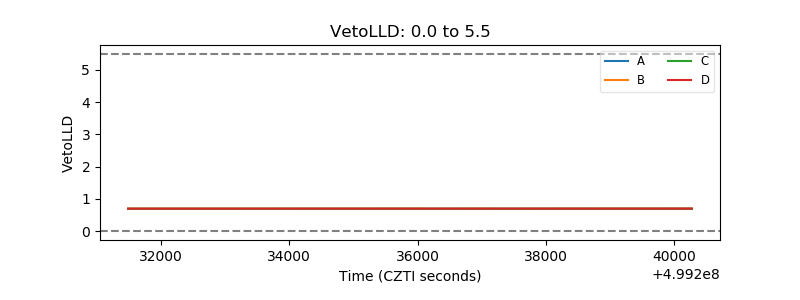 |
| Alpha Counter | 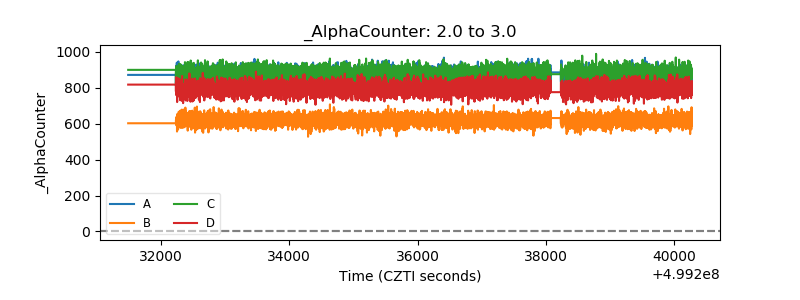 |
| _CPM_Rate | 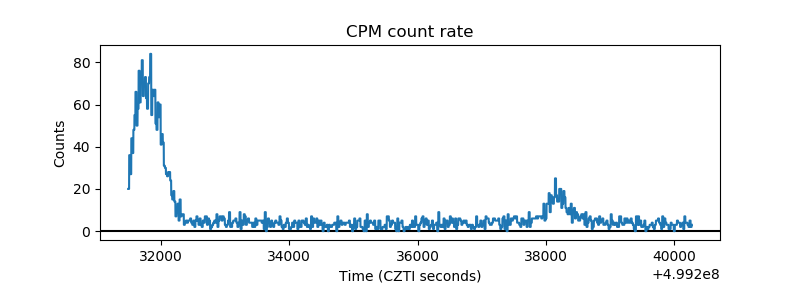 |
| CZT Counter | 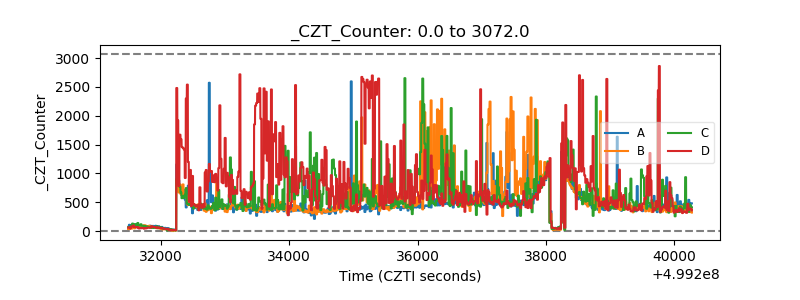 |
| +2.5 Volts monitor | 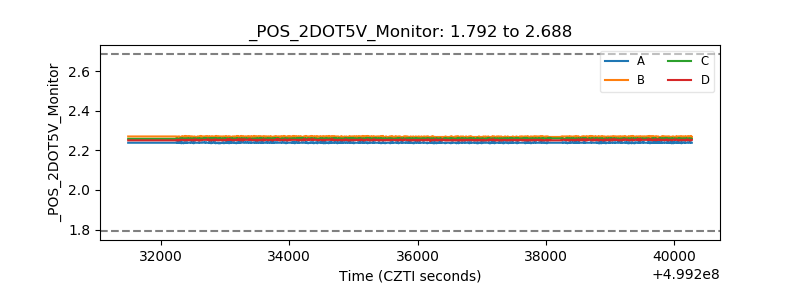 |
| +5 Volts monitor | 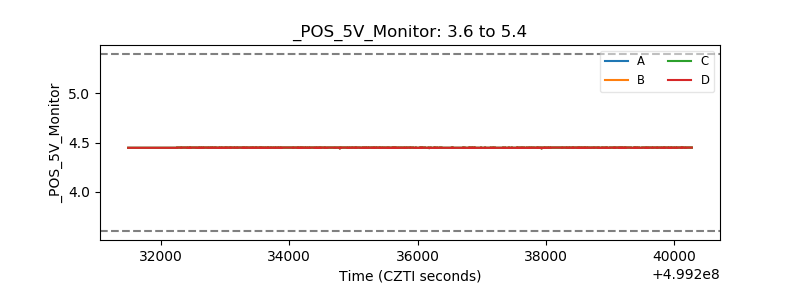 |
| _ROLL_ROT | 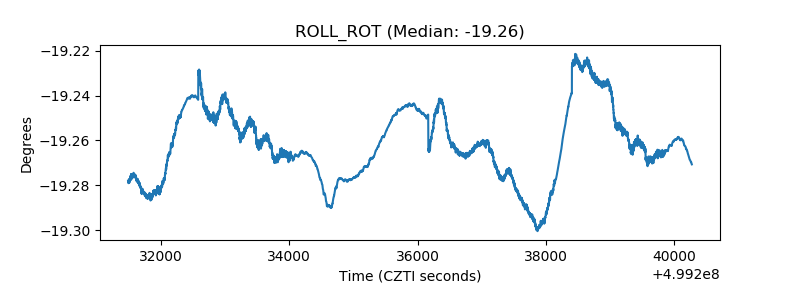 |
| _Roll_DEC | 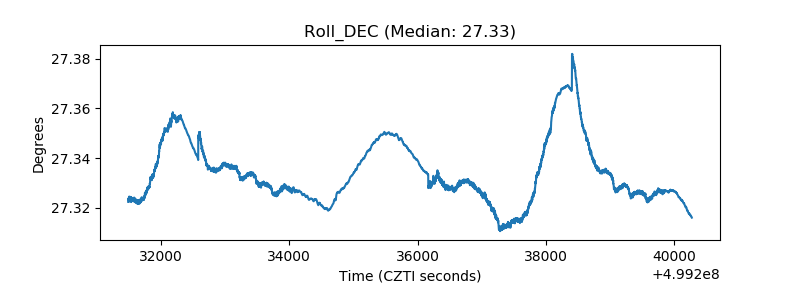 |
| _Roll_RA | 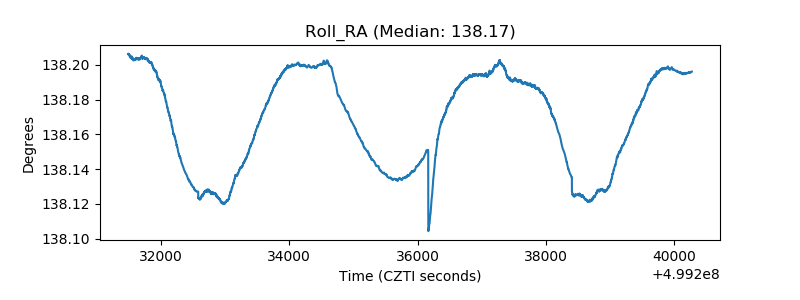 |
| Veto Counter | 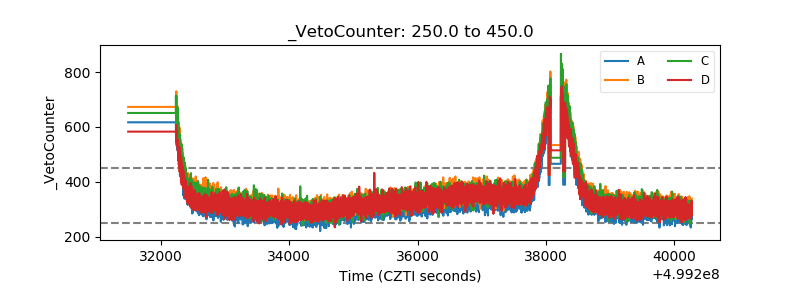 |