| Param | Original file | Final file |
|---|---|---|
| Filename | modeM0/AS1A14_127T09_9000006520_54535cztM0_level2.fits | modeM0/AS1A14_127T09_9000006520_54535cztM0_level2_quad_clean.evt |
| Size (bytes) | 447,232,320 | 101,900,160 |
| Size | 426.5 MB | 97.2 MB |
| Events in quadrant A | 4,265,978 | 665,367 |
| Events in quadrant B | 3,502,900 | 718,111 |
| Events in quadrant C | 4,070,299 | 618,197 |
| Events in quadrant D | 4,160,485 | 585,962 |
| Mode M0 | |||
|---|---|---|---|
| Quadrant | BADHDUFLAG | Total packets | Discarded packets |
| A | 0 | 17454 | 0 |
| B | 0 | 15659 | 0 |
| C | 0 | 17393 | 7 |
| D | 0 | 17517 | 0 |
| Mode SS | |||
|---|---|---|---|
| Quadrant | BADHDUFLAG | Total packets | Discarded packets |
| A | 0 | 144 | 0 |
| B | 0 | 144 | 0 |
| C | 0 | 144 | 0 |
| D | 0 | 144 | 0 |
| Quadrant | Total seconds | Saturated seconds | Saturation percentage |
|---|---|---|---|
| A | 7144 | 89 | 1.245801% |
| B | 7145 | 37 | 0.517845% |
| C | 7144 | 222 | 3.107503% |
| D | 7144 | 189 | 2.645577% |
Noise dominated data is calculated using 1-second bins in cleaned event files. If a bin has >2000 counts, and if more than 50% of those come from <1% of pixels, then it is considered to be noise-dominated and hence unusable.
| Quadrant | # 1 sec bins | Bins with >0 counts | Bins with >2000 counts | High rate bins dominated by noise | Noise dominated (total time) | Noise dominated (detector-on time) | Marked lightcurve |
|---|---|---|---|---|---|---|---|
| A | 7144 | 7144 | 80 | 80 | 1.12% | 1.12% | 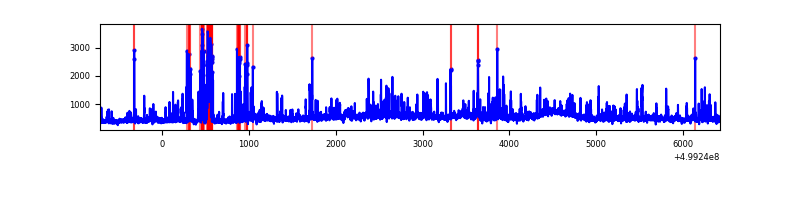 |
| B | 7145 | 7145 | 15 | 15 | 0.21% | 0.21% | 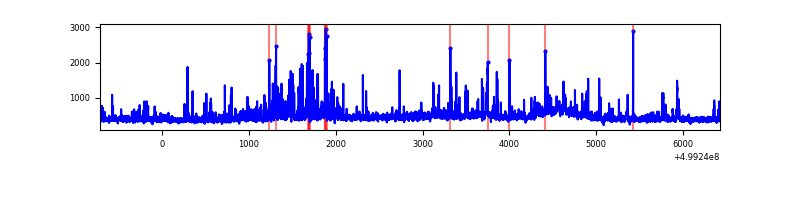 |
| C | 7143 | 7143 | 200 | 200 | 2.80% | 2.80% | 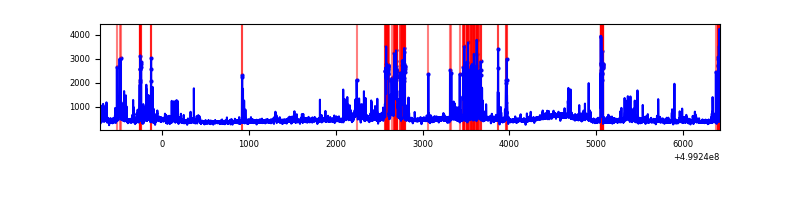 |
| D | 7144 | 7144 | 180 | 180 | 2.52% | 2.52% | 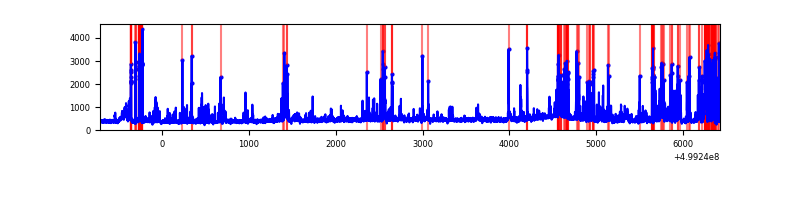 |
Top three noisy pixels from each quadrant. If the there are fewer than three noisy pixels in the level2.evt file, extra rows are filled as -1
| Pixel properties | Quadrant properties | ||||||
|---|---|---|---|---|---|---|---|
| Quadrant | DetID | PixID | Counts | Sigma | Mean | Median | Sigma |
| A | 3 | 14 | 575632 | 3055.44 | 761 | 743 | 188.2 |
| A | 4 | 249 | 312841 | 1658.75 | 761 | 743 | 188.2 |
| A | 11 | 3 | 287350 | 1523.27 | 761 | 743 | 188.2 |
| B | 10 | 14 | 298614 | 1834.87 | 756 | 729 | 162.3 |
| B | 10 | 247 | 53709 | 326.34 | 756 | 729 | 162.3 |
| B | 0 | 213 | 33884 | 204.22 | 756 | 729 | 162.3 |
| C | 13 | 3 | 385086 | 1917.26 | 729 | 724 | 200.5 |
| C | 4 | 5 | 376218 | 1873.02 | 729 | 724 | 200.5 |
| C | 12 | 252 | 237761 | 1182.38 | 729 | 724 | 200.5 |
| D | 3 | 224 | 679658 | 3304.84 | 727 | 694 | 205.4 |
| D | 2 | 172 | 255178 | 1238.7 | 727 | 694 | 205.4 |
| D | 6 | 239 | 138453 | 670.54 | 727 | 694 | 205.4 |
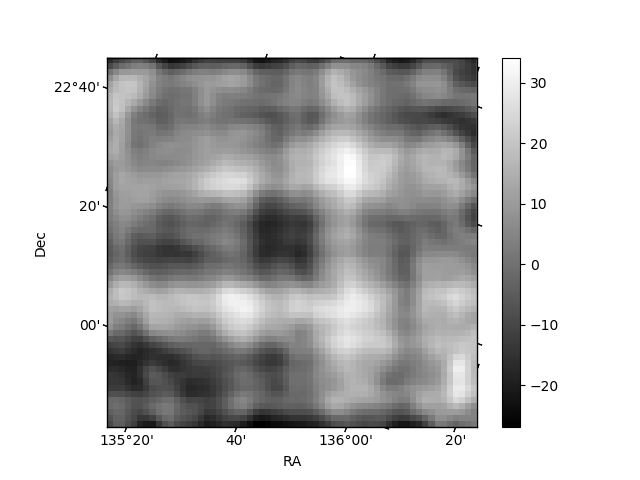
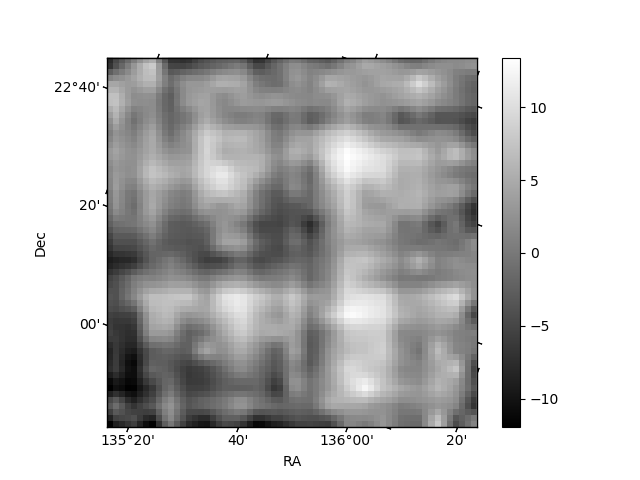
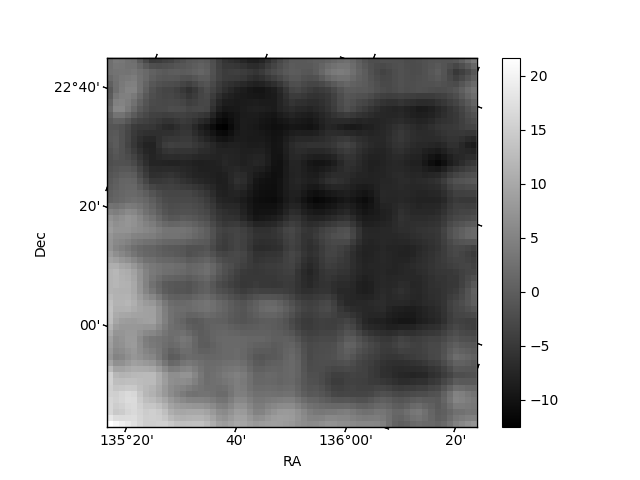
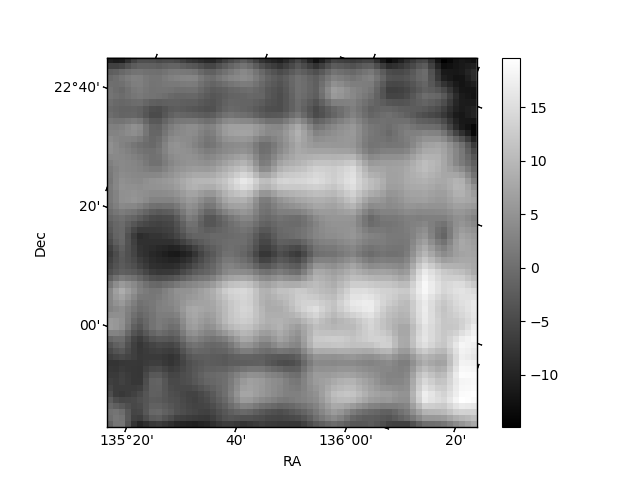
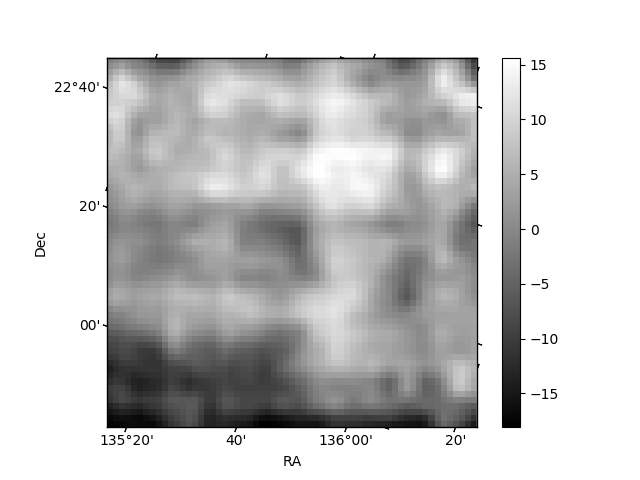
Histogram calculated using DETX and DETY for each event in the final _common_clean file
| Quadrant A | 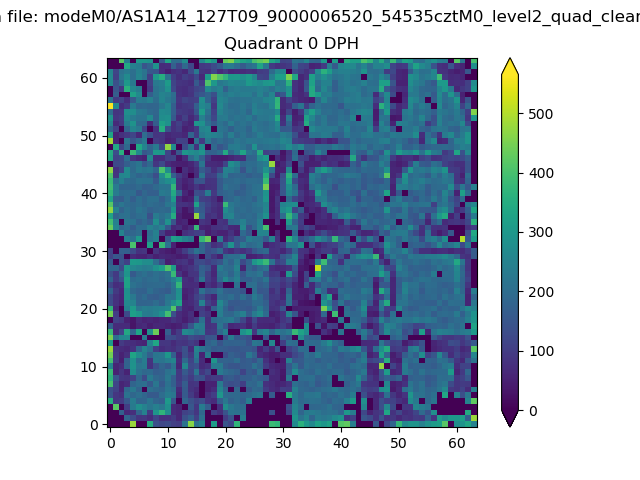 |
 |
Quadrant B |
|---|---|---|---|
| Quadrant D | 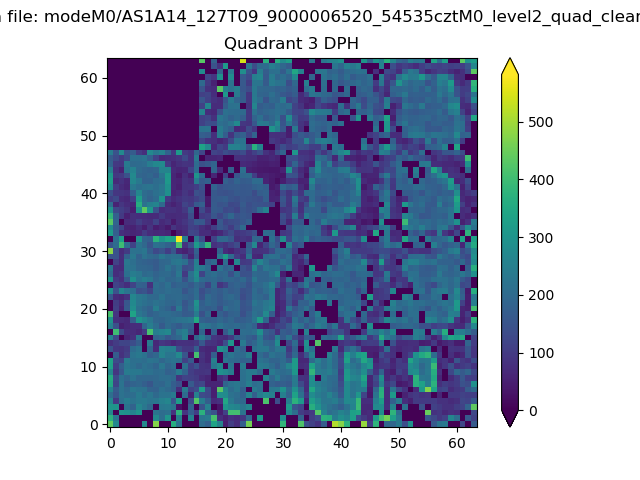 |
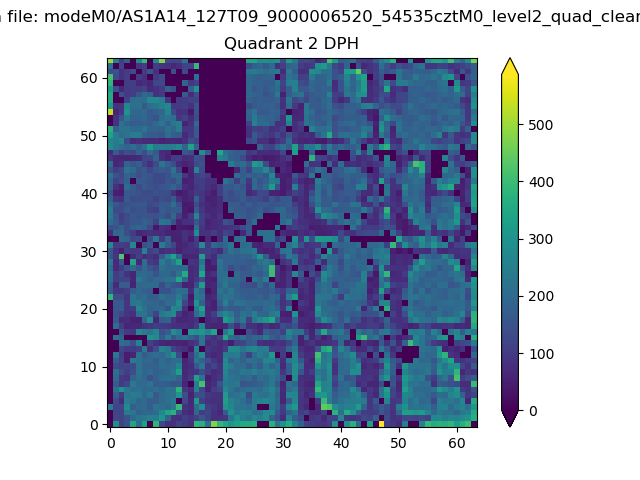 |
Quadrant C |
| Plot type | Count rate plots | Images |
|---|---|---|
| Comparison with Poisson distribution Blue bars denote a histogram of data divided into 1 sec bins. Red curve is a Poisson curve with rate = median count rate of data. |
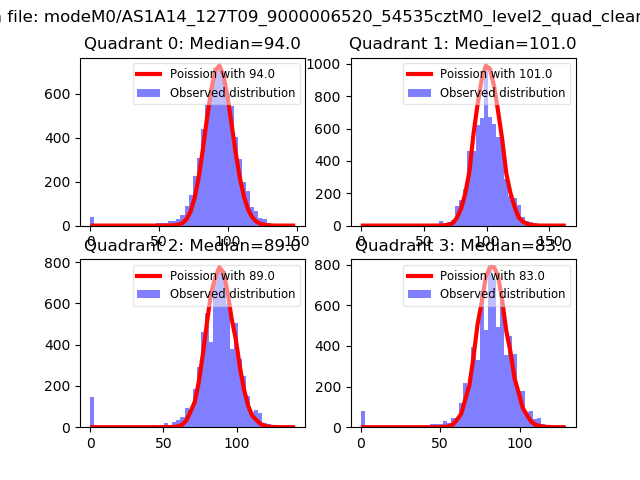 |
 |
| Quadrant-wise count rates Data is divided into 100 sec bins |
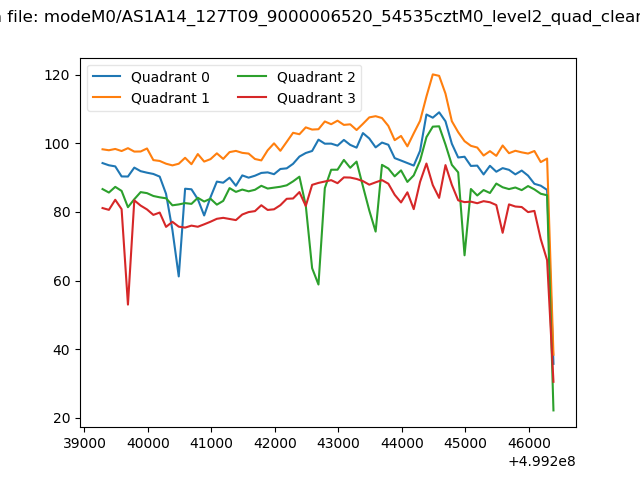 |
|
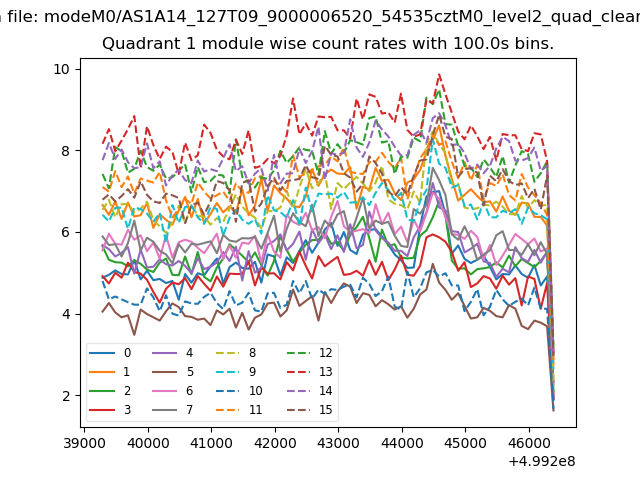
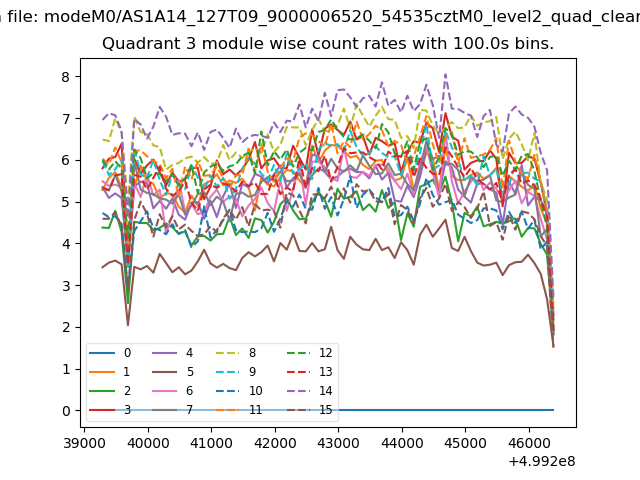
| Module-wise count rates for Quadrant A Data is divided into 100 sec bins |
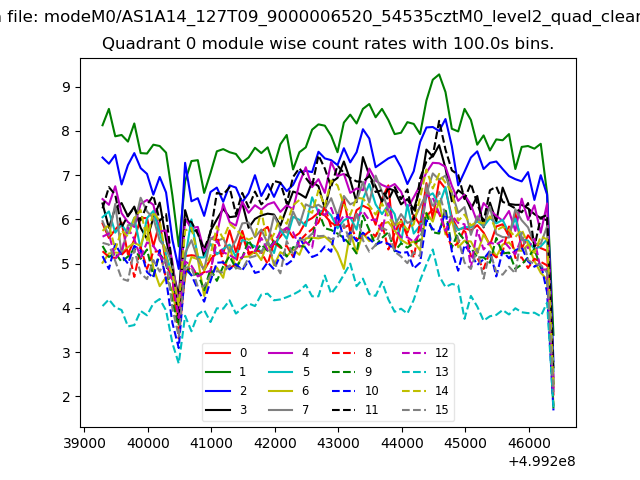 |
 |
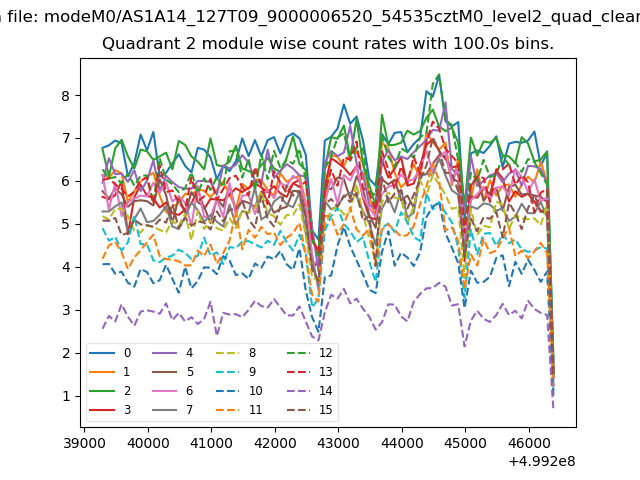
| Module-wise count rates for Quadrant B Data is divided into 100 sec bins |
 |
 |
| Module-wise count rates for Quadrant C Data is divided into 100 sec bins |
 |
 |
| Module-wise count rates for Quadrant D Data is divided into 100 sec bins |
 |
 |
| Parameter | Plot |
|---|---|
| CZT HV Monitor | 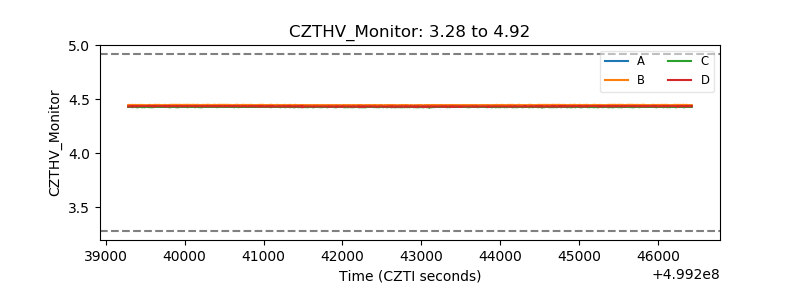 |
| D_VDD | 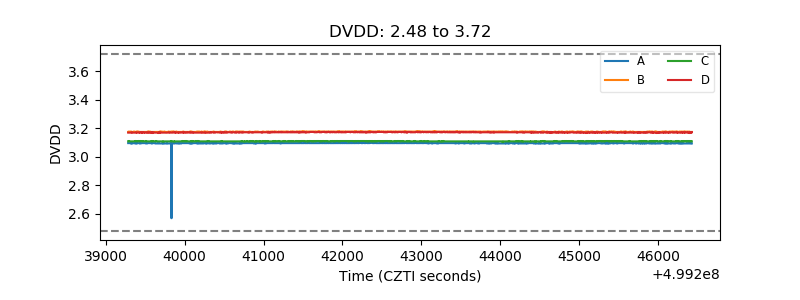 |
| Temperature 1 | 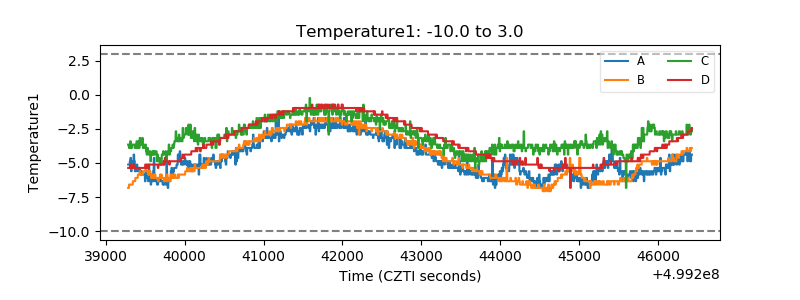 |
| Veto HV Monitor | 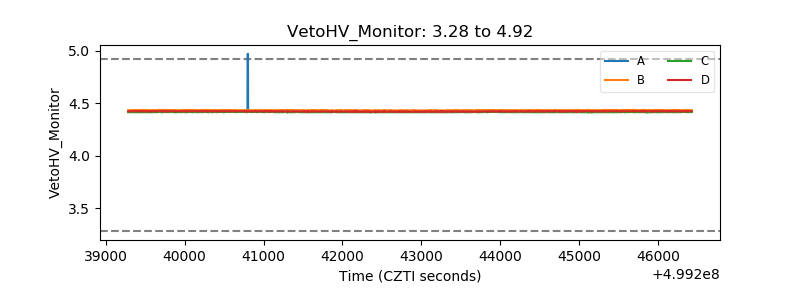 |
| Veto LLD | 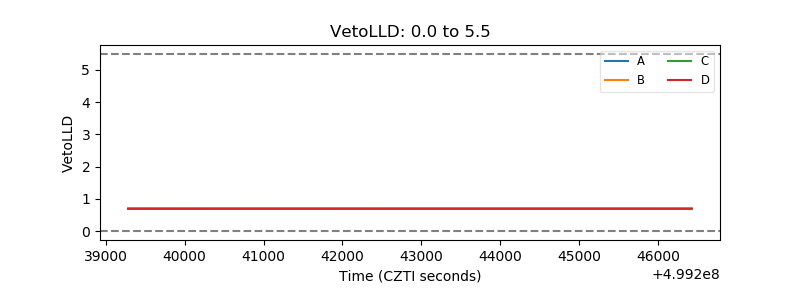 |
| Alpha Counter | 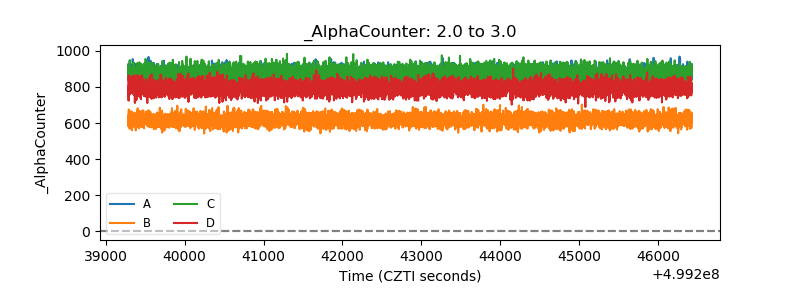 |
| _CPM_Rate | 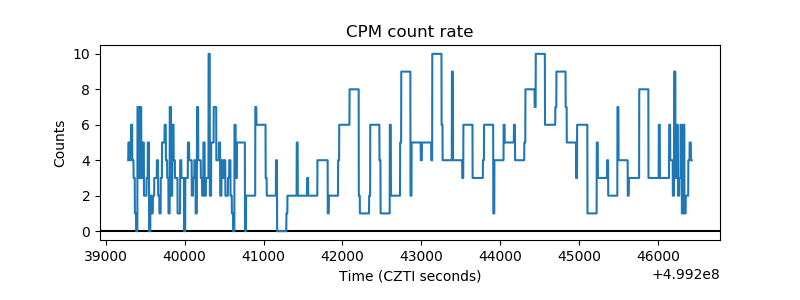 |
| CZT Counter | 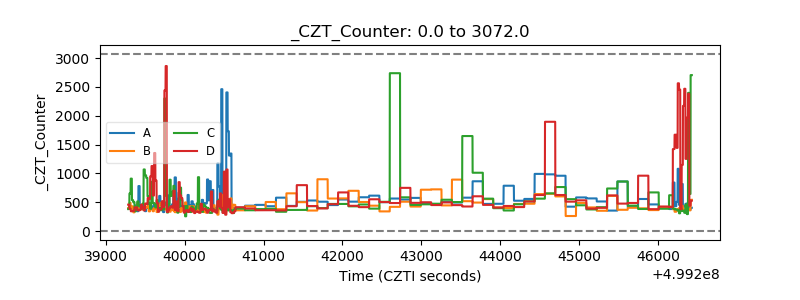 |
| +2.5 Volts monitor |  |
| +5 Volts monitor |  |
| _ROLL_ROT | 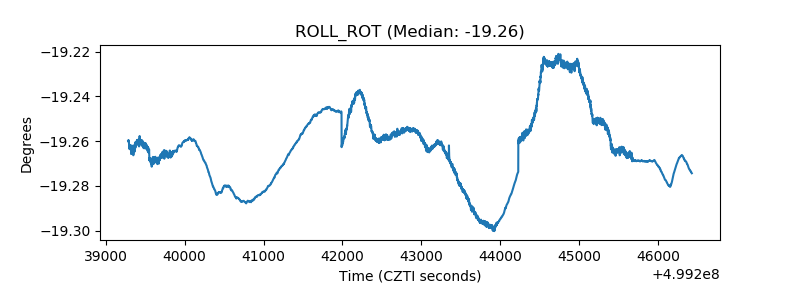 |
| _Roll_DEC | 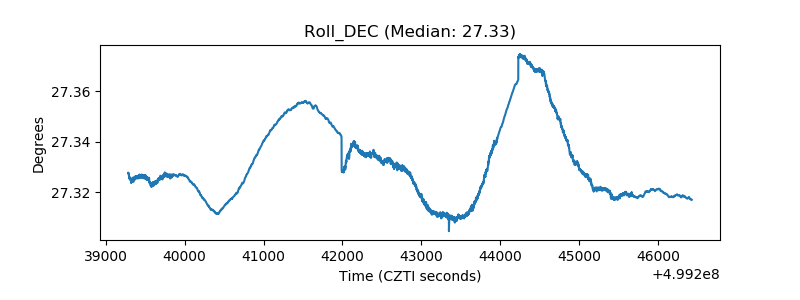 |
| _Roll_RA | 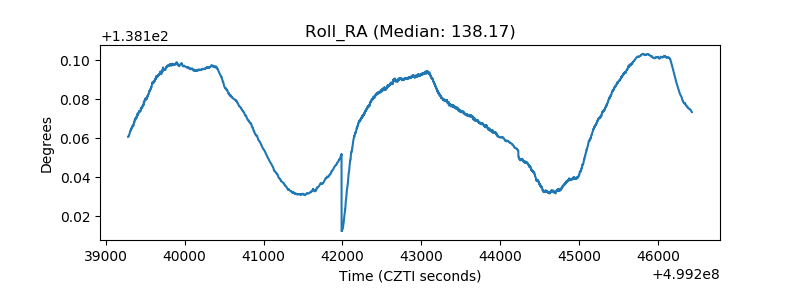 |
| Veto Counter | 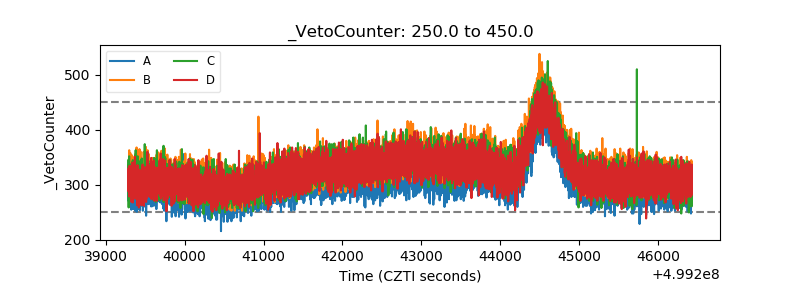 |