| Param | Original file | Final file |
|---|---|---|
| Filename | modeM0/AS1A14_127T09_9000006520_54536cztM0_level2.fits | modeM0/AS1A14_127T09_9000006520_54536cztM0_level2_quad_clean.evt |
| Size (bytes) | 504,230,400 | 100,019,520 |
| Size | 480.9 MB | 95.4 MB |
| Events in quadrant A | 4,481,428 | 657,412 |
| Events in quadrant B | 4,328,980 | 698,927 |
| Events in quadrant C | 5,314,673 | 592,745 |
| Events in quadrant D | 3,988,654 | 585,192 |
| Mode M0 | |||
|---|---|---|---|
| Quadrant | BADHDUFLAG | Total packets | Discarded packets |
| A | 0 | 18089 | 77 |
| B | 0 | 17927 | 35 |
| C | 0 | 20933 | 73 |
| D | 0 | 16972 | 22 |
| Mode SS | |||
|---|---|---|---|
| Quadrant | BADHDUFLAG | Total packets | Discarded packets |
| A | 0 | 142 | 0 |
| B | 0 | 141 | 1 |
| C | 0 | 142 | 0 |
| D | 0 | 141 | 0 |
| Quadrant | Total seconds | Saturated seconds | Saturation percentage |
|---|---|---|---|
| A | 7087 | 84 | 1.185269% |
| B | 7103 | 188 | 2.646769% |
| C | 7095 | 486 | 6.849894% |
| D | 7108 | 138 | 1.941474% |
Noise dominated data is calculated using 1-second bins in cleaned event files. If a bin has >2000 counts, and if more than 50% of those come from <1% of pixels, then it is considered to be noise-dominated and hence unusable.
| Quadrant | # 1 sec bins | Bins with >0 counts | Bins with >2000 counts | High rate bins dominated by noise | Noise dominated (total time) | Noise dominated (detector-on time) | Marked lightcurve |
|---|---|---|---|---|---|---|---|
| A | 7121 | 7111 | 77 | 77 | 1.08% | 1.08% | 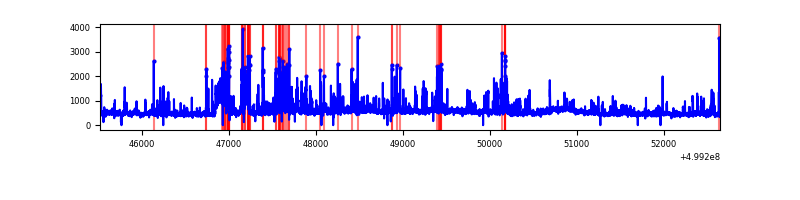 |
| B | 7122 | 7118 | 124 | 124 | 1.74% | 1.74% | 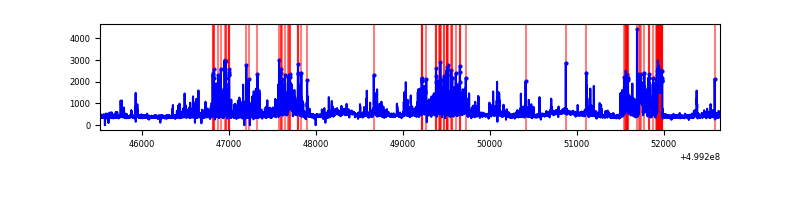 |
| C | 7122 | 7111 | 468 | 468 | 6.57% | 6.58% | 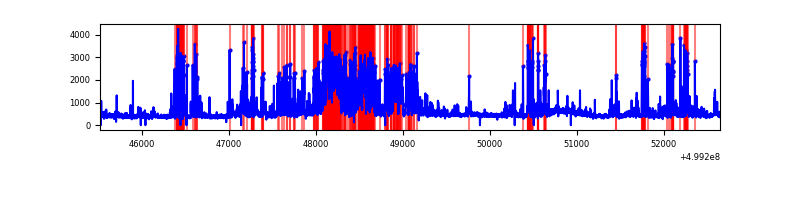 |
| D | 7122 | 7118 | 146 | 146 | 2.05% | 2.05% | 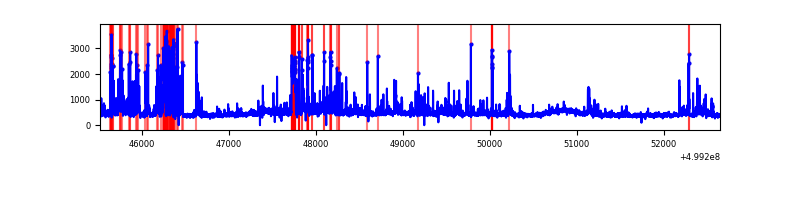 |
Top three noisy pixels from each quadrant. If the there are fewer than three noisy pixels in the level2.evt file, extra rows are filled as -1
| Pixel properties | Quadrant properties | ||||||
|---|---|---|---|---|---|---|---|
| Quadrant | DetID | PixID | Counts | Sigma | Mean | Median | Sigma |
| A | 3 | 14 | 620361 | 3325.05 | 752 | 733 | 186.4 |
| A | 11 | 3 | 419319 | 2246.22 | 752 | 733 | 186.4 |
| A | 13 | 248 | 306121 | 1638.77 | 752 | 733 | 186.4 |
| B | 10 | 14 | 705341 | 4405.47 | 740 | 714 | 159.9 |
| B | 2 | 249 | 479324 | 2992.36 | 740 | 714 | 159.9 |
| B | 0 | 213 | 78454 | 486.05 | 740 | 714 | 159.9 |
| C | 12 | 252 | 1176083 | 6034.12 | 713 | 708 | 194.8 |
| C | 13 | 3 | 750464 | 3849.08 | 713 | 708 | 194.8 |
| C | 4 | 5 | 268890 | 1376.79 | 713 | 708 | 194.8 |
| D | 3 | 224 | 415119 | 2033.49 | 724 | 693 | 203.8 |
| D | 2 | 172 | 157415 | 769.0 | 724 | 693 | 203.8 |
| D | 13 | 84 | 102045 | 497.31 | 724 | 693 | 203.8 |
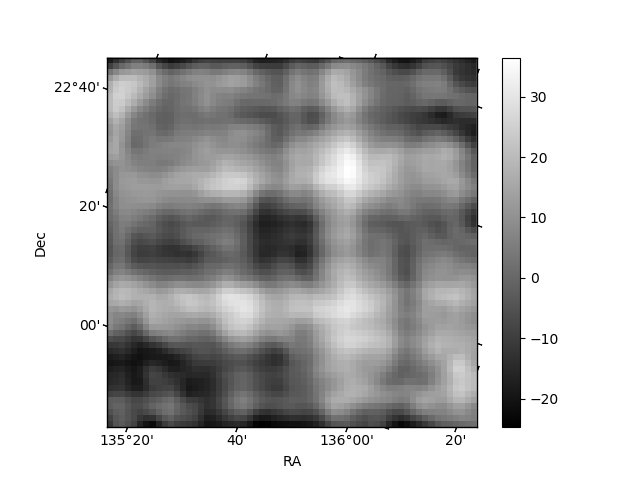
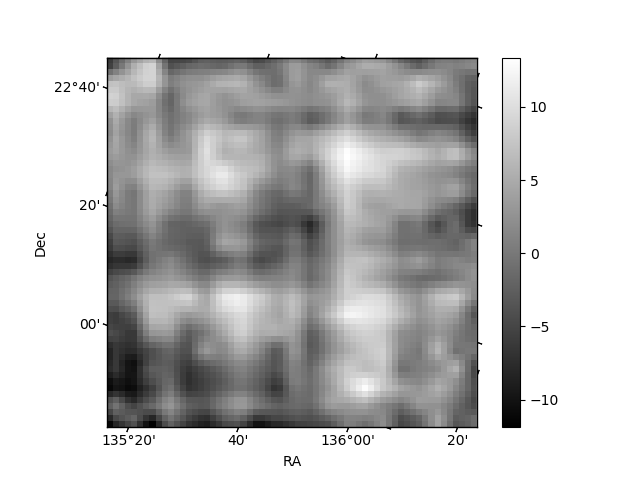
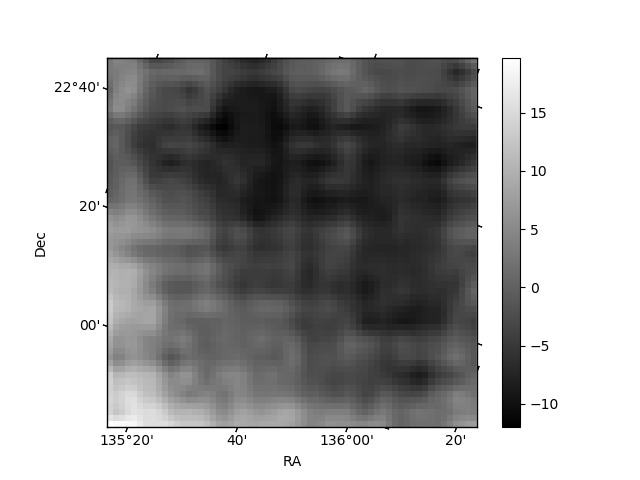
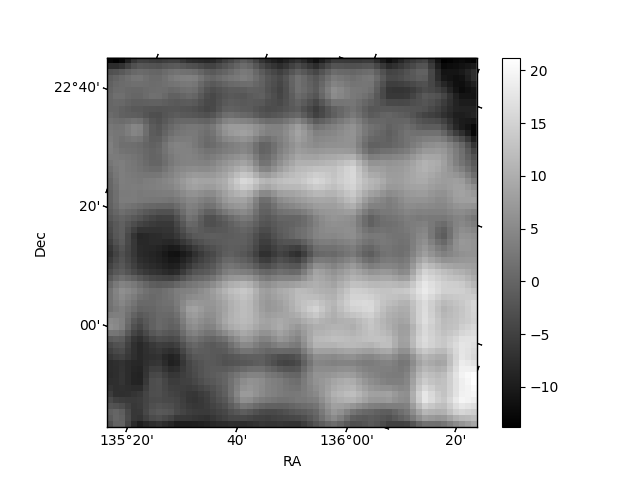
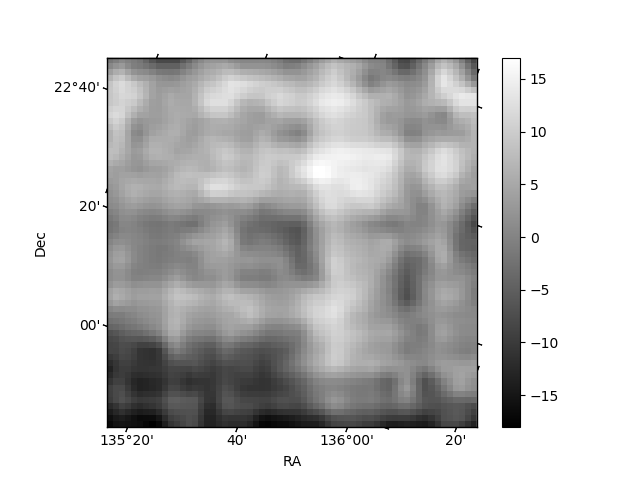
Histogram calculated using DETX and DETY for each event in the final _common_clean file
| Quadrant A | 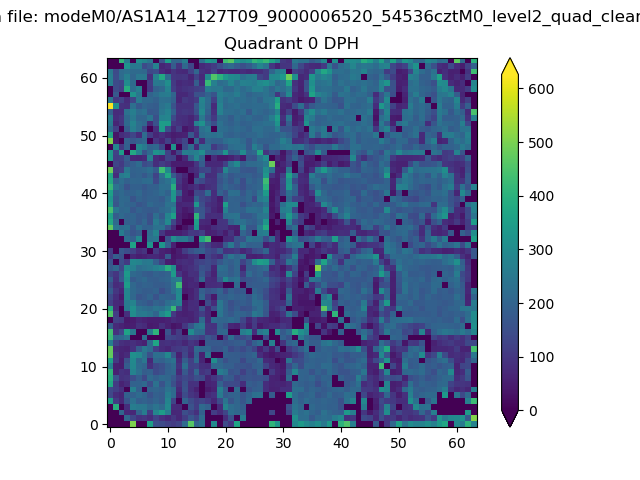 |
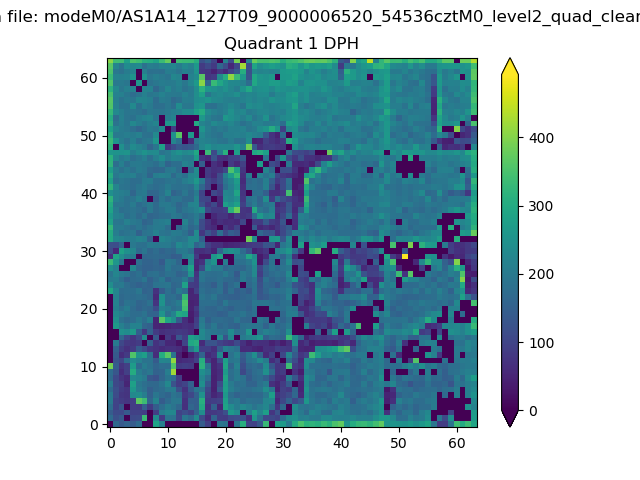 |
Quadrant B |
|---|---|---|---|
| Quadrant D | 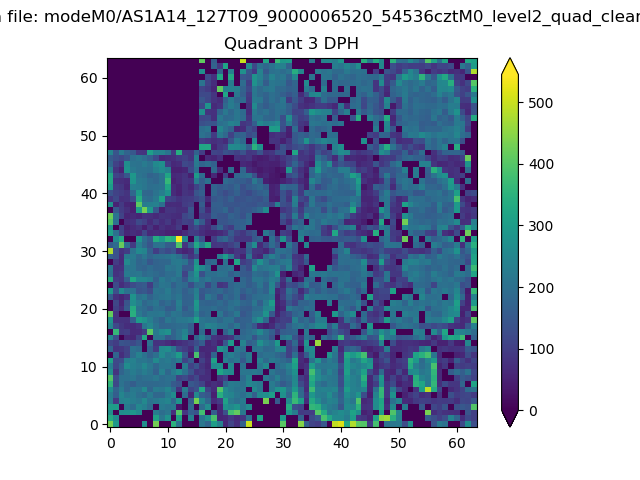 |
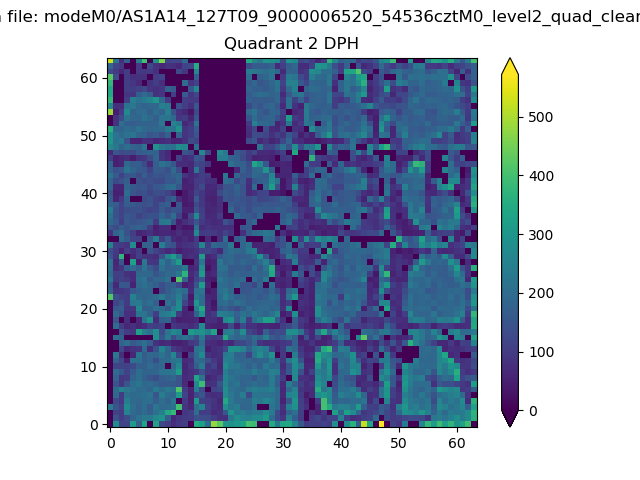 |
Quadrant C |
| Plot type | Count rate plots | Images |
|---|---|---|
| Comparison with Poisson distribution Blue bars denote a histogram of data divided into 1 sec bins. Red curve is a Poisson curve with rate = median count rate of data. |
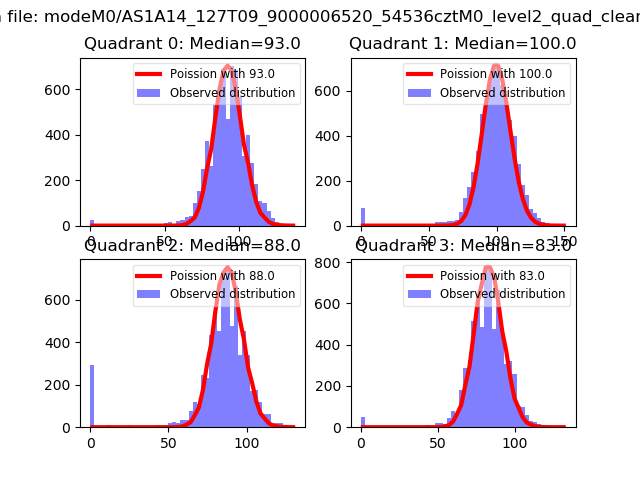 |
 |
| Quadrant-wise count rates Data is divided into 100 sec bins |
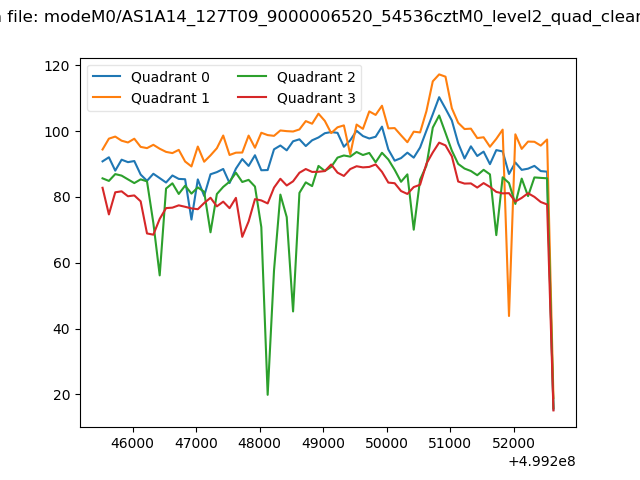 |
|
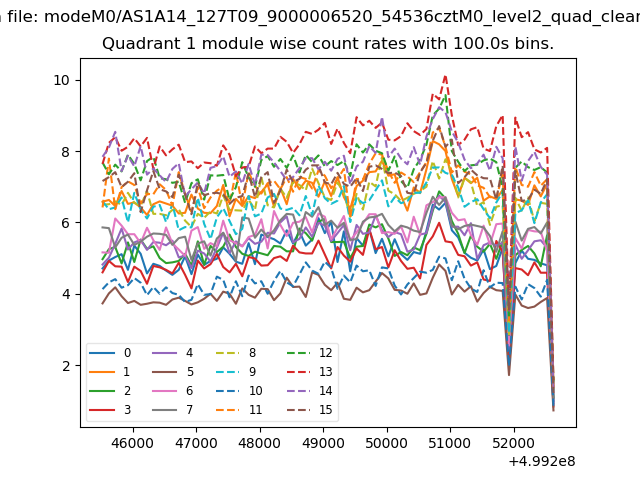
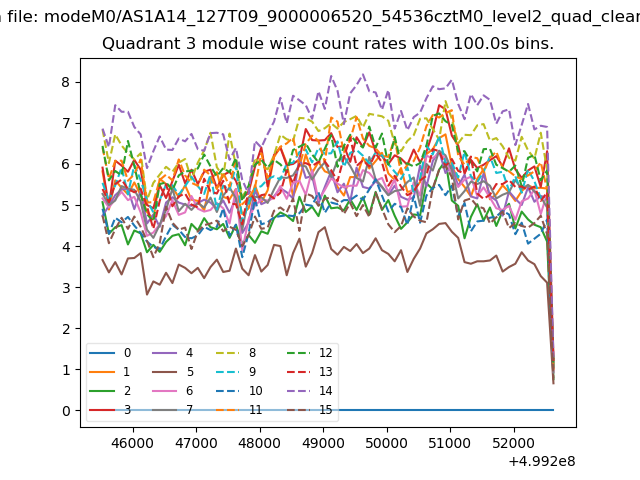
| Module-wise count rates for Quadrant A Data is divided into 100 sec bins |
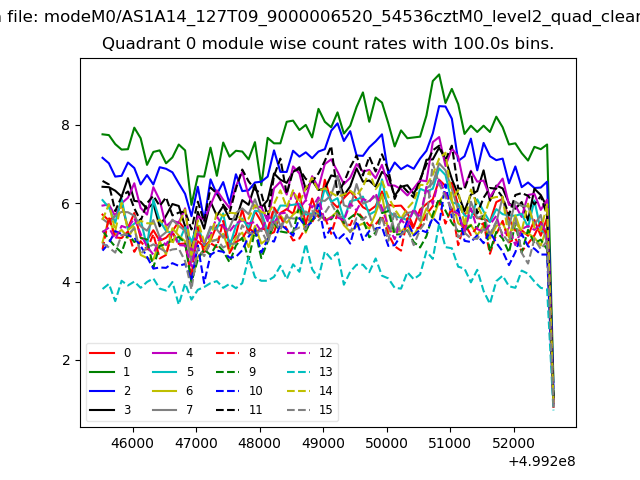 |
 |
| Module-wise count rates for Quadrant B Data is divided into 100 sec bins |
 |
 |
| Module-wise count rates for Quadrant C Data is divided into 100 sec bins |
 |
 |
| Module-wise count rates for Quadrant D Data is divided into 100 sec bins |
 |
 |
| Parameter | Plot |
|---|---|
| CZT HV Monitor | 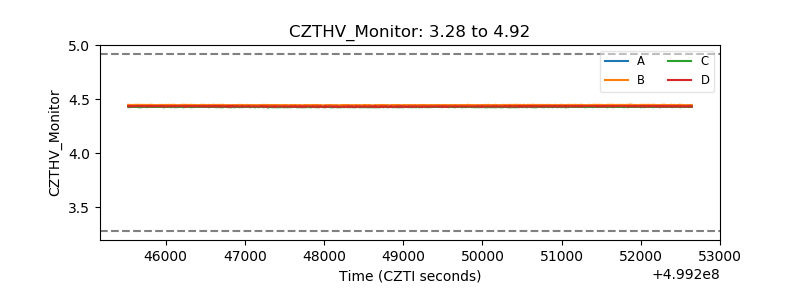 |
| D_VDD | 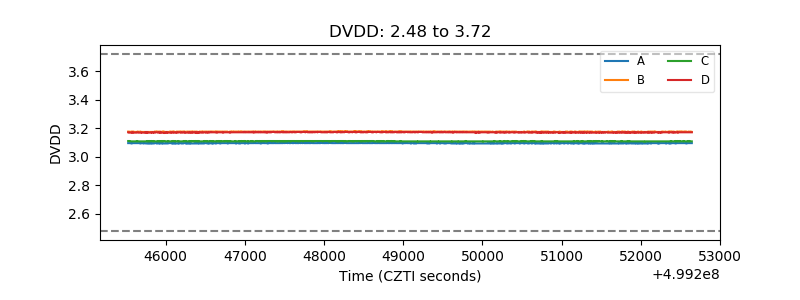 |
| Temperature 1 | 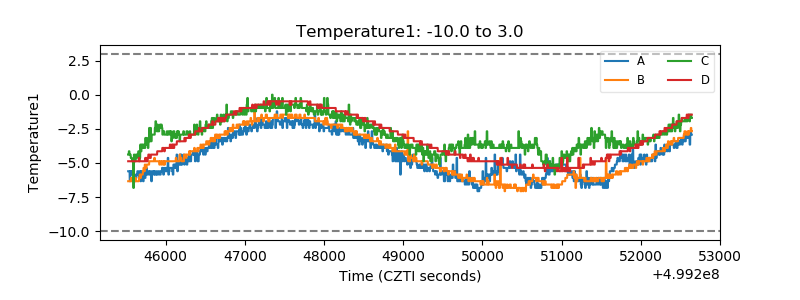 |
| Veto HV Monitor | 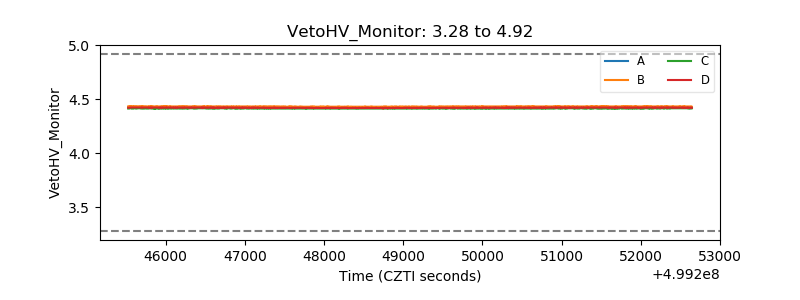 |
| Veto LLD | 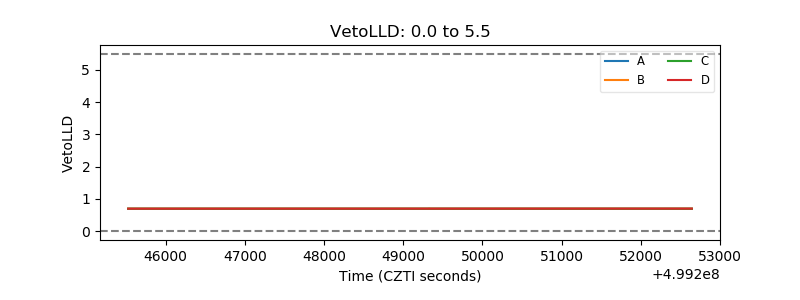 |
| Alpha Counter | 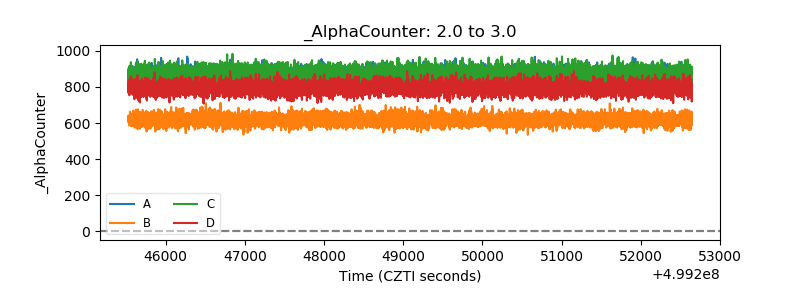 |
| _CPM_Rate | 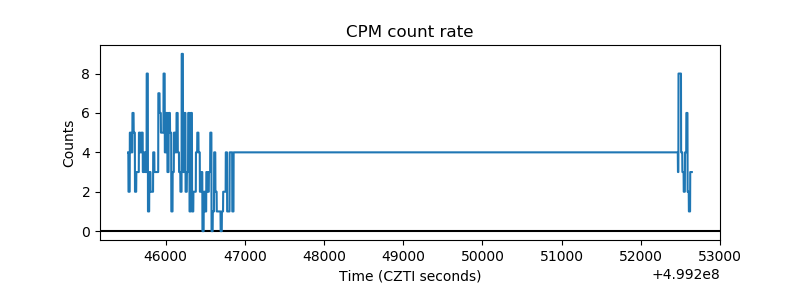 |
| CZT Counter | 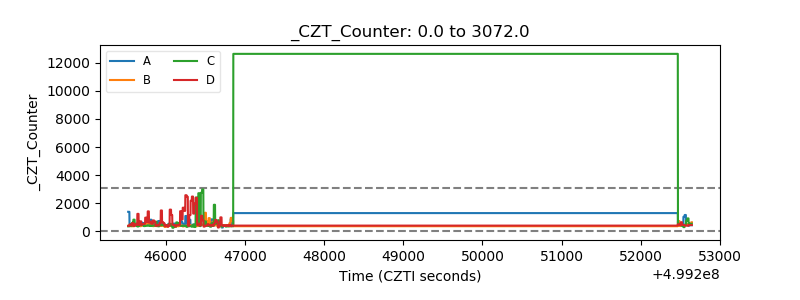 |
| +2.5 Volts monitor |  |
| +5 Volts monitor |  |
| _ROLL_ROT | 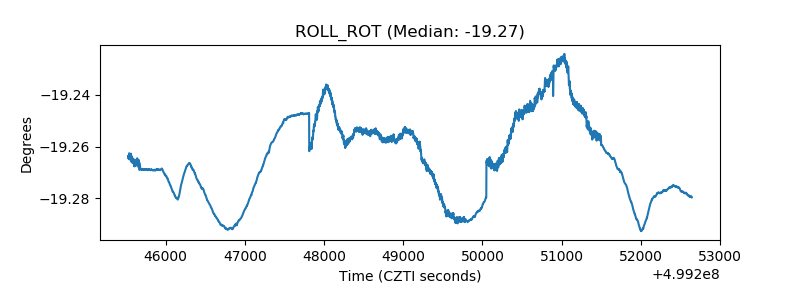 |
| _Roll_DEC | 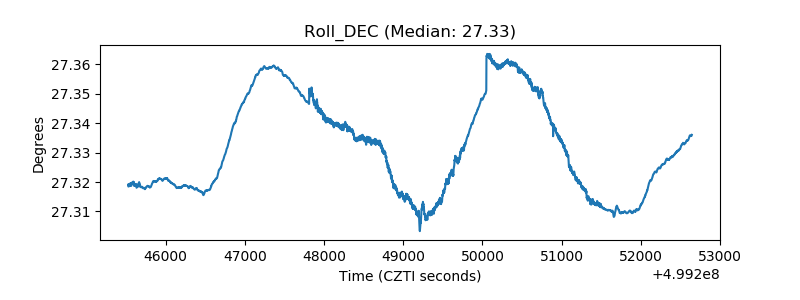 |
| _Roll_RA | 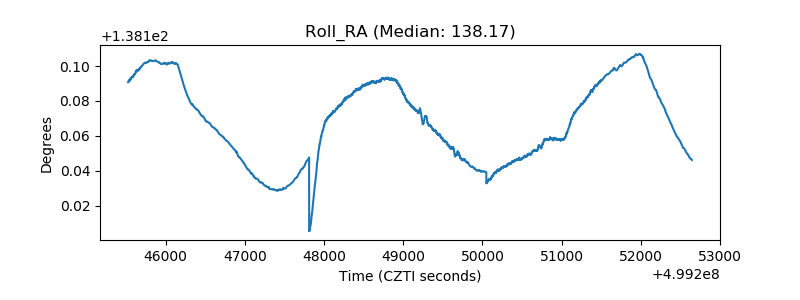 |
| Veto Counter | 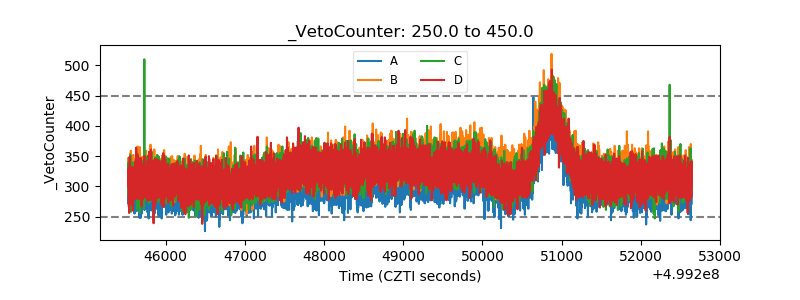 |