| Param | Original file | Final file |
|---|---|---|
| Filename | modeM0/AS1A14_127T09_9000006520_54539cztM0_level2.fits | modeM0/AS1A14_127T09_9000006520_54539cztM0_level2_quad_clean.evt |
| Size (bytes) | 742,726,080 | 153,244,800 |
| Size | 708.3 MB | 146.1 MB |
| Events in quadrant A | 6,393,507 | 1,006,868 |
| Events in quadrant B | 6,287,524 | 1,064,894 |
| Events in quadrant C | 8,459,672 | 915,091 |
| Events in quadrant D | 5,508,394 | 898,704 |
| Mode M0 | |||
|---|---|---|---|
| Quadrant | BADHDUFLAG | Total packets | Discarded packets |
| A | 0 | 26022 | 0 |
| B | 0 | 26407 | 0 |
| C | 0 | 32667 | 0 |
| D | 0 | 24207 | 1 |
| Mode SS | |||
|---|---|---|---|
| Quadrant | BADHDUFLAG | Total packets | Discarded packets |
| A | 0 | 218 | 0 |
| B | 0 | 218 | 0 |
| C | 0 | 218 | 0 |
| D | 0 | 218 | 0 |
| Quadrant | Total seconds | Saturated seconds | Saturation percentage |
|---|---|---|---|
| A | 10893 | 178 | 1.634077% |
| B | 10892 | 381 | 3.497980% |
| C | 10893 | 752 | 6.903516% |
| D | 10892 | 130 | 1.193537% |
Noise dominated data is calculated using 1-second bins in cleaned event files. If a bin has >2000 counts, and if more than 50% of those come from <1% of pixels, then it is considered to be noise-dominated and hence unusable.
| Quadrant | # 1 sec bins | Bins with >0 counts | Bins with >2000 counts | High rate bins dominated by noise | Noise dominated (total time) | Noise dominated (detector-on time) | Marked lightcurve |
|---|---|---|---|---|---|---|---|
| A | 10893 | 10893 | 61 | 61 | 0.56% | 0.56% | 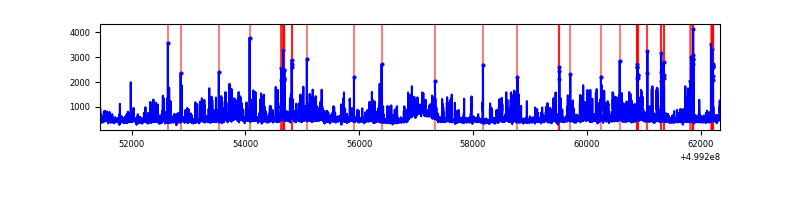 |
| B | 10892 | 10892 | 176 | 176 | 1.62% | 1.62% | 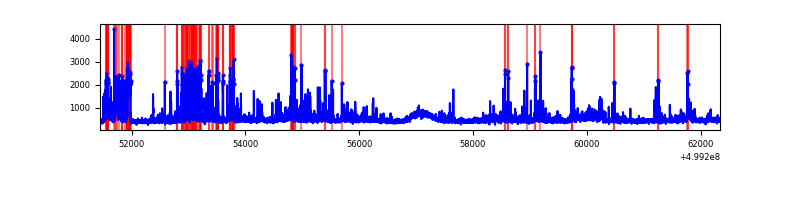 |
| C | 10893 | 10893 | 621 | 621 | 5.70% | 5.70% | 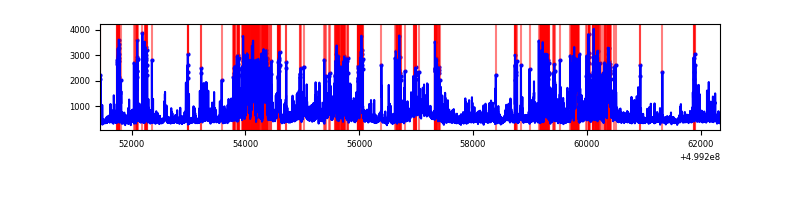 |
| D | 10893 | 10893 | 100 | 100 | 0.92% | 0.92% | 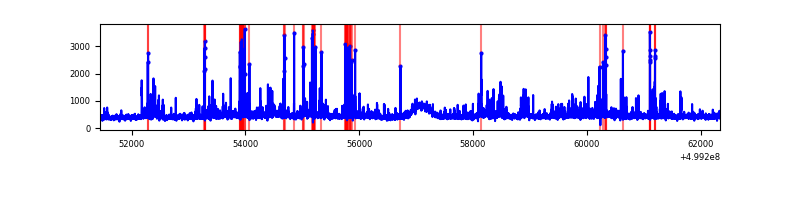 |
Top three noisy pixels from each quadrant. If the there are fewer than three noisy pixels in the level2.evt file, extra rows are filled as -1
| Pixel properties | Quadrant properties | ||||||
|---|---|---|---|---|---|---|---|
| Quadrant | DetID | PixID | Counts | Sigma | Mean | Median | Sigma |
| A | 11 | 3 | 766749 | 2639.46 | 1176 | 1148 | 290.1 |
| A | 3 | 14 | 518935 | 1785.11 | 1176 | 1148 | 290.1 |
| A | 4 | 249 | 171543 | 587.45 | 1176 | 1148 | 290.1 |
| B | 10 | 14 | 618486 | 2490.43 | 1151 | 1109 | 247.9 |
| B | 2 | 249 | 419235 | 1686.68 | 1151 | 1109 | 247.9 |
| B | 0 | 213 | 150693 | 603.41 | 1151 | 1109 | 247.9 |
| C | 12 | 252 | 2178357 | 7108.37 | 1122 | 1111 | 306.3 |
| C | 13 | 3 | 680422 | 2217.84 | 1122 | 1111 | 306.3 |
| C | 15 | 157 | 455093 | 1482.18 | 1122 | 1111 | 306.3 |
| D | 3 | 224 | 208025 | 643.45 | 1140 | 1089 | 321.6 |
| D | 3 | 12 | 162773 | 502.74 | 1140 | 1089 | 321.6 |
| D | 6 | 239 | 104407 | 321.26 | 1140 | 1089 | 321.6 |
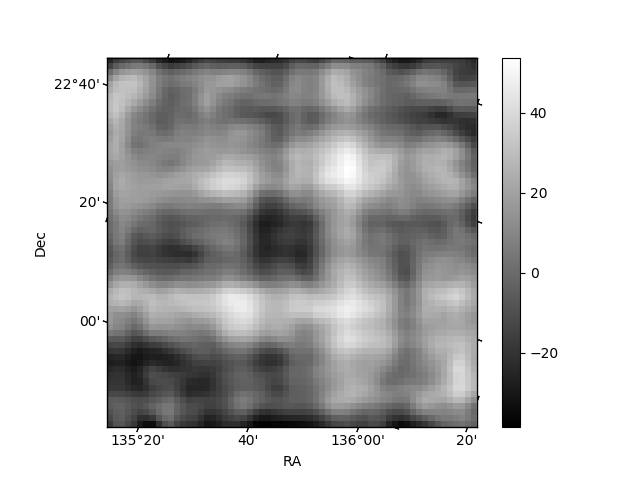
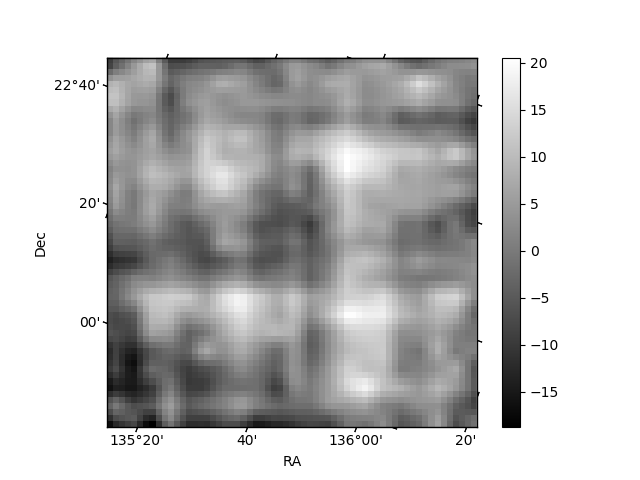
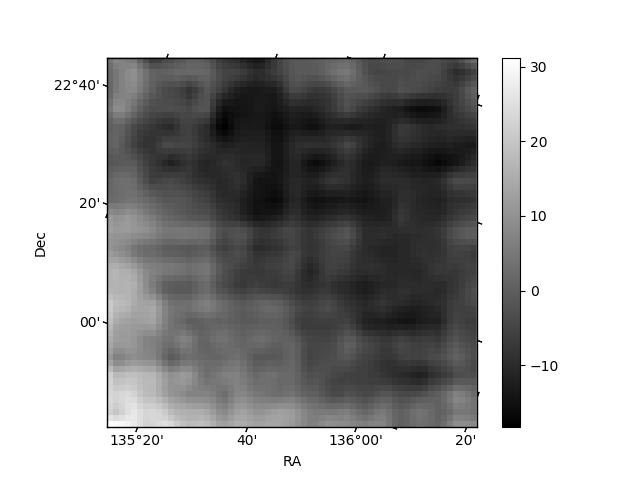
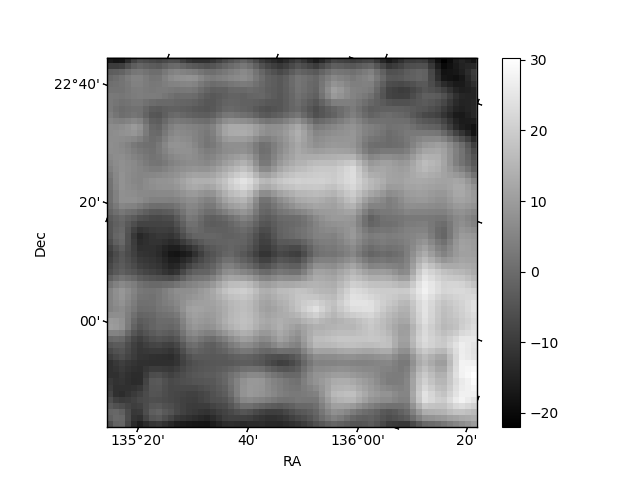
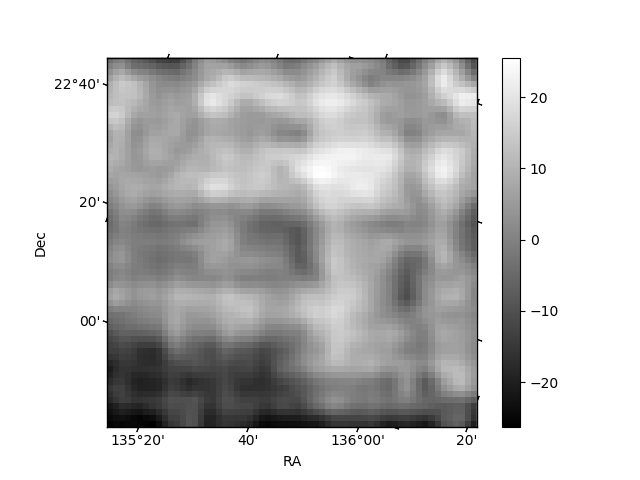
Histogram calculated using DETX and DETY for each event in the final _common_clean file
| Quadrant A | 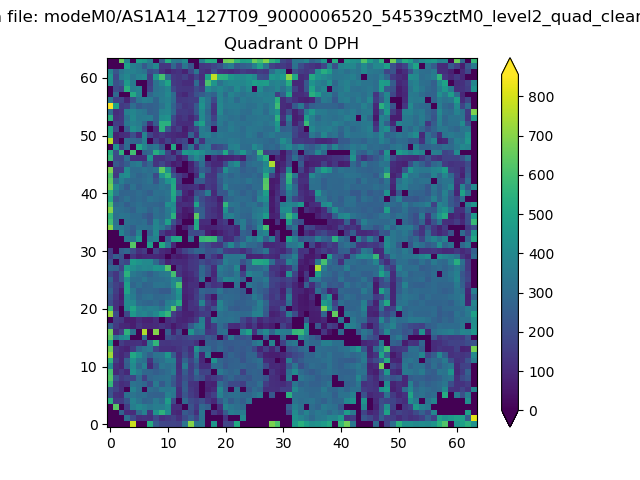 |
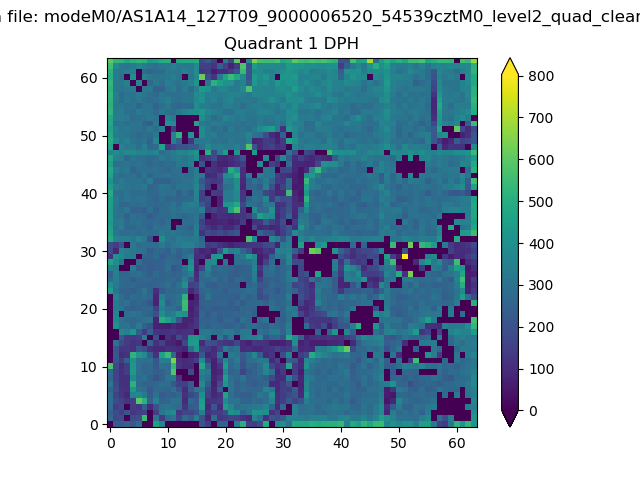 |
Quadrant B |
|---|---|---|---|
| Quadrant D | 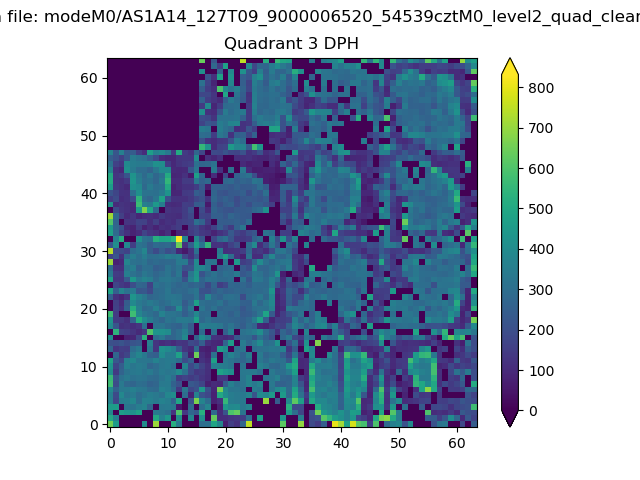 |
 |
Quadrant C |
| Plot type | Count rate plots | Images |
|---|---|---|
| Comparison with Poisson distribution Blue bars denote a histogram of data divided into 1 sec bins. Red curve is a Poisson curve with rate = median count rate of data. |
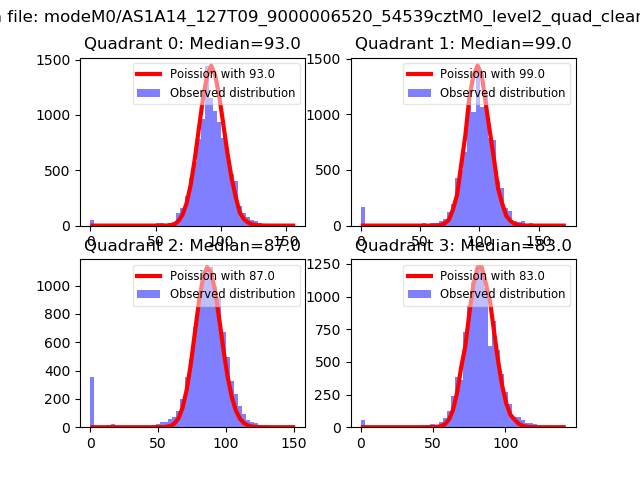 |
 |
| Quadrant-wise count rates Data is divided into 100 sec bins |
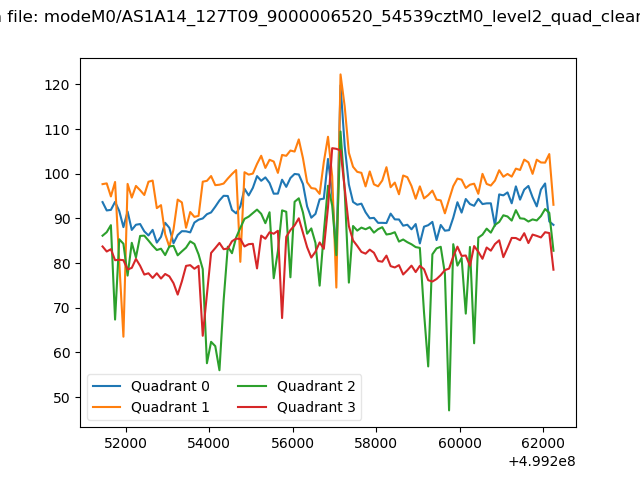 |
|
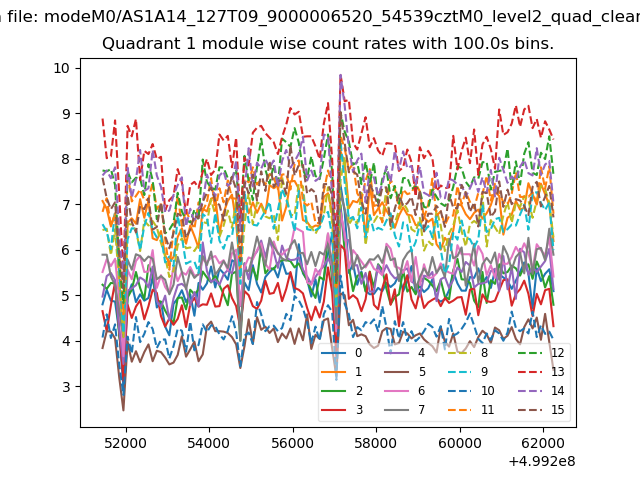
| Module-wise count rates for Quadrant A Data is divided into 100 sec bins |
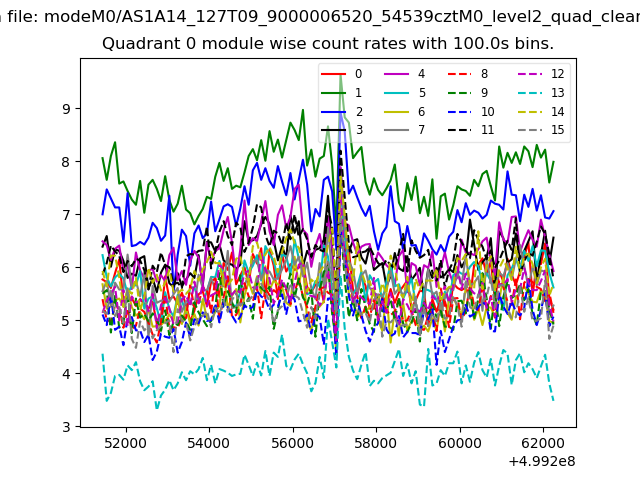 |
 |
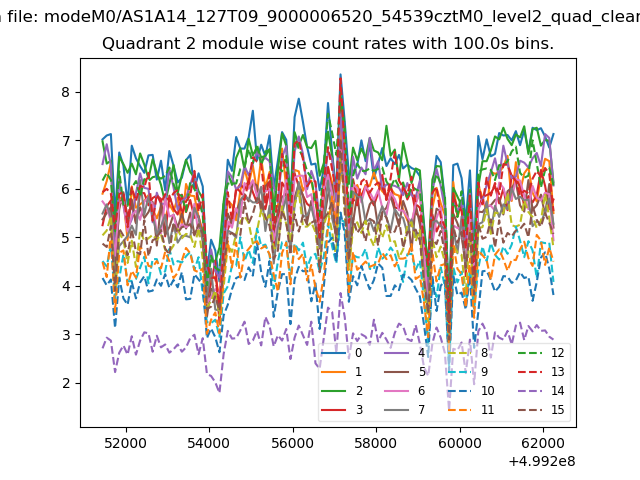
| Module-wise count rates for Quadrant B Data is divided into 100 sec bins |
 |
 |
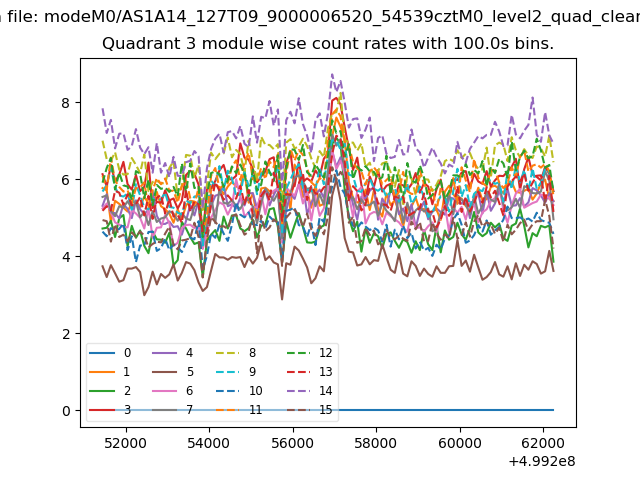
| Module-wise count rates for Quadrant C Data is divided into 100 sec bins |
 |
 |
| Module-wise count rates for Quadrant D Data is divided into 100 sec bins |
 |
 |
| Parameter | Plot |
|---|---|
| CZT HV Monitor |  |
| D_VDD | 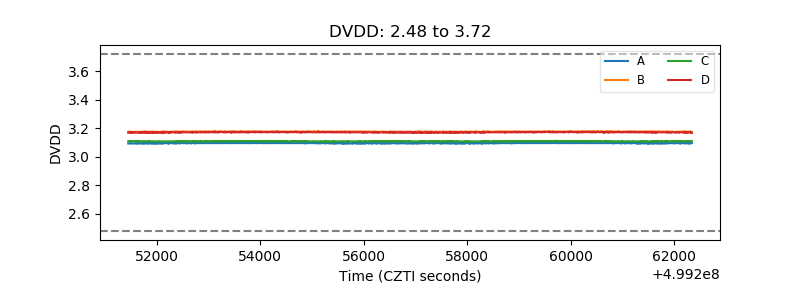 |
| Temperature 1 | 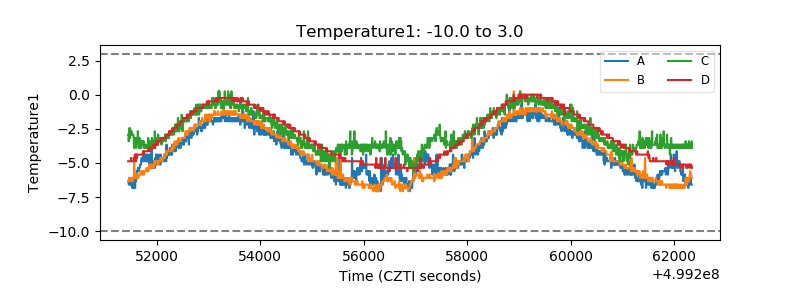 |
| Veto HV Monitor | 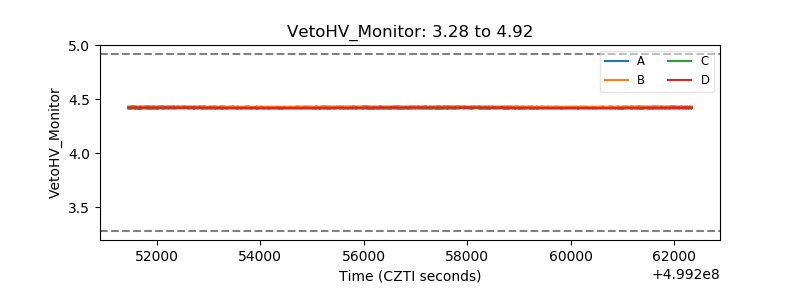 |
| Veto LLD | 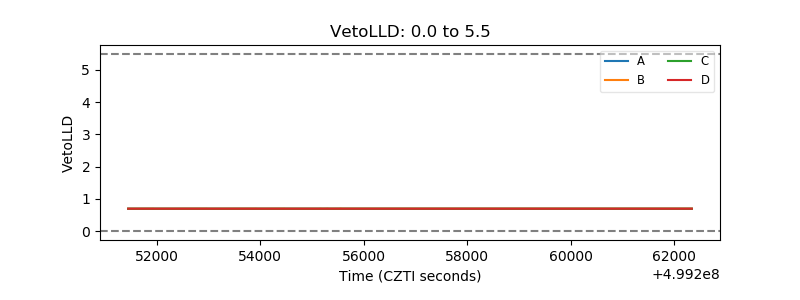 |
| Alpha Counter | 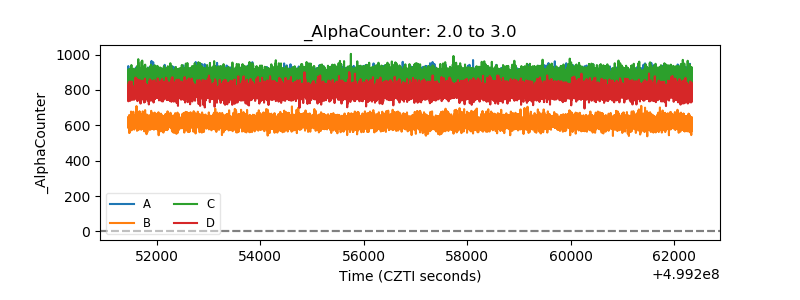 |
| _CPM_Rate | 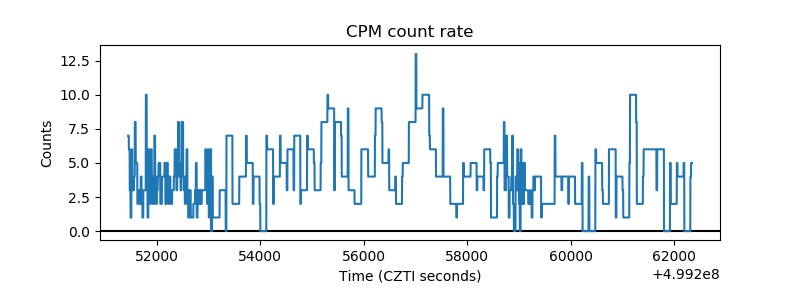 |
| CZT Counter | 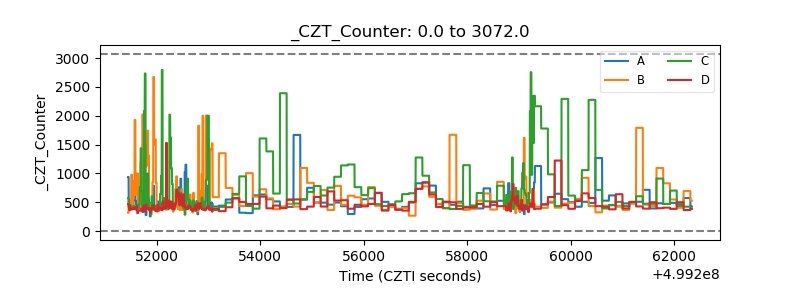 |
| +2.5 Volts monitor |  |
| +5 Volts monitor |  |
| _ROLL_ROT | 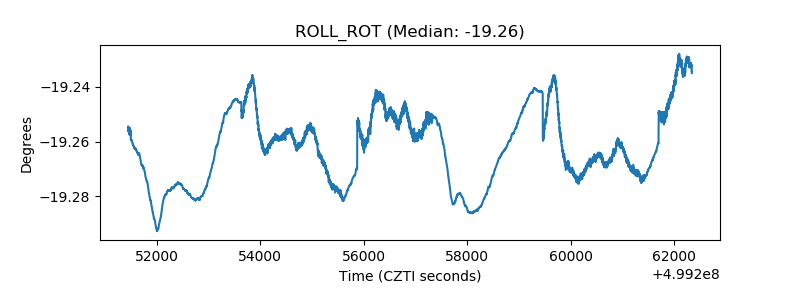 |
| _Roll_DEC | 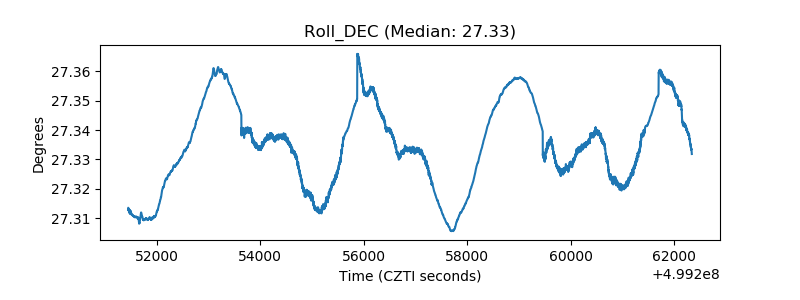 |
| _Roll_RA | 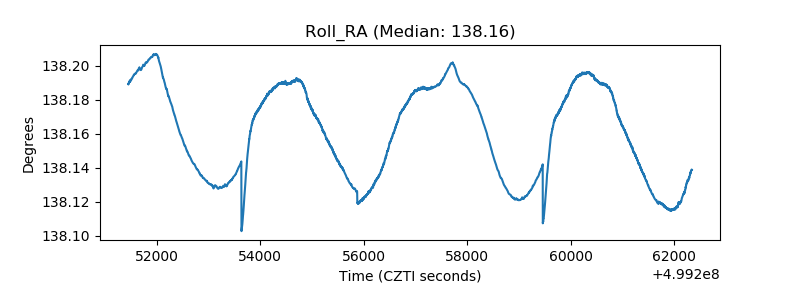 |
| Veto Counter | 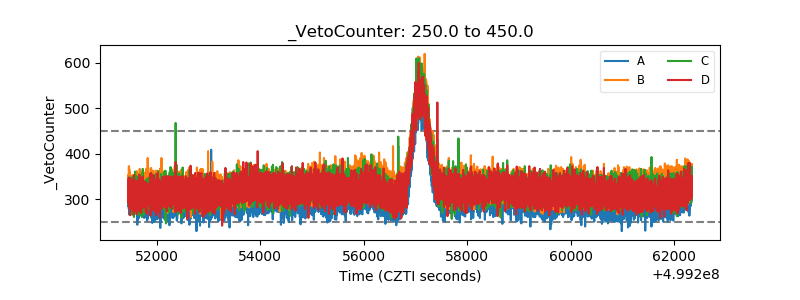 |