| Param | Original file | Final file |
|---|---|---|
| Filename | modeM0/AS1A14_127T09_9000006520_54540cztM0_level2.fits | modeM0/AS1A14_127T09_9000006520_54540cztM0_level2_quad_clean.evt |
| Size (bytes) | 924,373,440 | 190,558,080 |
| Size | 881.6 MB | 181.7 MB |
| Events in quadrant A | 8,138,509 | 1,248,063 |
| Events in quadrant B | 7,708,664 | 1,319,669 |
| Events in quadrant C | 8,690,886 | 1,162,589 |
| Events in quadrant D | 8,630,242 | 1,103,069 |
| Mode M0 | |||
|---|---|---|---|
| Quadrant | BADHDUFLAG | Total packets | Discarded packets |
| A | 0 | 32675 | 2 |
| B | 0 | 32376 | 2 |
| C | 0 | 35283 | 3 |
| D | 0 | 35245 | 2 |
| Mode SS | |||
|---|---|---|---|
| Quadrant | BADHDUFLAG | Total packets | Discarded packets |
| A | 0 | 278 | 0 |
| B | 0 | 278 | 0 |
| C | 0 | 278 | 0 |
| D | 0 | 278 | 0 |
| Mode M9 | |||
|---|---|---|---|
| Quadrant | BADHDUFLAG | Total packets | Discarded packets |
| A | 0 | 17 | 0 |
| B | 0 | 17 | 0 |
| C | 0 | 17 | 0 |
| D | 0 | 17 | 0 |
| Quadrant | Total seconds | Saturated seconds | Saturation percentage |
|---|---|---|---|
| A | 13545 | 435 | 3.211517% |
| B | 13546 | 508 | 3.750185% |
| C | 13545 | 632 | 4.665928% |
| D | 13545 | 526 | 3.883352% |
Noise dominated data is calculated using 1-second bins in cleaned event files. If a bin has >2000 counts, and if more than 50% of those come from <1% of pixels, then it is considered to be noise-dominated and hence unusable.
| Quadrant | # 1 sec bins | Bins with >0 counts | Bins with >2000 counts | High rate bins dominated by noise | Noise dominated (total time) | Noise dominated (detector-on time) | Marked lightcurve |
|---|---|---|---|---|---|---|---|
| A | 15290 | 13545 | 156 | 156 | 1.02% | 1.15% | 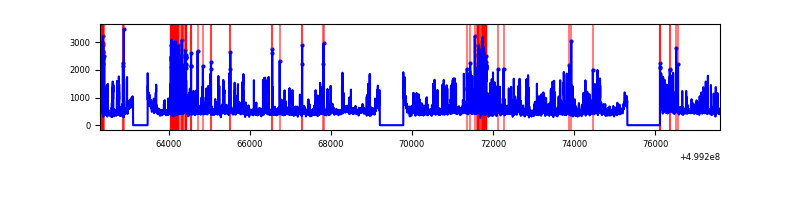 |
| B | 15291 | 13546 | 184 | 184 | 1.20% | 1.36% | 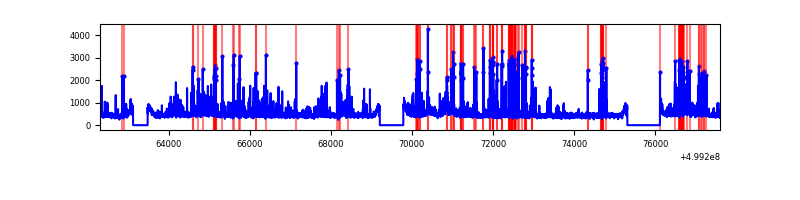 |
| C | 15290 | 13545 | 409 | 409 | 2.67% | 3.02% | 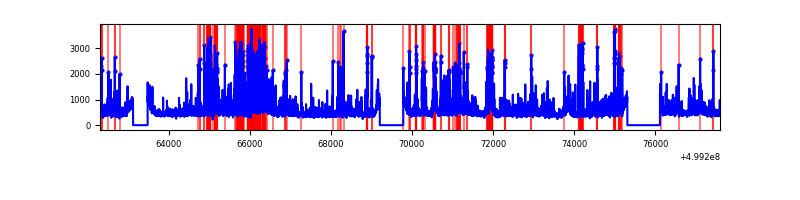 |
| D | 15290 | 13545 | 309 | 309 | 2.02% | 2.28% | 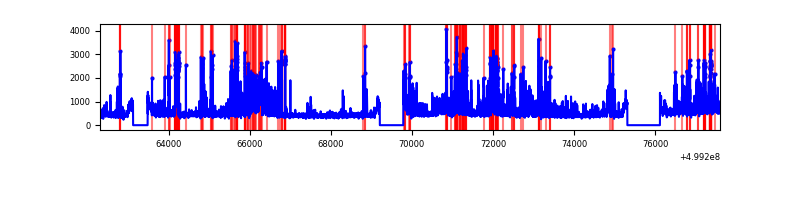 |
Top three noisy pixels from each quadrant. If the there are fewer than three noisy pixels in the level2.evt file, extra rows are filled as -1
| Pixel properties | Quadrant properties | ||||||
|---|---|---|---|---|---|---|---|
| Quadrant | DetID | PixID | Counts | Sigma | Mean | Median | Sigma |
| A | 11 | 3 | 900425 | 2445.2 | 1500 | 1458 | 367.6 |
| A | 3 | 14 | 598668 | 1624.42 | 1500 | 1458 | 367.6 |
| A | 4 | 249 | 314346 | 851.06 | 1500 | 1458 | 367.6 |
| B | 1 | 207 | 327689 | 1029.94 | 1475 | 1421 | 316.8 |
| B | 10 | 245 | 217623 | 682.49 | 1475 | 1421 | 316.8 |
| B | 0 | 216 | 212065 | 664.95 | 1475 | 1421 | 316.8 |
| C | 12 | 252 | 1526753 | 3846.6 | 1451 | 1436 | 396.5 |
| C | 13 | 3 | 465507 | 1170.31 | 1451 | 1436 | 396.5 |
| C | 15 | 209 | 296843 | 744.97 | 1451 | 1436 | 396.5 |
| D | 1 | 3 | 668579 | 1622.17 | 1455 | 1391 | 411.3 |
| D | 2 | 172 | 513030 | 1243.98 | 1455 | 1391 | 411.3 |
| D | 3 | 12 | 488415 | 1184.13 | 1455 | 1391 | 411.3 |
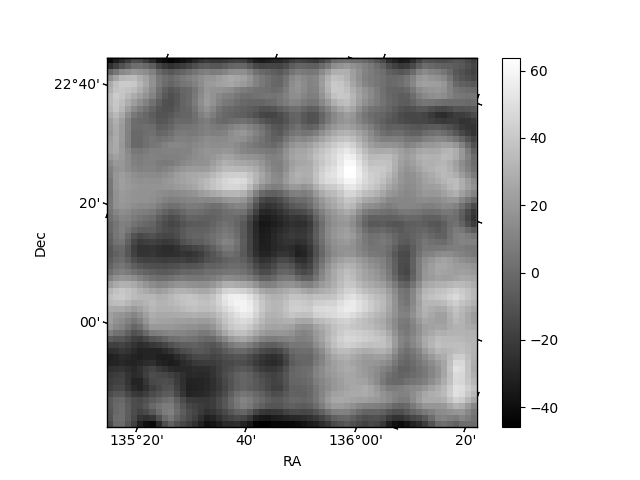
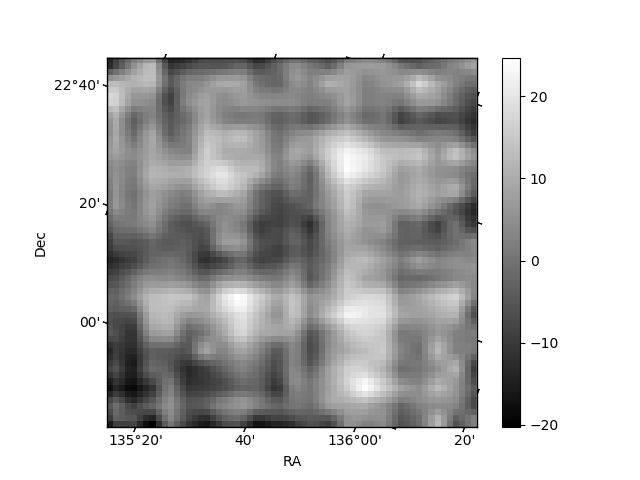
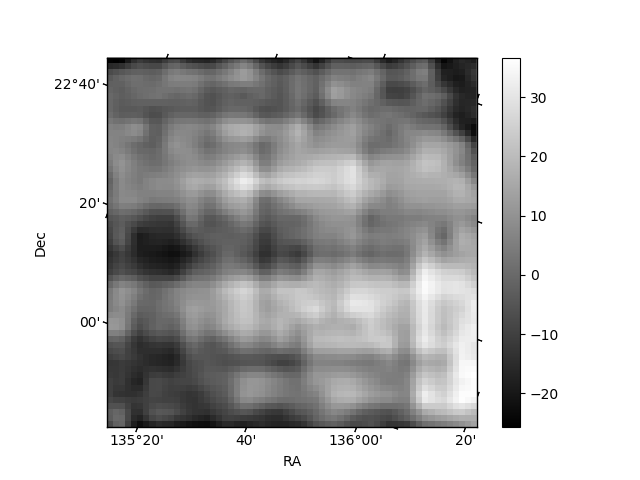
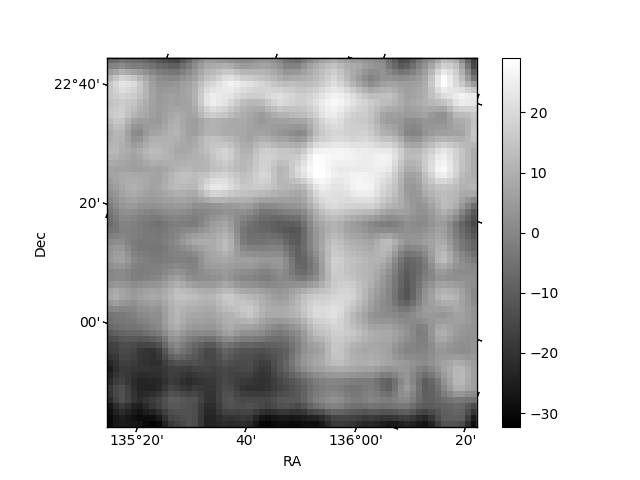
Histogram calculated using DETX and DETY for each event in the final _common_clean file
| Quadrant A | 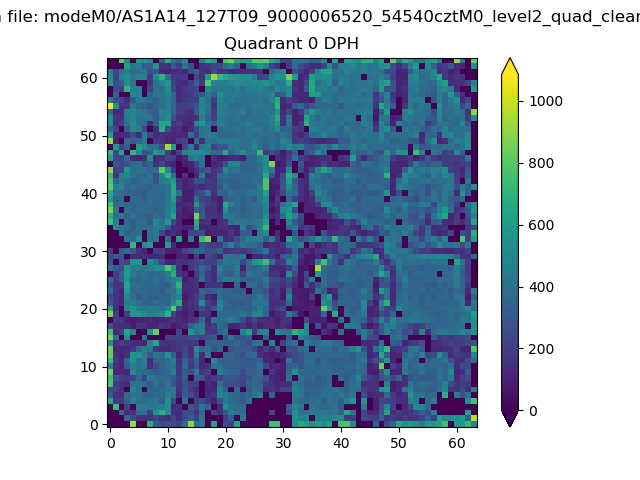 |
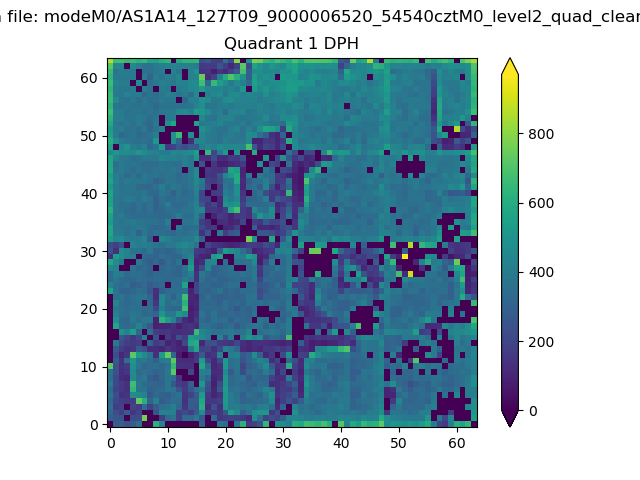 |
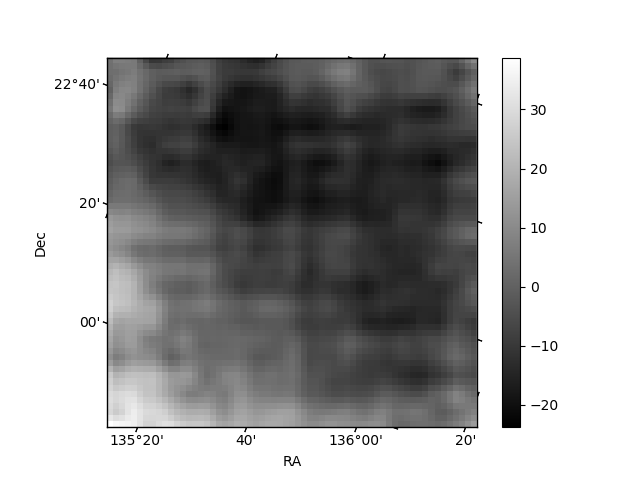
Quadrant B |
|---|---|---|---|
| Quadrant D | 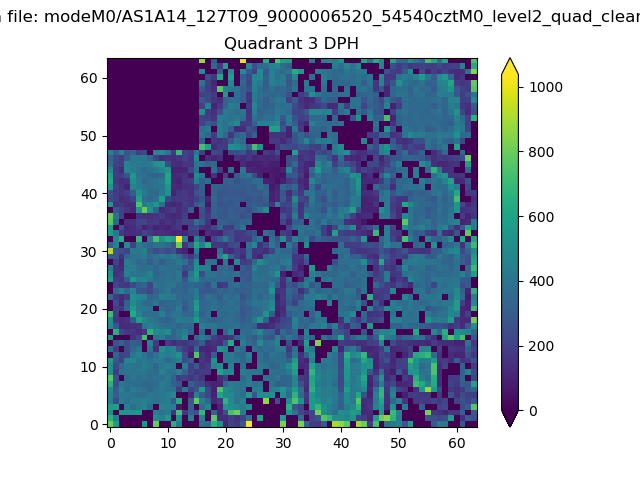 |
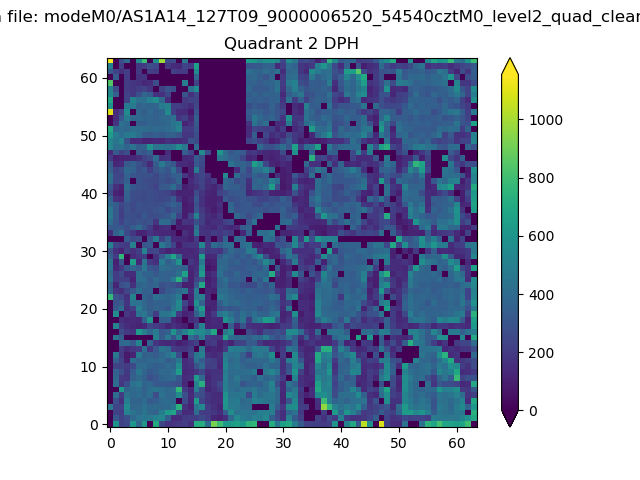 |
Quadrant C |
| Plot type | Count rate plots | Images |
|---|---|---|
| Comparison with Poisson distribution Blue bars denote a histogram of data divided into 1 sec bins. Red curve is a Poisson curve with rate = median count rate of data. |
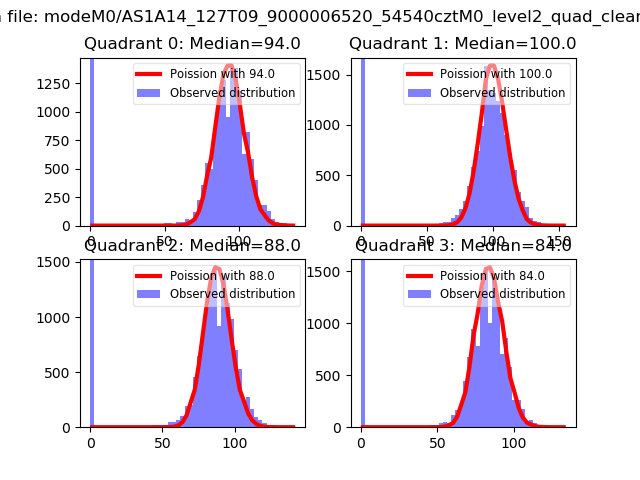 |
 |
| Quadrant-wise count rates Data is divided into 100 sec bins |
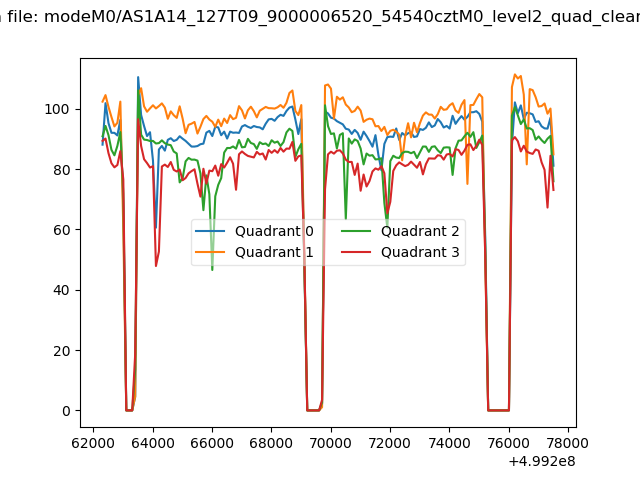 |
|
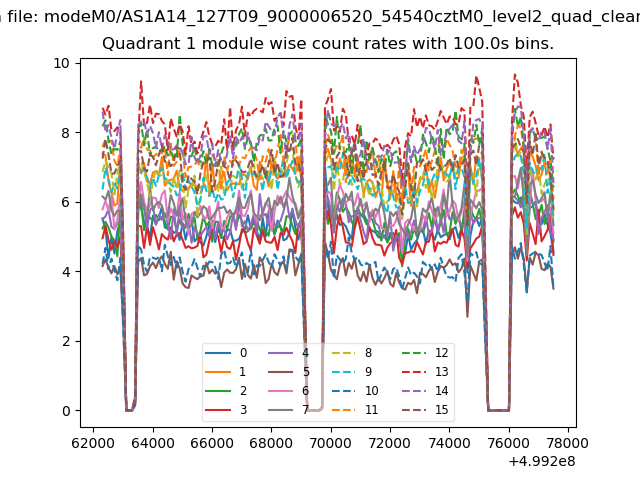
| Module-wise count rates for Quadrant A Data is divided into 100 sec bins |
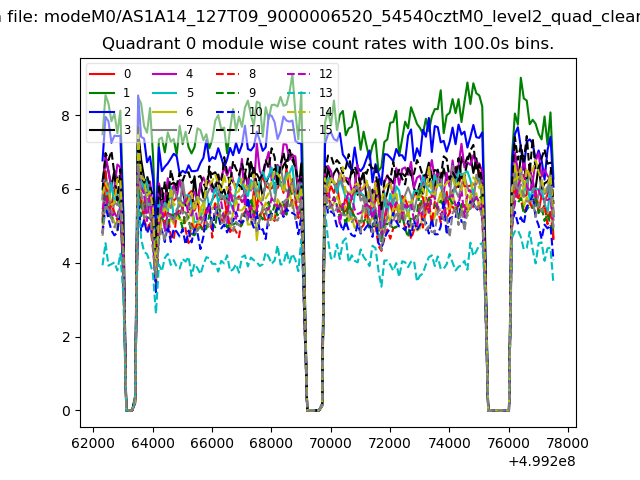 |
 |
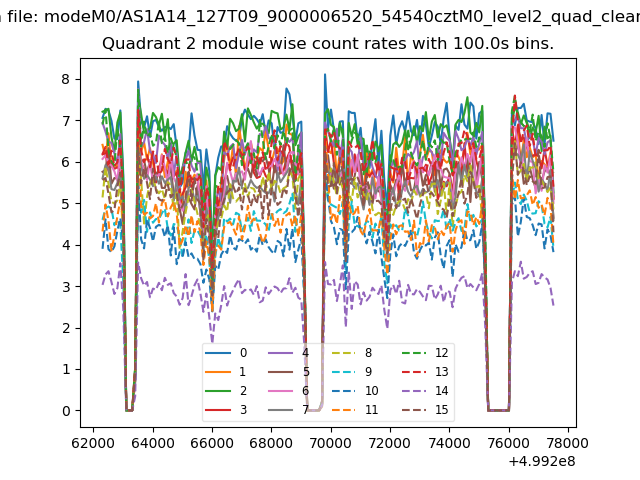
| Module-wise count rates for Quadrant B Data is divided into 100 sec bins |
 |
 |
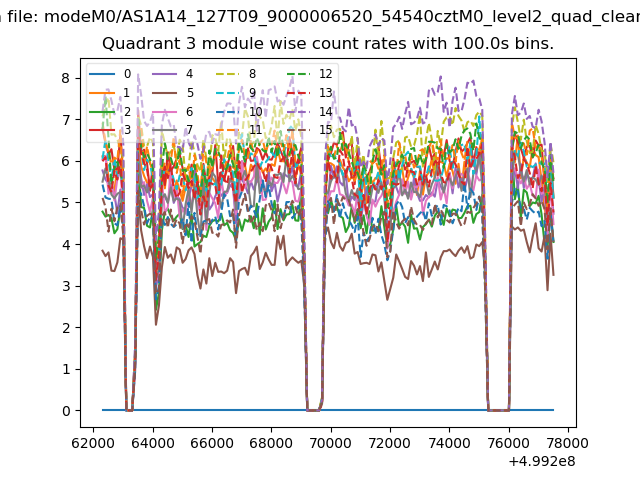
| Module-wise count rates for Quadrant C Data is divided into 100 sec bins |
 |
 |
| Module-wise count rates for Quadrant D Data is divided into 100 sec bins |
 |
 |
| Parameter | Plot |
|---|---|
| CZT HV Monitor | 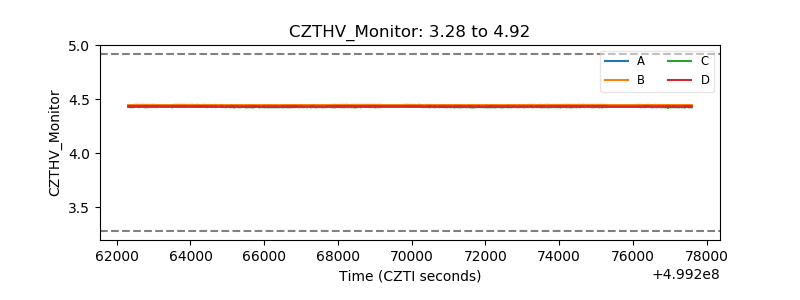 |
| D_VDD | 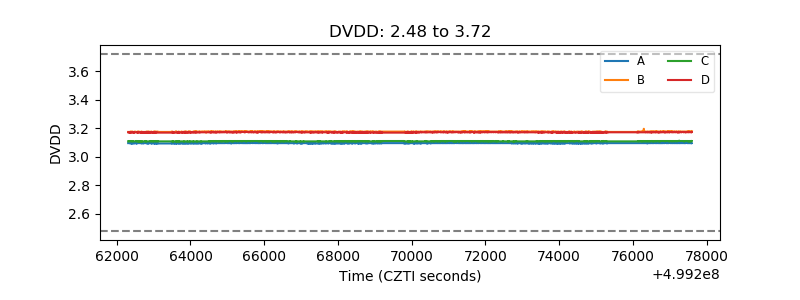 |
| Temperature 1 | 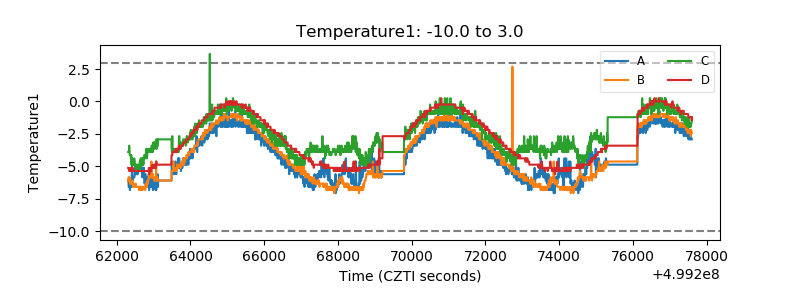 |
| Veto HV Monitor | 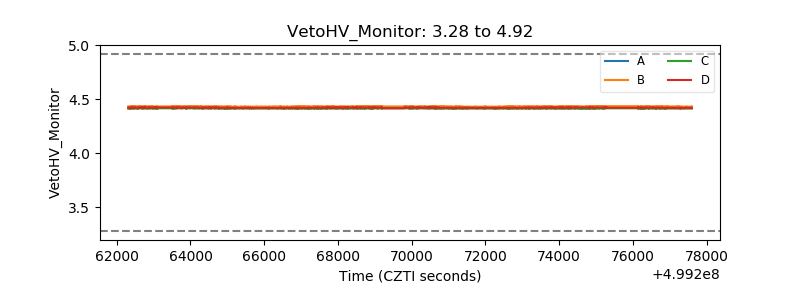 |
| Veto LLD | 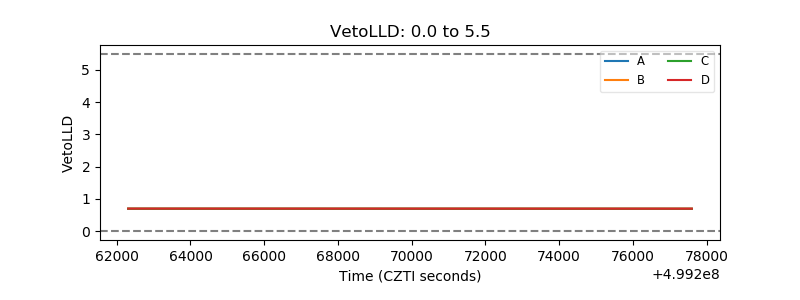 |
| Alpha Counter | 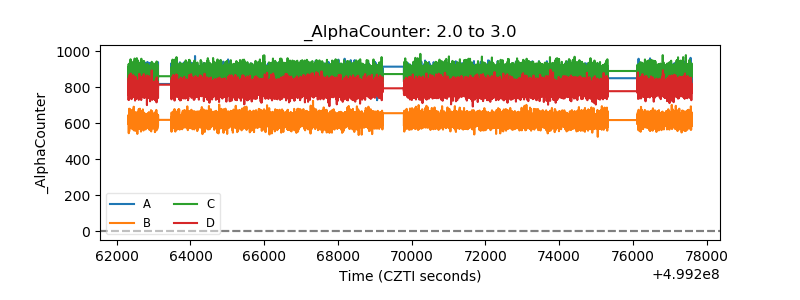 |
| _CPM_Rate | 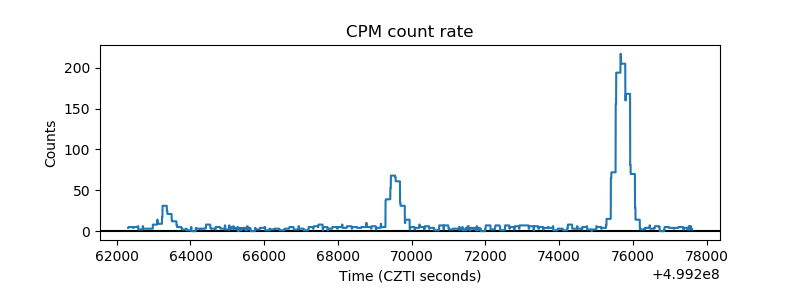 |
| CZT Counter | 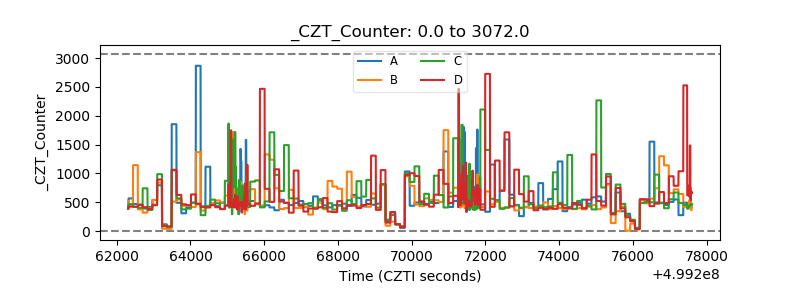 |
| +2.5 Volts monitor |  |
| +5 Volts monitor |  |
| _ROLL_ROT | 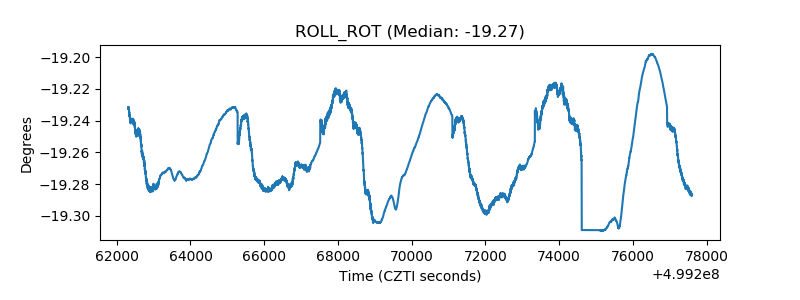 |
| _Roll_DEC | 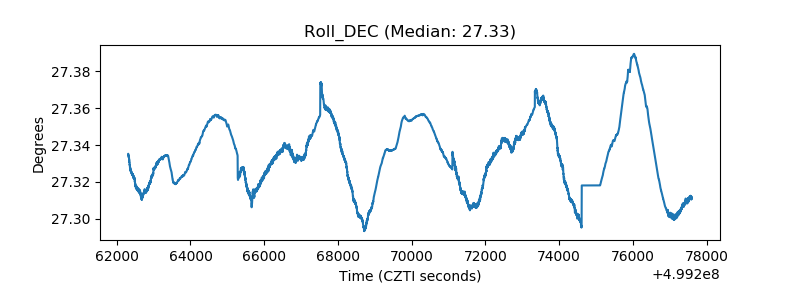 |
| _Roll_RA | 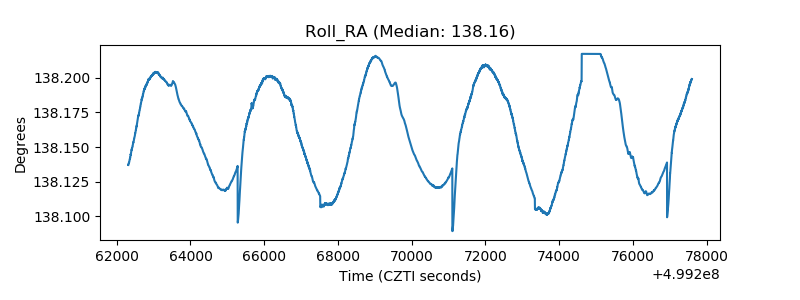 |
| Veto Counter | 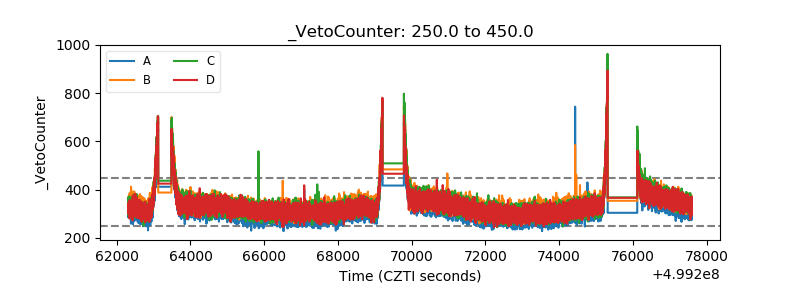 |