| Param | Original file | Final file |
|---|---|---|
| Filename | modeM0/AS1A14_127T09_9000006520_54543cztM0_level2.fits | modeM0/AS1A14_127T09_9000006520_54543cztM0_level2_quad_clean.evt |
| Size (bytes) | 448,660,800 | 93,965,760 |
| Size | 427.9 MB | 89.6 MB |
| Events in quadrant A | 3,297,842 | 630,863 |
| Events in quadrant B | 3,294,364 | 672,926 |
| Events in quadrant C | 5,242,598 | 554,850 |
| Events in quadrant D | 4,277,918 | 542,396 |
| Mode M0 | |||
|---|---|---|---|
| Quadrant | BADHDUFLAG | Total packets | Discarded packets |
| A | 0 | 14188 | 1 |
| B | 0 | 14180 | 1 |
| C | 0 | 19976 | 1 |
| D | 0 | 17374 | 1 |
| Mode SS | |||
|---|---|---|---|
| Quadrant | BADHDUFLAG | Total packets | Discarded packets |
| A | 0 | 128 | 0 |
| B | 0 | 128 | 0 |
| C | 0 | 128 | 0 |
| D | 0 | 128 | 0 |
| Mode M9 | |||
|---|---|---|---|
| Quadrant | BADHDUFLAG | Total packets | Discarded packets |
| A | 0 | 11 | 0 |
| B | 0 | 11 | 0 |
| C | 0 | 11 | 0 |
| D | 0 | 11 | 0 |
| Quadrant | Total seconds | Saturated seconds | Saturation percentage |
|---|---|---|---|
| A | 6370 | 77 | 1.208791% |
| B | 6370 | 87 | 1.365777% |
| C | 6370 | 599 | 9.403454% |
| D | 6370 | 383 | 6.012559% |
Noise dominated data is calculated using 1-second bins in cleaned event files. If a bin has >2000 counts, and if more than 50% of those come from <1% of pixels, then it is considered to be noise-dominated and hence unusable.
| Quadrant | # 1 sec bins | Bins with >0 counts | Bins with >2000 counts | High rate bins dominated by noise | Noise dominated (total time) | Noise dominated (detector-on time) | Marked lightcurve |
|---|---|---|---|---|---|---|---|
| A | 7445 | 6371 | 30 | 30 | 0.40% | 0.47% | 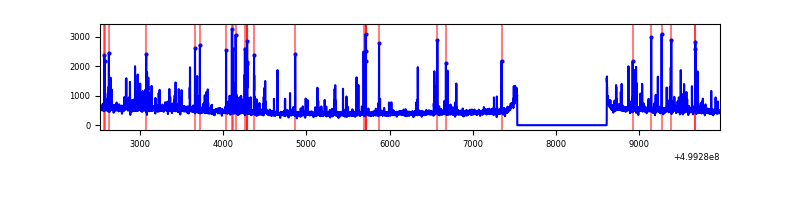 |
| B | 7445 | 6370 | 23 | 23 | 0.31% | 0.36% | 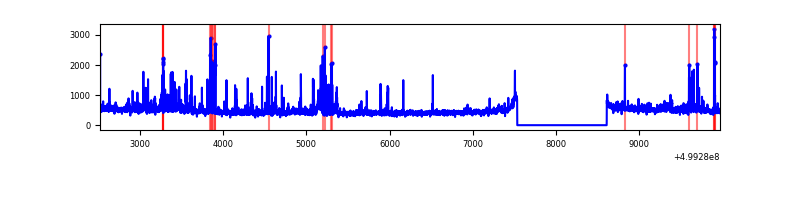 |
| C | 7445 | 6371 | 479 | 479 | 6.43% | 7.52% | 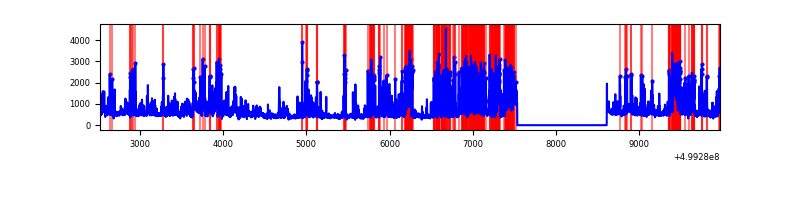 |
| D | 7445 | 6371 | 311 | 311 | 4.18% | 4.88% | 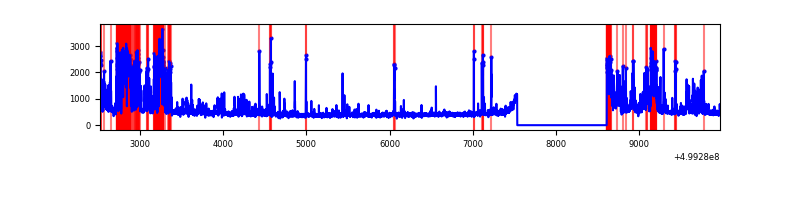 |
Top three noisy pixels from each quadrant. If the there are fewer than three noisy pixels in the level2.evt file, extra rows are filled as -1
| Pixel properties | Quadrant properties | ||||||
|---|---|---|---|---|---|---|---|
| Quadrant | DetID | PixID | Counts | Sigma | Mean | Median | Sigma |
| A | 11 | 3 | 178398 | 1000.91 | 714 | 698 | 177.5 |
| A | 3 | 14 | 151818 | 851.19 | 714 | 698 | 177.5 |
| A | 4 | 249 | 73890 | 412.26 | 714 | 698 | 177.5 |
| B | 5 | 172 | 132749 | 865.84 | 708 | 685 | 152.5 |
| B | 8 | 234 | 62500 | 405.27 | 708 | 685 | 152.5 |
| B | 0 | 213 | 55283 | 357.96 | 708 | 685 | 152.5 |
| C | 12 | 254 | 1184563 | 6485.19 | 666 | 659 | 182.6 |
| C | 12 | 252 | 499469 | 2732.38 | 666 | 659 | 182.6 |
| C | 13 | 3 | 321931 | 1759.86 | 666 | 659 | 182.6 |
| D | 1 | 3 | 1244976 | 6360.53 | 685 | 653 | 195.6 |
| D | 6 | 239 | 123501 | 627.95 | 685 | 653 | 195.6 |
| D | 3 | 12 | 64504 | 326.38 | 685 | 653 | 195.6 |
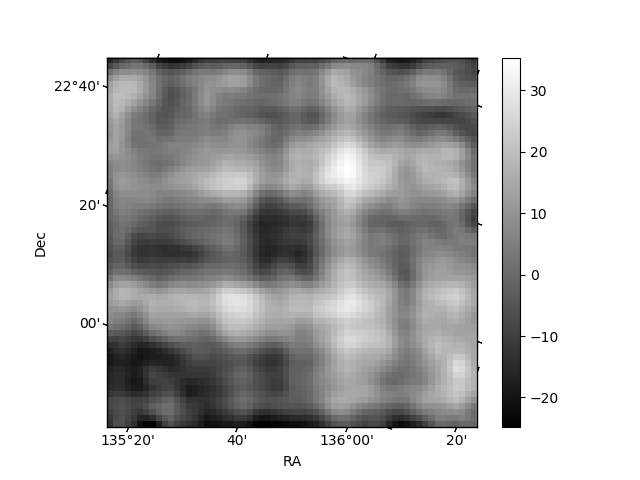
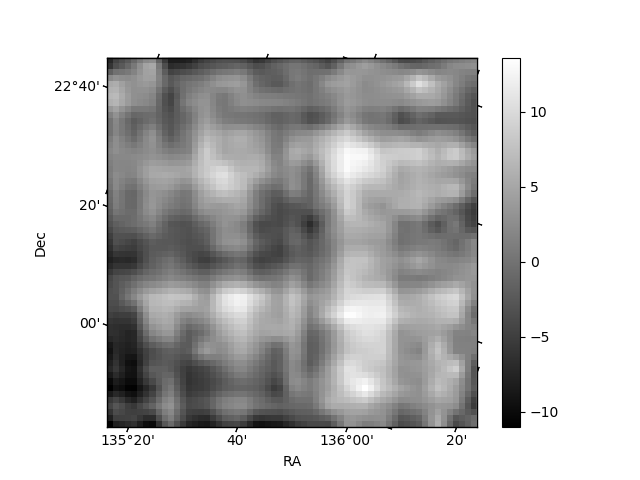
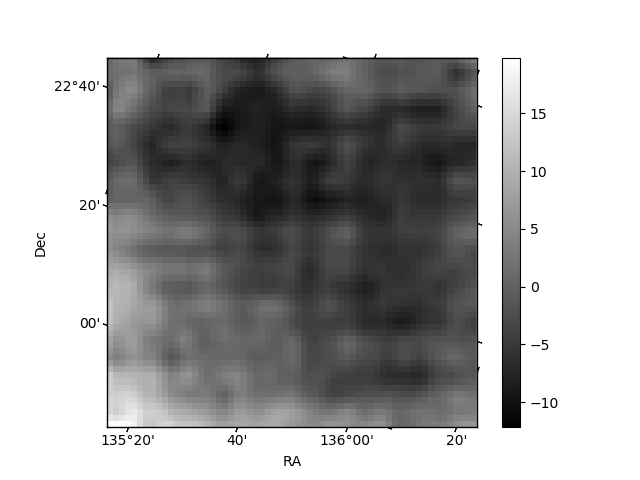
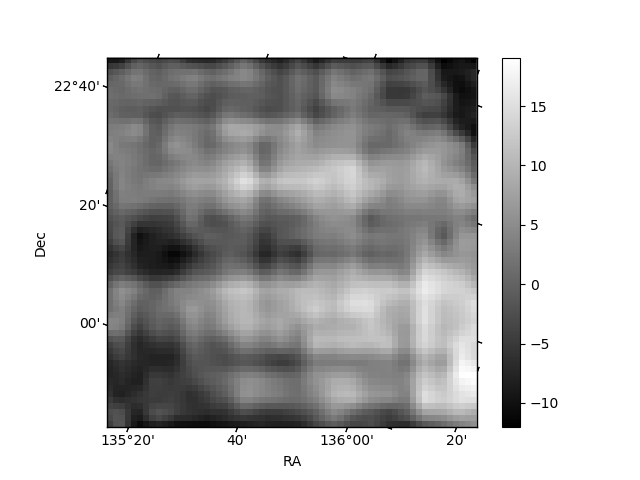
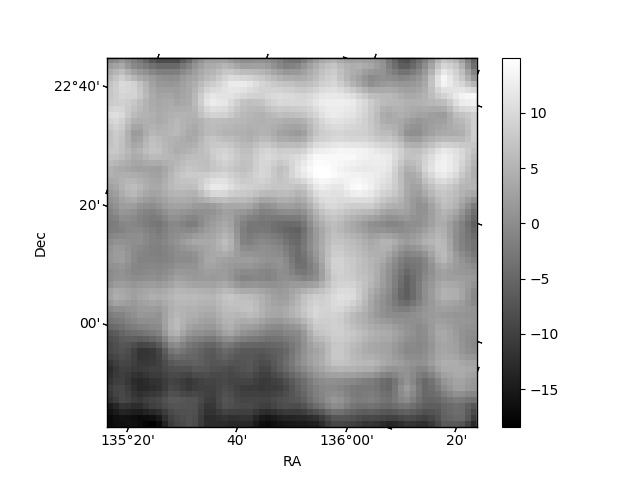
Histogram calculated using DETX and DETY for each event in the final _common_clean file
| Quadrant A | 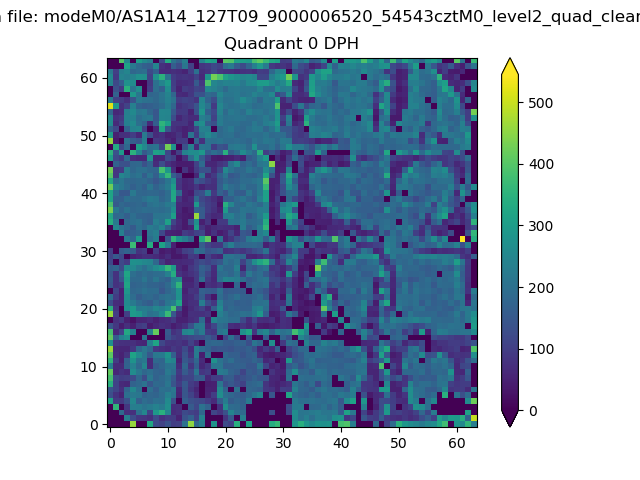 |
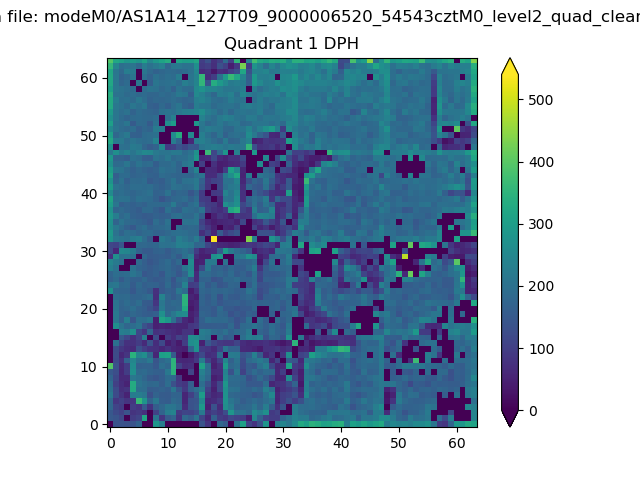 |
Quadrant B |
|---|---|---|---|
| Quadrant D | 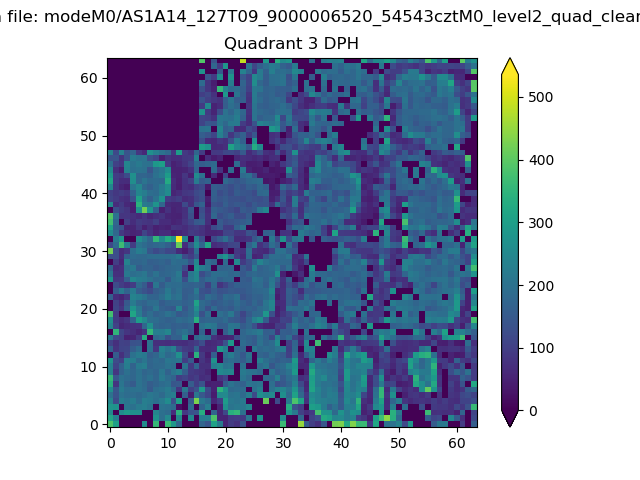 |
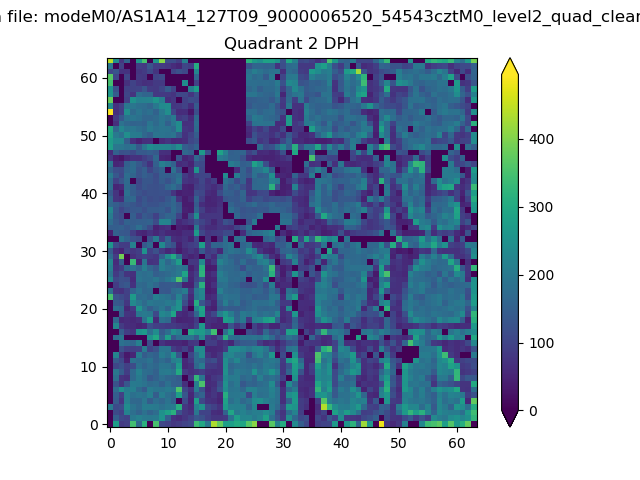 |
Quadrant C |
| Plot type | Count rate plots | Images |
|---|---|---|
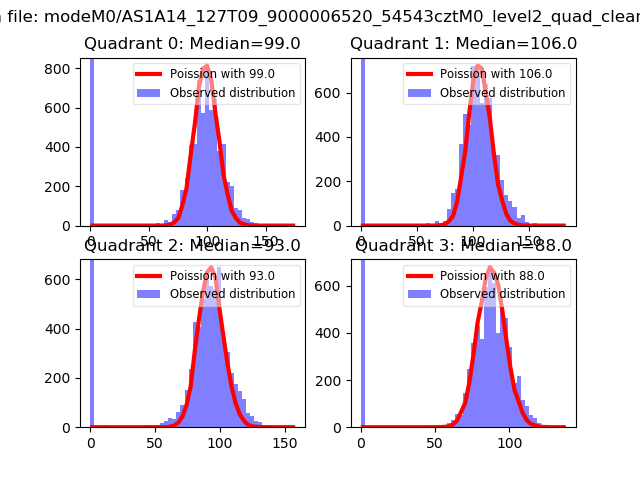
| Comparison with Poisson distribution Blue bars denote a histogram of data divided into 1 sec bins. Red curve is a Poisson curve with rate = median count rate of data. |
 |
 |
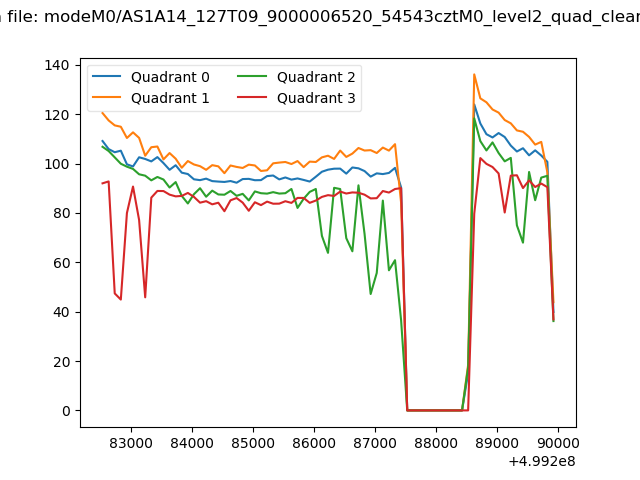
| Quadrant-wise count rates Data is divided into 100 sec bins |
 |
|
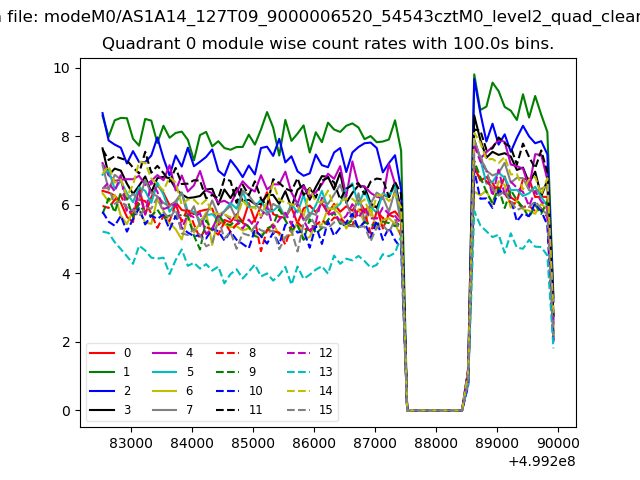
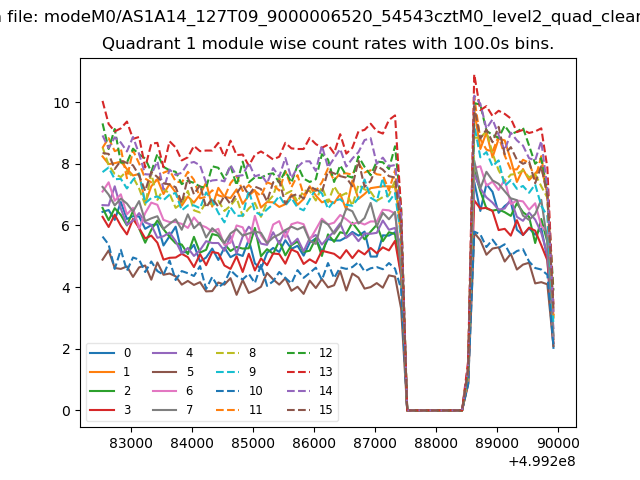
| Module-wise count rates for Quadrant A Data is divided into 100 sec bins |
 |
 |
| Module-wise count rates for Quadrant B Data is divided into 100 sec bins |
 |
 |
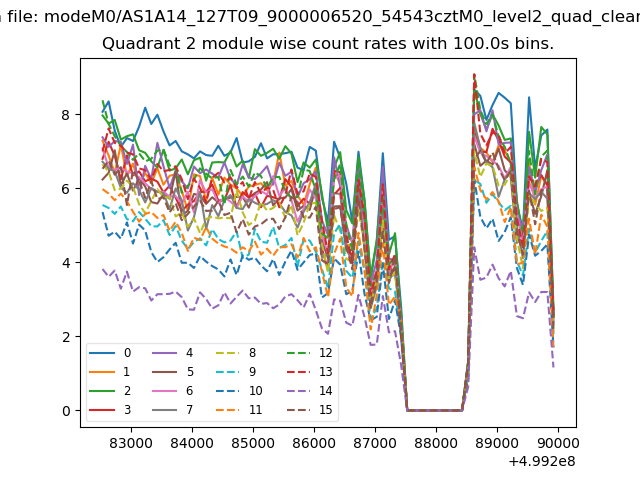
| Module-wise count rates for Quadrant C Data is divided into 100 sec bins |
 |
 |
| Module-wise count rates for Quadrant D Data is divided into 100 sec bins |
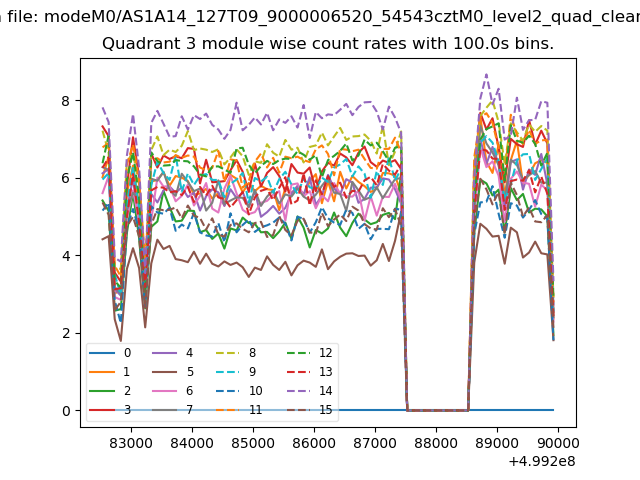 |
 |
| Parameter | Plot |
|---|---|
| CZT HV Monitor | 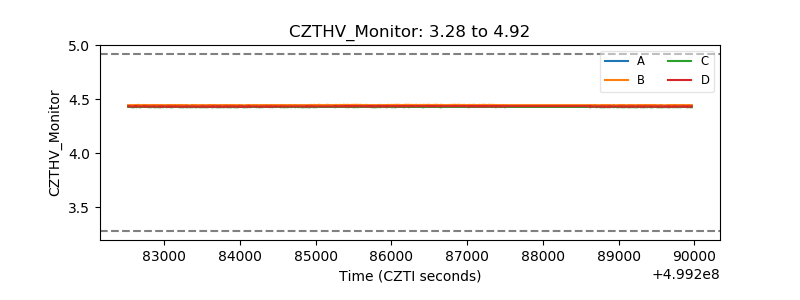 |
| D_VDD | 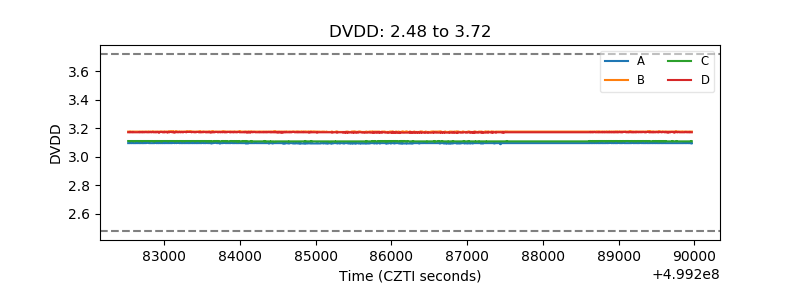 |
| Temperature 1 | 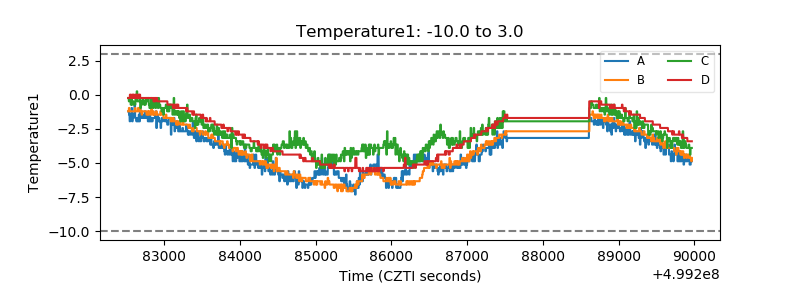 |
| Veto HV Monitor | 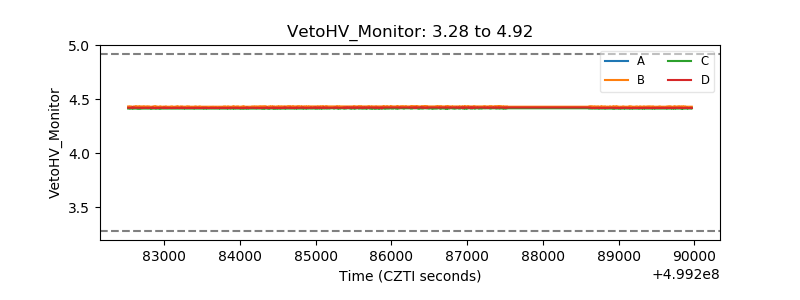 |
| Veto LLD | 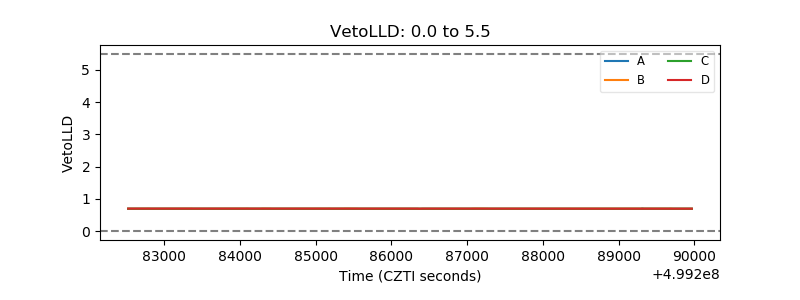 |
| Alpha Counter | 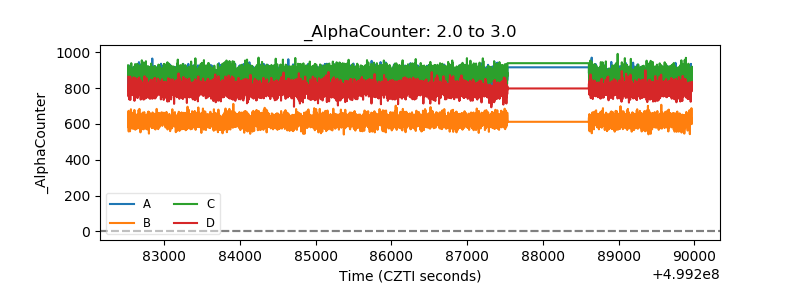 |
| _CPM_Rate | 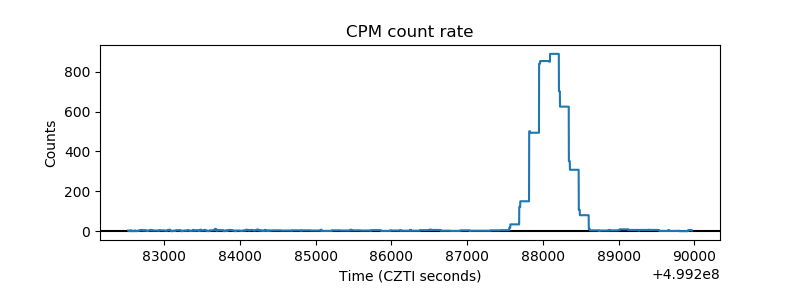 |
| CZT Counter | 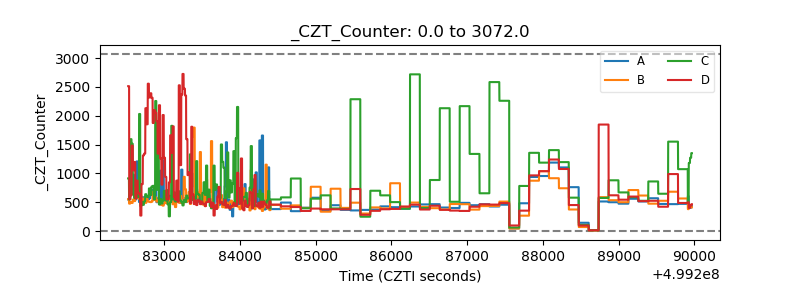 |
| +2.5 Volts monitor |  |
| +5 Volts monitor |  |
| _ROLL_ROT | 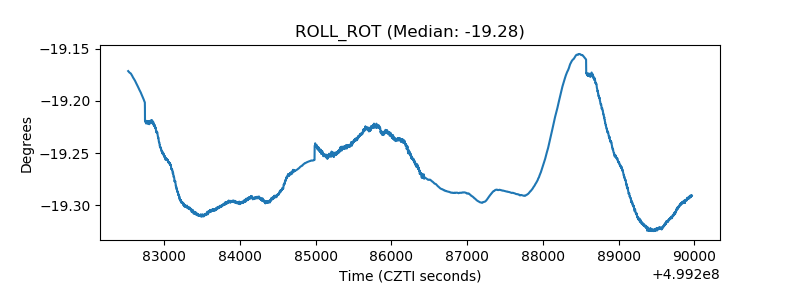 |
| _Roll_DEC | 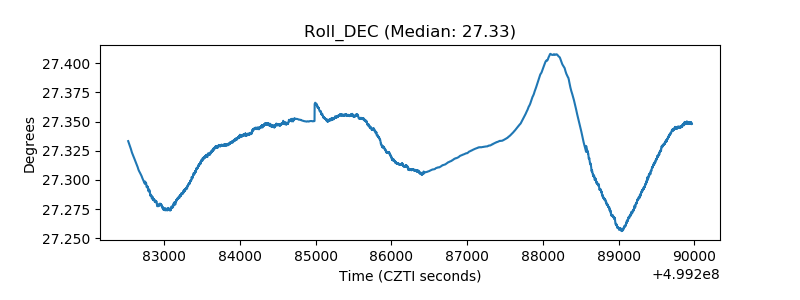 |
| _Roll_RA | 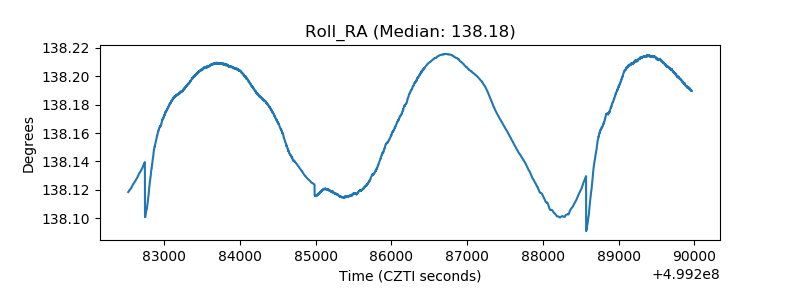 |
| Veto Counter | 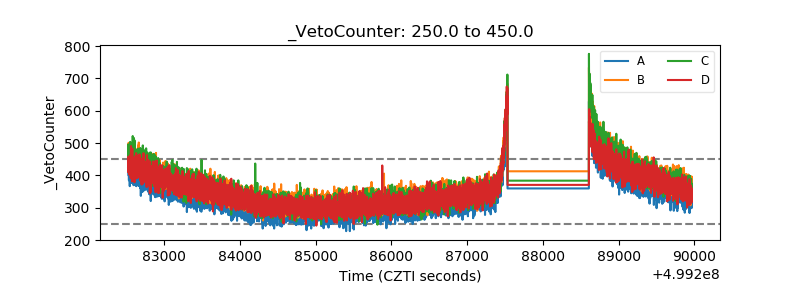 |