| Param | Original file | Final file |
|---|---|---|
| Filename | modeM0/AS1A14_127T09_9000006520_54544cztM0_level2.fits | modeM0/AS1A14_127T09_9000006520_54544cztM0_level2_quad_clean.evt |
| Size (bytes) | 429,600,960 | 98,930,880 |
| Size | 409.7 MB | 94.3 MB |
| Events in quadrant A | 3,242,545 | 661,945 |
| Events in quadrant B | 3,351,461 | 702,550 |
| Events in quadrant C | 4,735,246 | 594,073 |
| Events in quadrant D | 4,064,409 | 580,907 |
| Mode M0 | |||
|---|---|---|---|
| Quadrant | BADHDUFLAG | Total packets | Discarded packets |
| A | 0 | 14207 | 2 |
| B | 0 | 14557 | 2 |
| C | 0 | 18739 | 2 |
| D | 0 | 16781 | 2 |
| Mode SS | |||
|---|---|---|---|
| Quadrant | BADHDUFLAG | Total packets | Discarded packets |
| A | 0 | 134 | 0 |
| B | 0 | 134 | 0 |
| C | 0 | 134 | 0 |
| D | 0 | 134 | 0 |
| Mode M9 | |||
|---|---|---|---|
| Quadrant | BADHDUFLAG | Total packets | Discarded packets |
| A | 0 | 22 | 0 |
| B | 0 | 22 | 0 |
| C | 0 | 22 | 0 |
| D | 0 | 22 | 0 |
| Quadrant | Total seconds | Saturated seconds | Saturation percentage |
|---|---|---|---|
| A | 6541 | 110 | 1.681700% |
| B | 6541 | 141 | 2.155634% |
| C | 6542 | 486 | 7.428921% |
| D | 6542 | 264 | 4.035463% |
Noise dominated data is calculated using 1-second bins in cleaned event files. If a bin has >2000 counts, and if more than 50% of those come from <1% of pixels, then it is considered to be noise-dominated and hence unusable.
| Quadrant | # 1 sec bins | Bins with >0 counts | Bins with >2000 counts | High rate bins dominated by noise | Noise dominated (total time) | Noise dominated (detector-on time) | Marked lightcurve |
|---|---|---|---|---|---|---|---|
| A | 8766 | 6543 | 22 | 22 | 0.25% | 0.34% | 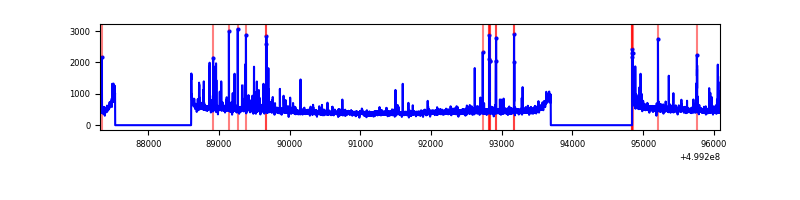 |
| B | 8766 | 6541 | 15 | 15 | 0.17% | 0.23% | 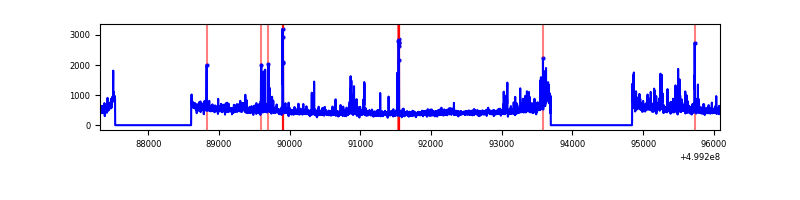 |
| C | 8767 | 6543 | 329 | 329 | 3.75% | 5.03% | 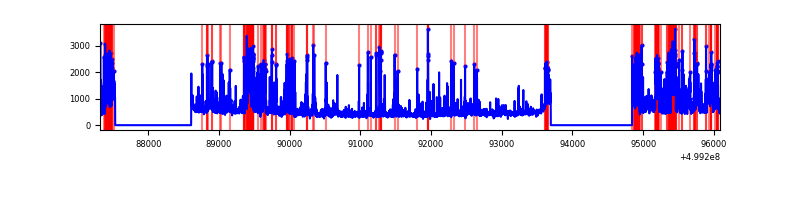 |
| D | 8767 | 6543 | 177 | 177 | 2.02% | 2.71% | 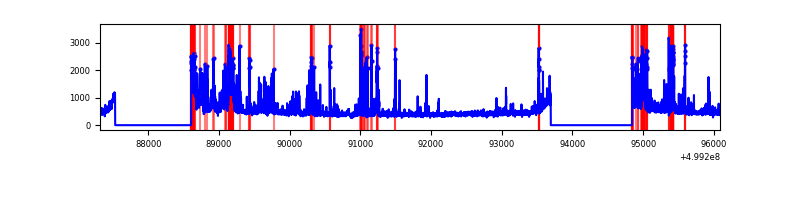 |
Top three noisy pixels from each quadrant. If the there are fewer than three noisy pixels in the level2.evt file, extra rows are filled as -1
| Pixel properties | Quadrant properties | ||||||
|---|---|---|---|---|---|---|---|
| Quadrant | DetID | PixID | Counts | Sigma | Mean | Median | Sigma |
| A | 11 | 3 | 134864 | 719.49 | 754 | 734 | 186.4 |
| A | 4 | 3 | 50443 | 266.65 | 754 | 734 | 186.4 |
| A | 7 | 93 | 44197 | 233.14 | 754 | 734 | 186.4 |
| B | 8 | 234 | 108415 | 665.07 | 746 | 720 | 161.9 |
| B | 10 | 247 | 51942 | 316.32 | 746 | 720 | 161.9 |
| B | 0 | 213 | 48694 | 296.27 | 746 | 720 | 161.9 |
| C | 12 | 254 | 607158 | 3105.46 | 713 | 707 | 195.3 |
| C | 4 | 5 | 363705 | 1858.81 | 713 | 707 | 195.3 |
| C | 13 | 3 | 302600 | 1545.9 | 713 | 707 | 195.3 |
| D | 1 | 3 | 572974 | 2768.9 | 727 | 696 | 206.7 |
| D | 6 | 239 | 369169 | 1782.81 | 727 | 696 | 206.7 |
| D | 4 | 160 | 73224 | 350.92 | 727 | 696 | 206.7 |
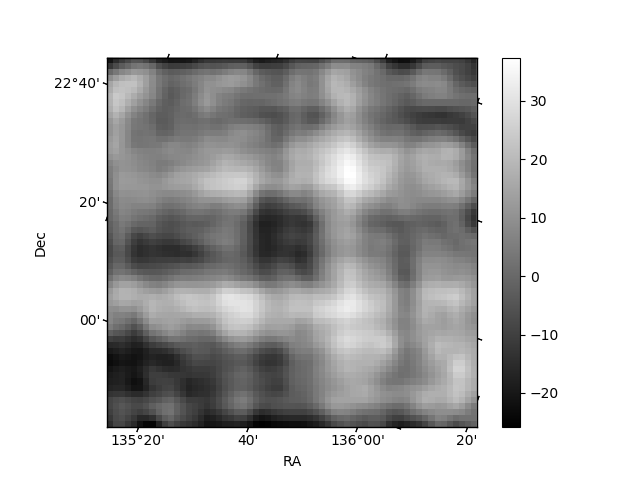
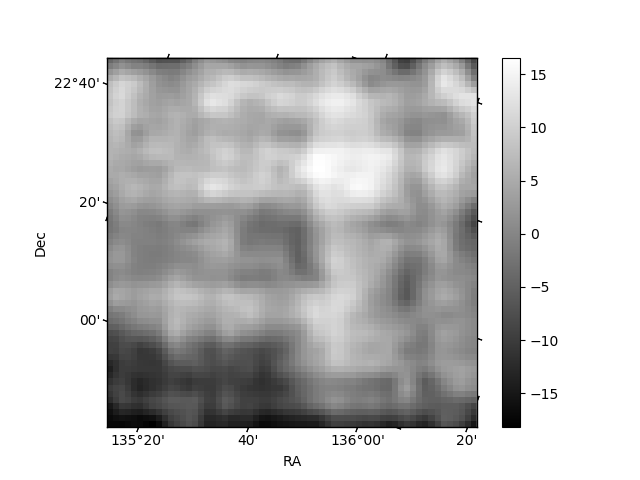
Histogram calculated using DETX and DETY for each event in the final _common_clean file
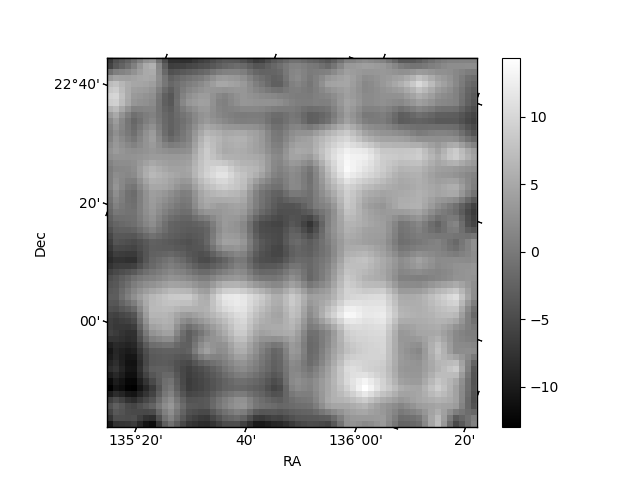
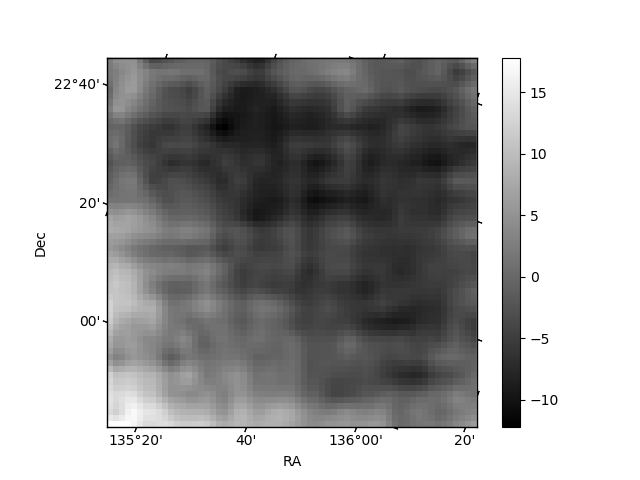
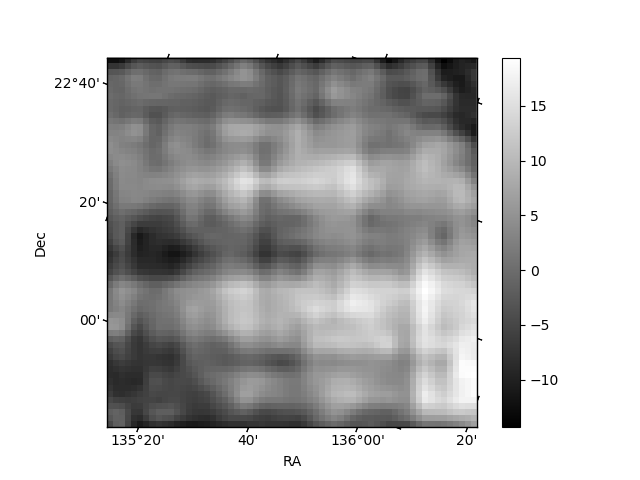
| Quadrant A | 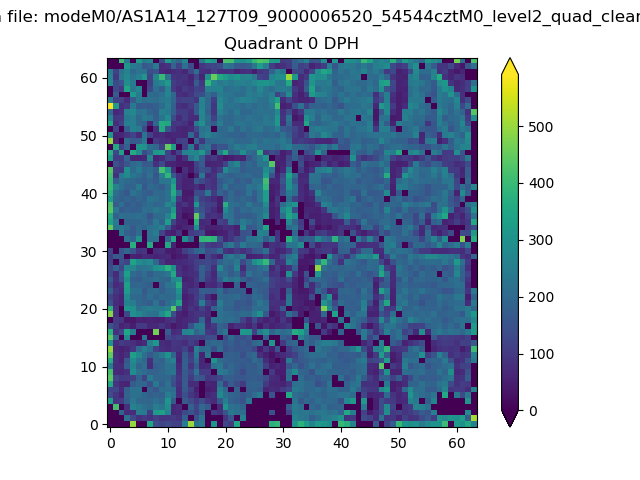 |
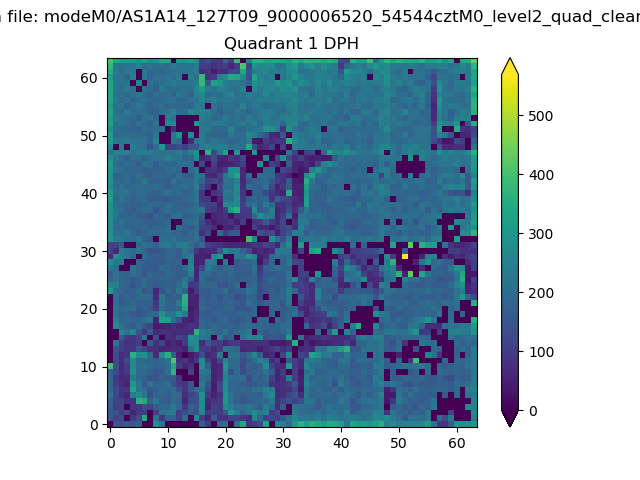 |
Quadrant B |
|---|---|---|---|
| Quadrant D | 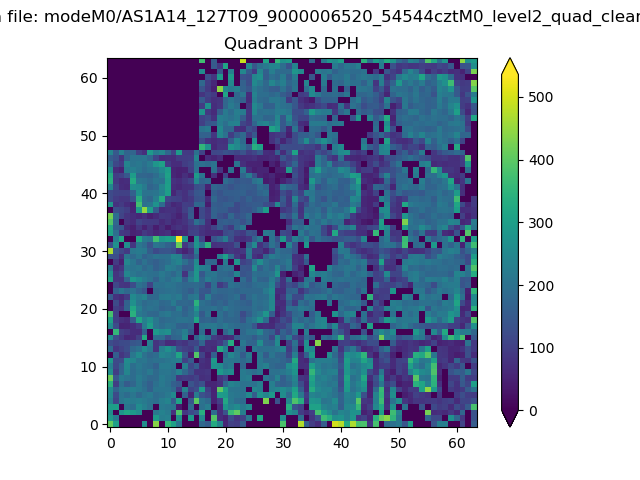 |
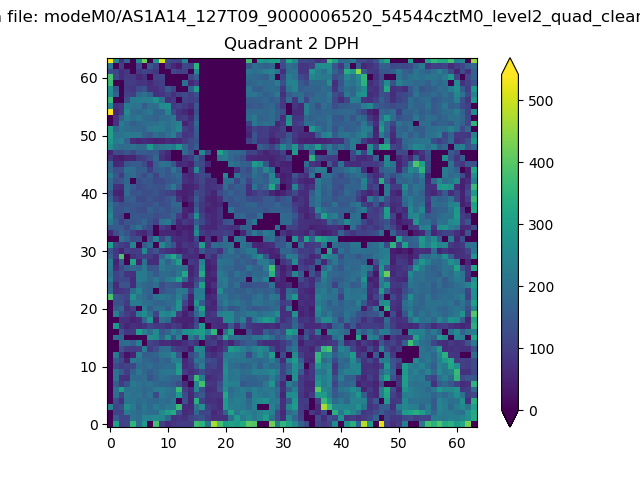 |
Quadrant C |
| Plot type | Count rate plots | Images |
|---|---|---|
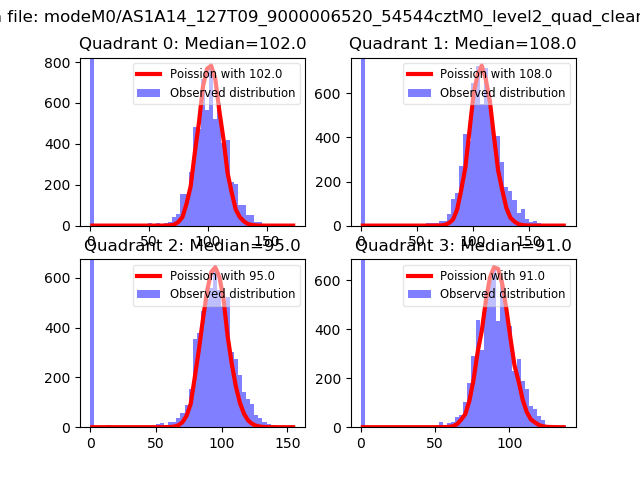
| Comparison with Poisson distribution Blue bars denote a histogram of data divided into 1 sec bins. Red curve is a Poisson curve with rate = median count rate of data. |
 |
 |
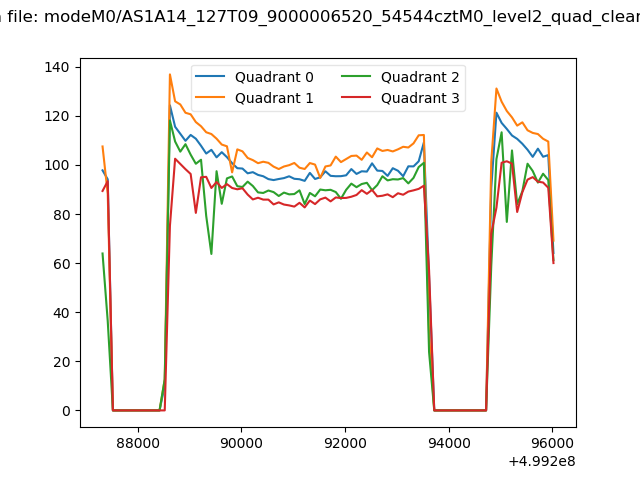
| Quadrant-wise count rates Data is divided into 100 sec bins |
 |
|
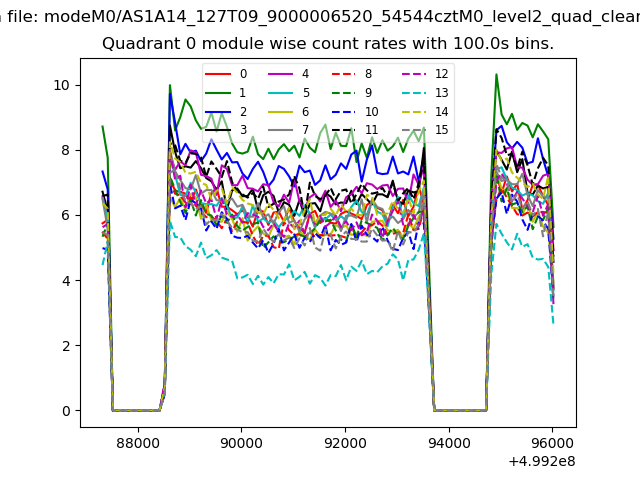
| Module-wise count rates for Quadrant A Data is divided into 100 sec bins |
 |
 |
| Module-wise count rates for Quadrant B Data is divided into 100 sec bins |
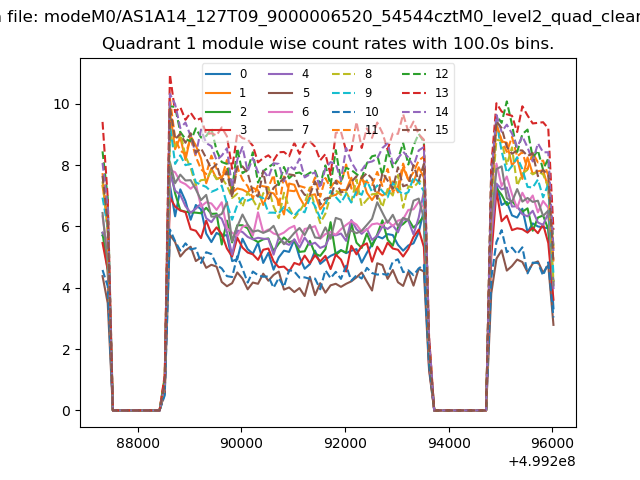 |
 |
| Module-wise count rates for Quadrant C Data is divided into 100 sec bins |
 |
 |
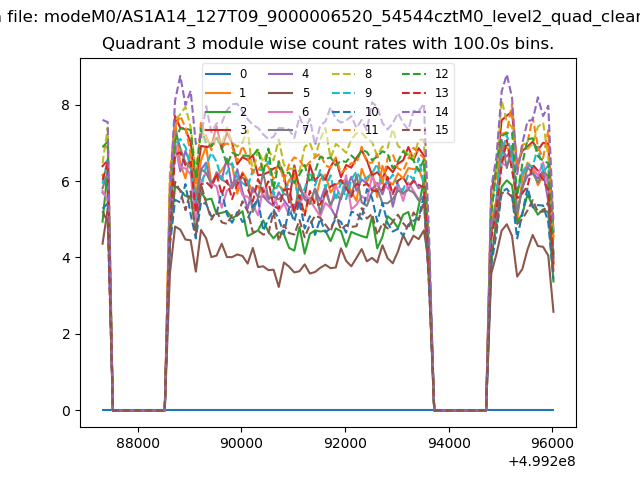
| Module-wise count rates for Quadrant D Data is divided into 100 sec bins |
 |
 |
| Parameter | Plot |
|---|---|
| CZT HV Monitor | 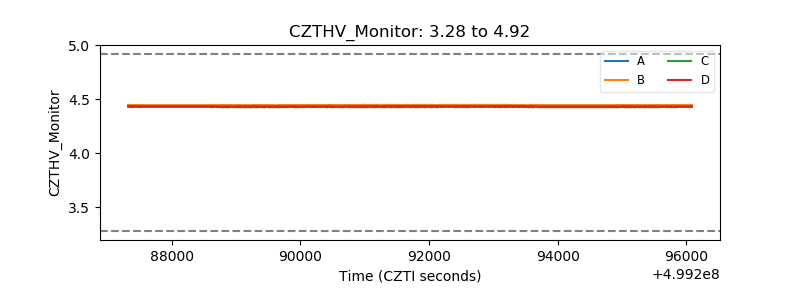 |
| D_VDD | 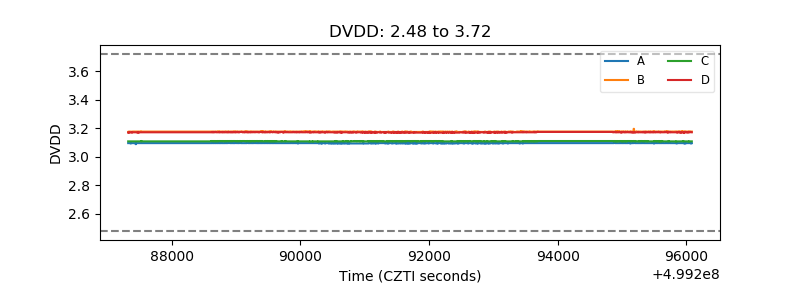 |
| Temperature 1 | 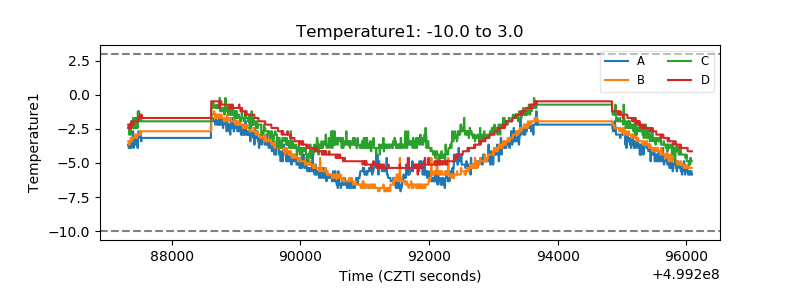 |
| Veto HV Monitor | 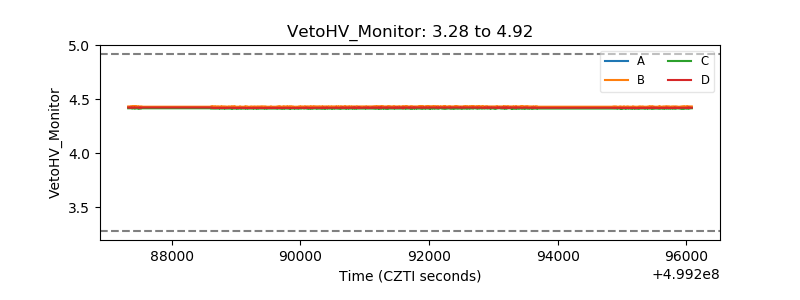 |
| Veto LLD | 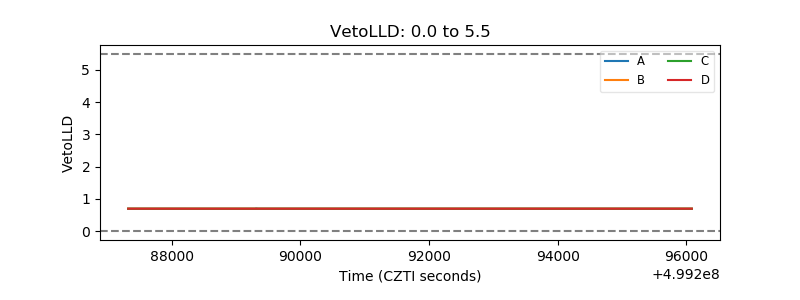 |
| Alpha Counter | 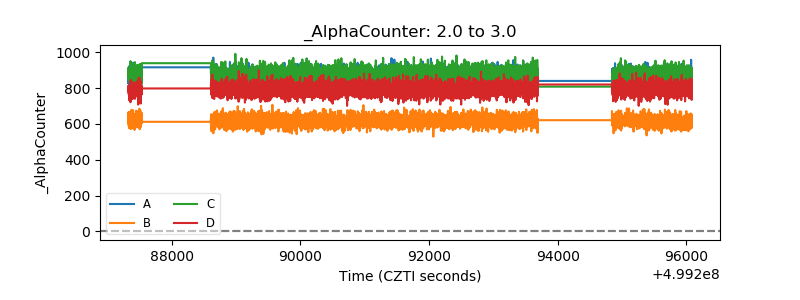 |
| _CPM_Rate | 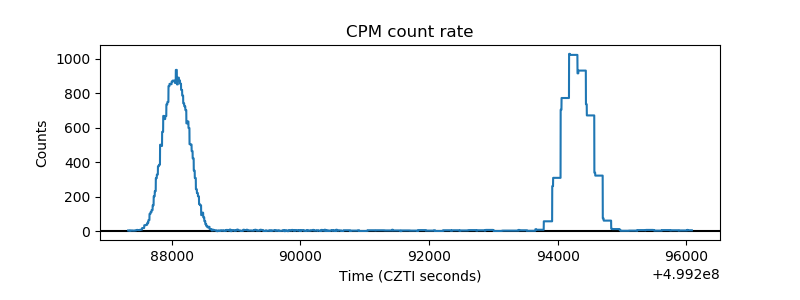 |
| CZT Counter | 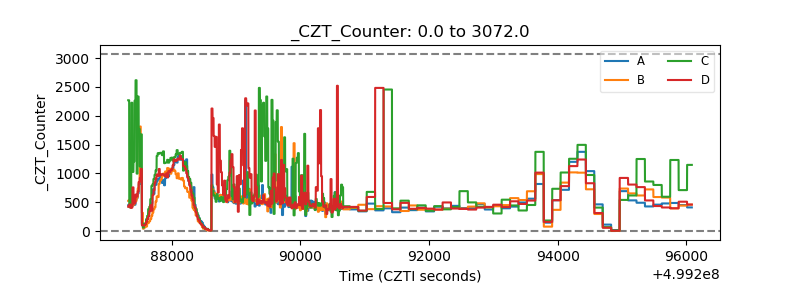 |
| +2.5 Volts monitor |  |
| +5 Volts monitor |  |
| _ROLL_ROT | 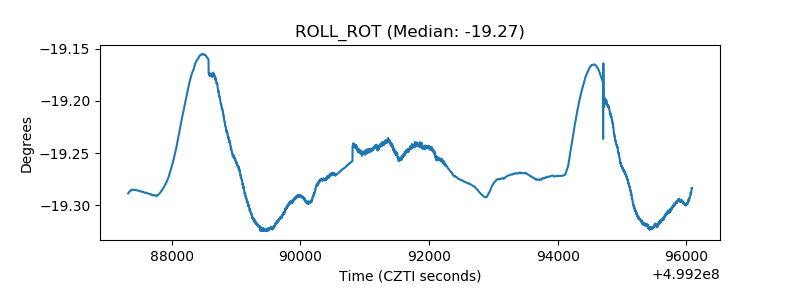 |
| _Roll_DEC | 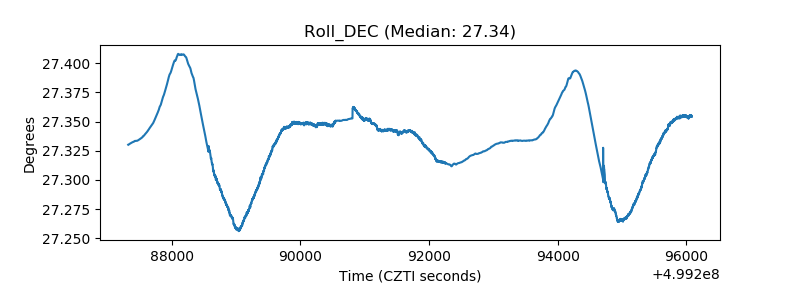 |
| _Roll_RA | 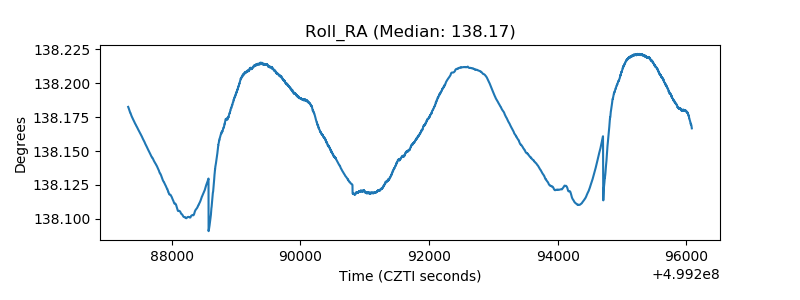 |
| Veto Counter | 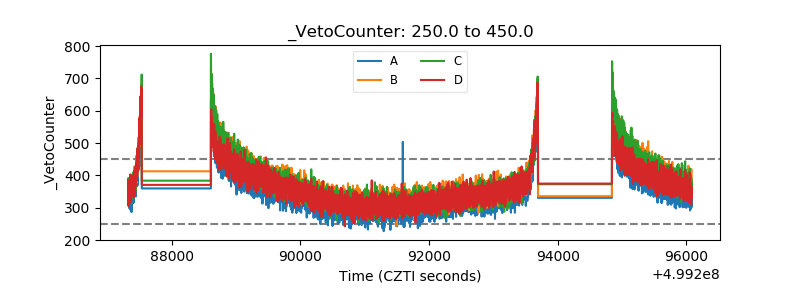 |