| Param | Original file | Final file |
|---|---|---|
| Filename | modeM0/AS1A14_127T09_9000006520_54545cztM0_level2.fits | modeM0/AS1A14_127T09_9000006520_54545cztM0_level2_quad_clean.evt |
| Size (bytes) | 399,726,720 | 98,763,840 |
| Size | 381.2 MB | 94.2 MB |
| Events in quadrant A | 3,129,773 | 657,883 |
| Events in quadrant B | 3,182,410 | 702,971 |
| Events in quadrant C | 4,716,102 | 597,662 |
| Events in quadrant D | 3,266,318 | 582,310 |
| Mode M0 | |||
|---|---|---|---|
| Quadrant | BADHDUFLAG | Total packets | Discarded packets |
| A | 0 | 13897 | 2 |
| B | 0 | 14046 | 2 |
| C | 0 | 18576 | 2 |
| D | 0 | 14436 | 2 |
| Mode SS | |||
|---|---|---|---|
| Quadrant | BADHDUFLAG | Total packets | Discarded packets |
| A | 0 | 130 | 0 |
| B | 0 | 130 | 0 |
| C | 0 | 130 | 0 |
| D | 0 | 130 | 0 |
| Mode M9 | |||
|---|---|---|---|
| Quadrant | BADHDUFLAG | Total packets | Discarded packets |
| A | 0 | 18 | 0 |
| B | 0 | 19 | 0 |
| C | 0 | 19 | 0 |
| D | 0 | 19 | 0 |
| Quadrant | Total seconds | Saturated seconds | Saturation percentage |
|---|---|---|---|
| A | 6451 | 67 | 1.038599% |
| B | 6451 | 78 | 1.209115% |
| C | 6451 | 397 | 6.154085% |
| D | 6451 | 113 | 1.751666% |
Noise dominated data is calculated using 1-second bins in cleaned event files. If a bin has >2000 counts, and if more than 50% of those come from <1% of pixels, then it is considered to be noise-dominated and hence unusable.
| Quadrant | # 1 sec bins | Bins with >0 counts | Bins with >2000 counts | High rate bins dominated by noise | Noise dominated (total time) | Noise dominated (detector-on time) | Marked lightcurve |
|---|---|---|---|---|---|---|---|
| A | 7616 | 6452 | 28 | 28 | 0.37% | 0.43% | 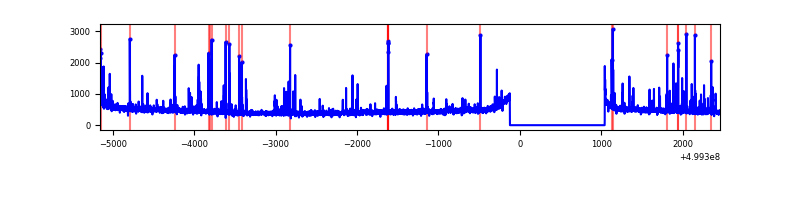 |
| B | 7616 | 6451 | 10 | 10 | 0.13% | 0.16% | 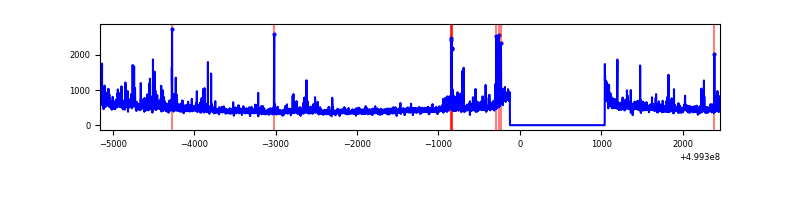 |
| C | 7616 | 6452 | 327 | 327 | 4.29% | 5.07% | 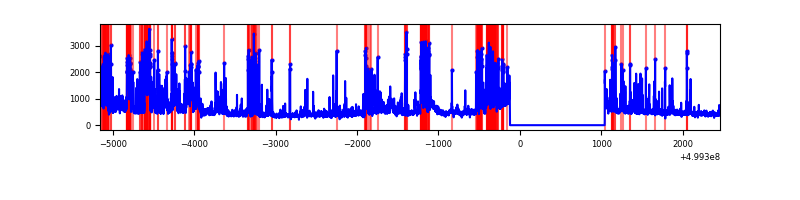 |
| D | 7616 | 6452 | 75 | 75 | 0.98% | 1.16% | 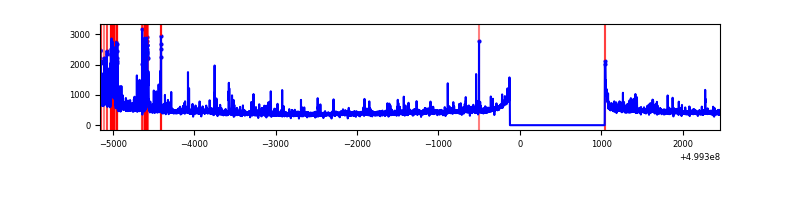 |
Top three noisy pixels from each quadrant. If the there are fewer than three noisy pixels in the level2.evt file, extra rows are filled as -1
| Pixel properties | Quadrant properties | ||||||
|---|---|---|---|---|---|---|---|
| Quadrant | DetID | PixID | Counts | Sigma | Mean | Median | Sigma |
| A | 11 | 3 | 155044 | 851.12 | 729 | 713 | 181.3 |
| A | 4 | 249 | 45830 | 248.81 | 729 | 713 | 181.3 |
| A | 3 | 14 | 28475 | 153.1 | 729 | 713 | 181.3 |
| B | 8 | 234 | 91363 | 581.37 | 723 | 697 | 156.0 |
| B | 0 | 213 | 63714 | 404.08 | 723 | 697 | 156.0 |
| B | 5 | 185 | 47628 | 300.93 | 723 | 697 | 156.0 |
| C | 4 | 5 | 655994 | 3419.27 | 695 | 689 | 191.7 |
| C | 12 | 254 | 470540 | 2451.6 | 695 | 689 | 191.7 |
| C | 13 | 3 | 348115 | 1812.81 | 695 | 689 | 191.7 |
| D | 6 | 239 | 282709 | 1419.29 | 700 | 670 | 198.7 |
| D | 1 | 3 | 77394 | 386.09 | 700 | 670 | 198.7 |
| D | 3 | 12 | 50145 | 248.97 | 700 | 670 | 198.7 |
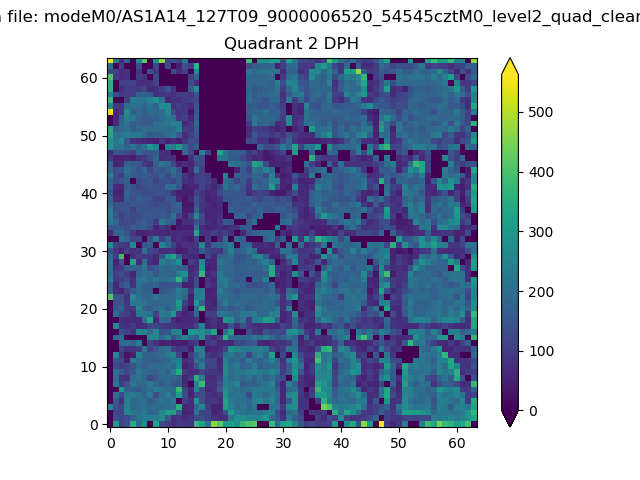
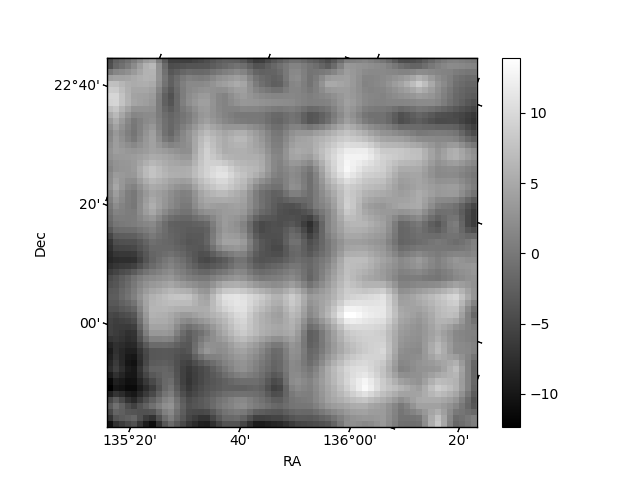
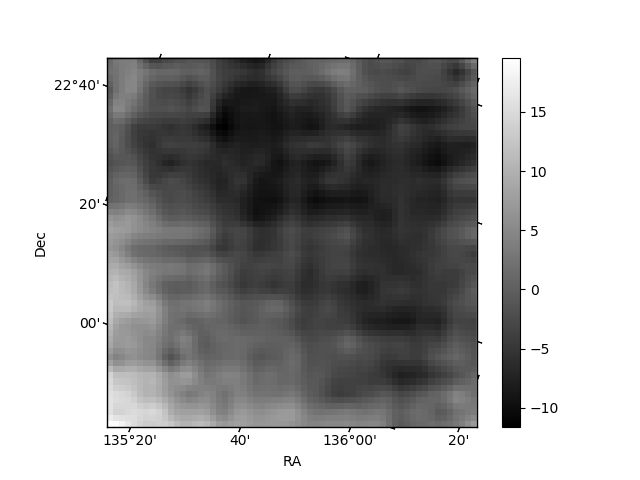
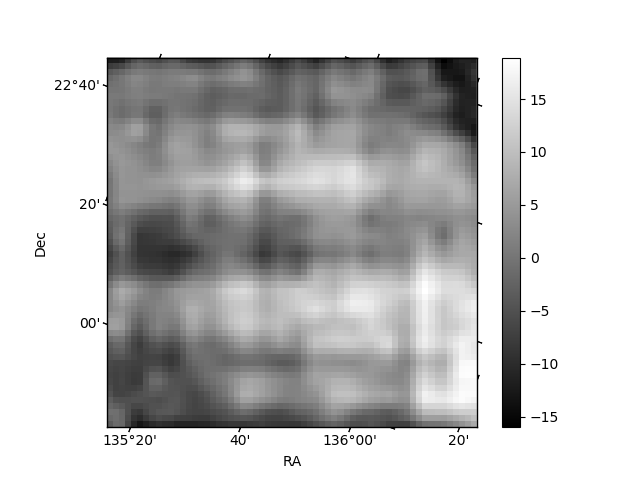
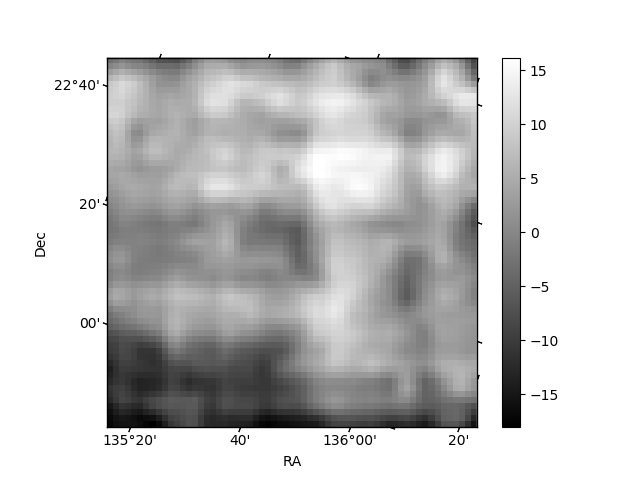
Histogram calculated using DETX and DETY for each event in the final _common_clean file
| Quadrant A | 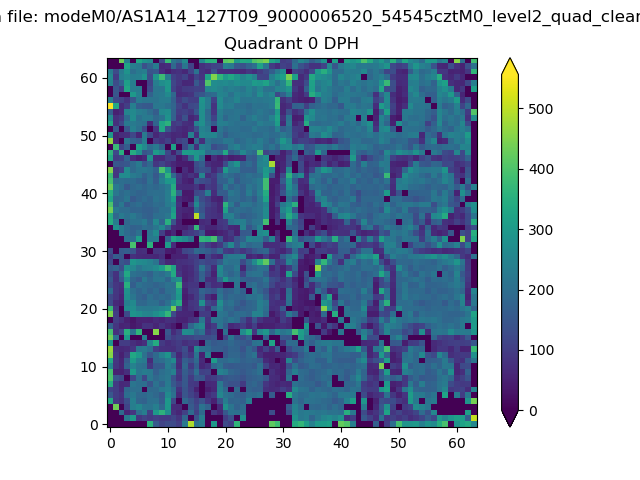 |
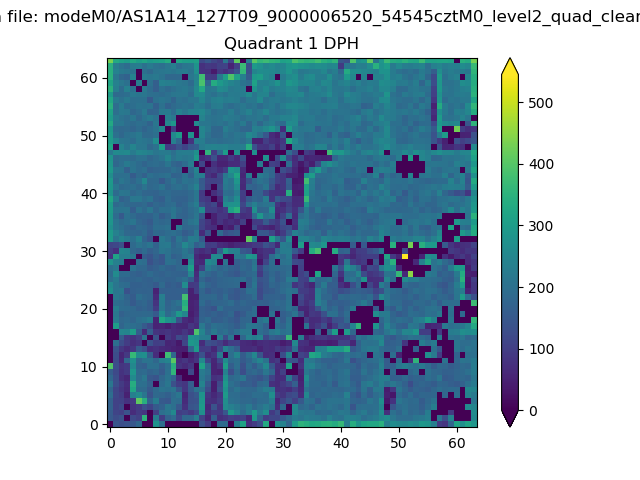 |
Quadrant B |
|---|---|---|---|
| Quadrant D | 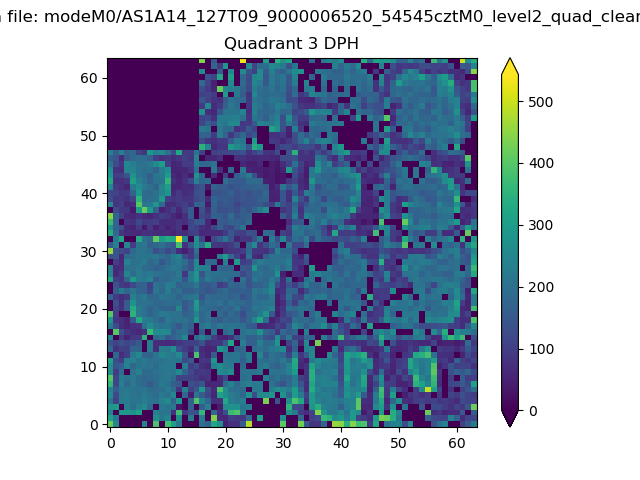 |
 |
Quadrant C |
| Plot type | Count rate plots | Images |
|---|---|---|
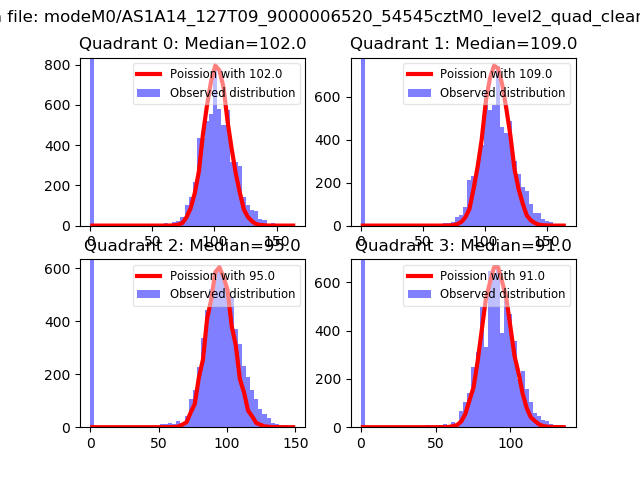
| Comparison with Poisson distribution Blue bars denote a histogram of data divided into 1 sec bins. Red curve is a Poisson curve with rate = median count rate of data. |
 |
 |
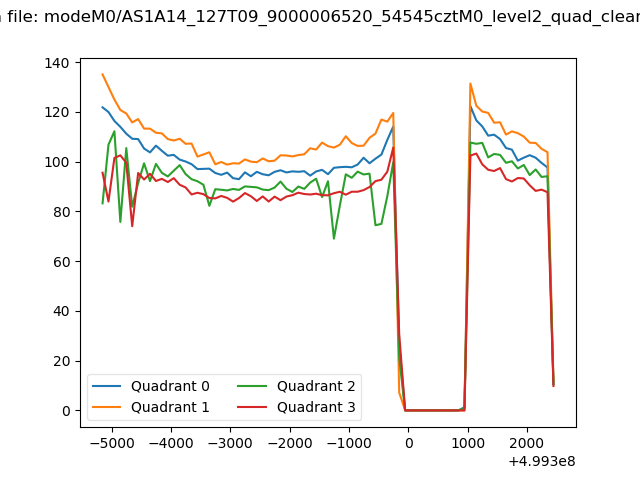
| Quadrant-wise count rates Data is divided into 100 sec bins |
 |
|
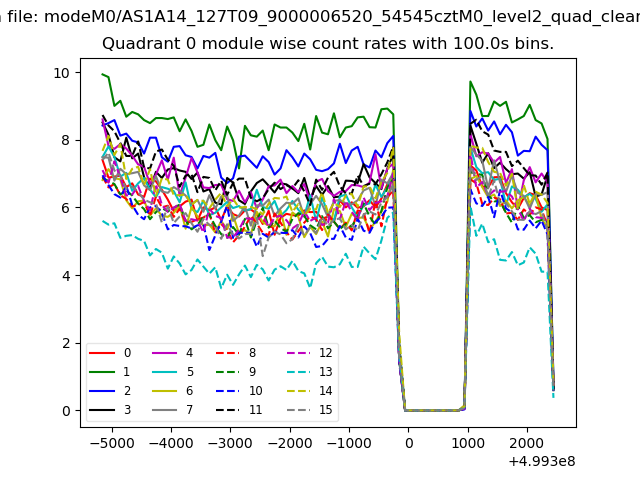
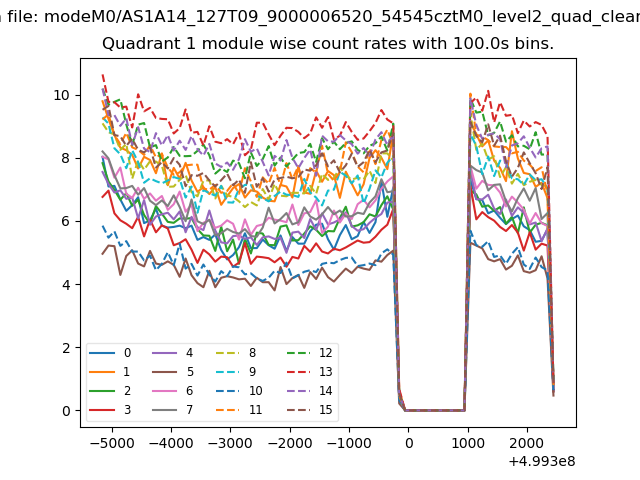
| Module-wise count rates for Quadrant A Data is divided into 100 sec bins |
 |
 |
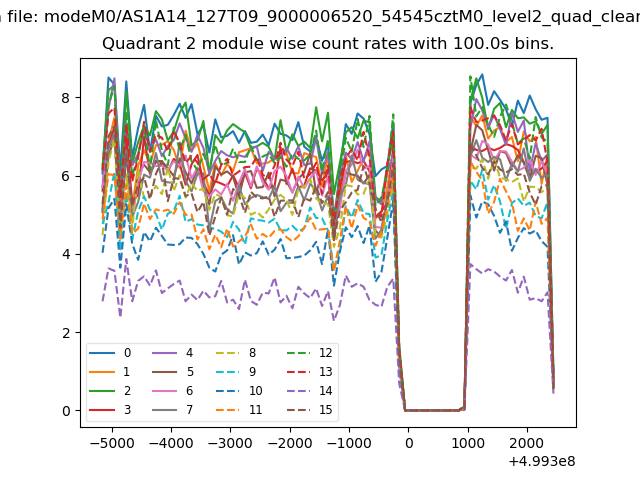
| Module-wise count rates for Quadrant B Data is divided into 100 sec bins |
 |
 |
| Module-wise count rates for Quadrant C Data is divided into 100 sec bins |
 |
 |
| Module-wise count rates for Quadrant D Data is divided into 100 sec bins |
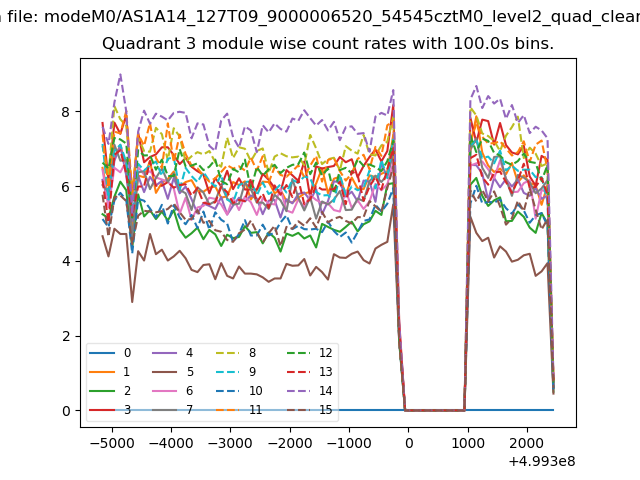 |
 |
| Parameter | Plot |
|---|---|
| CZT HV Monitor |  |
| D_VDD | 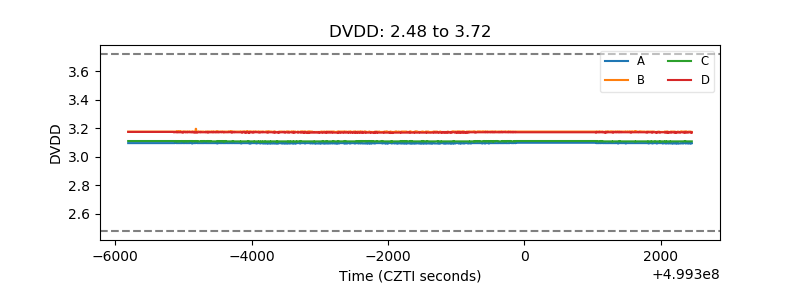 |
| Temperature 1 | 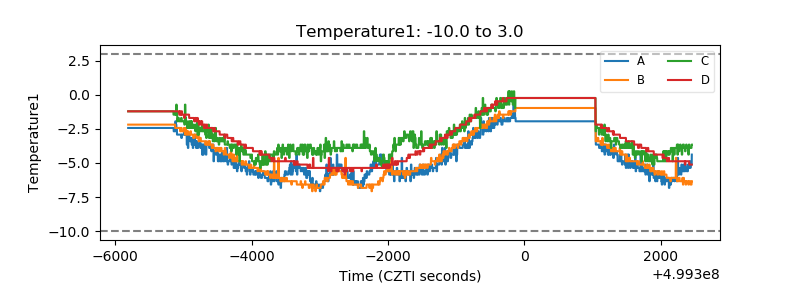 |
| Veto HV Monitor | 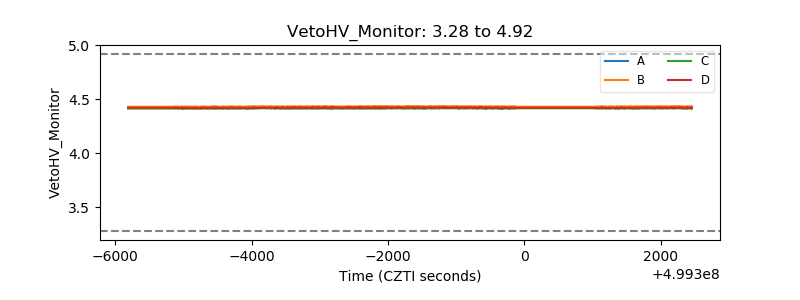 |
| Veto LLD | 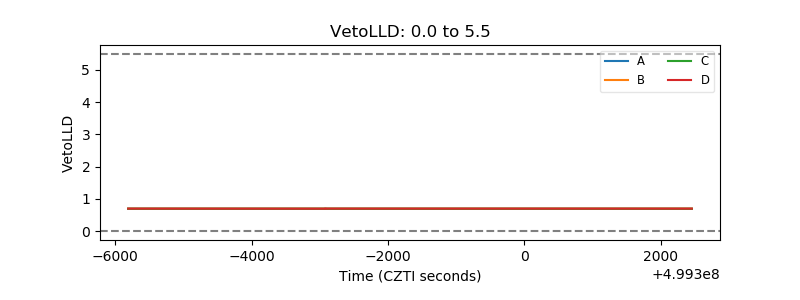 |
| Alpha Counter | 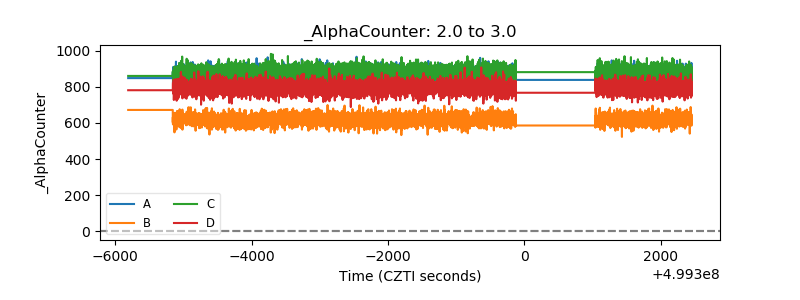 |
| _CPM_Rate | 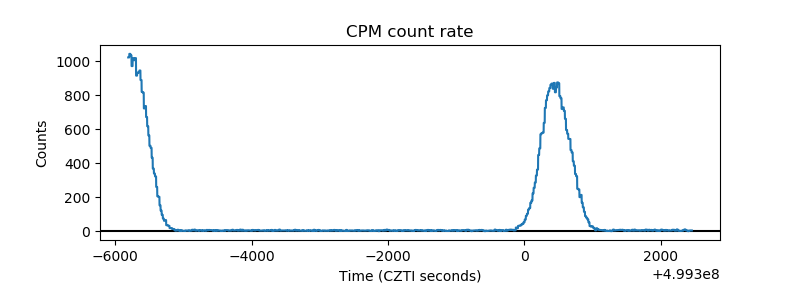 |
| CZT Counter | 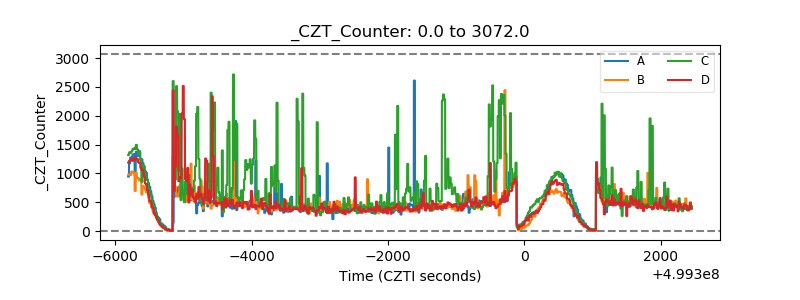 |
| +2.5 Volts monitor |  |
| +5 Volts monitor |  |
| _ROLL_ROT | 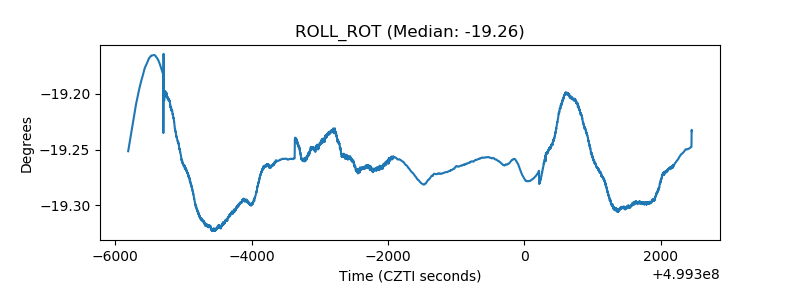 |
| _Roll_DEC | 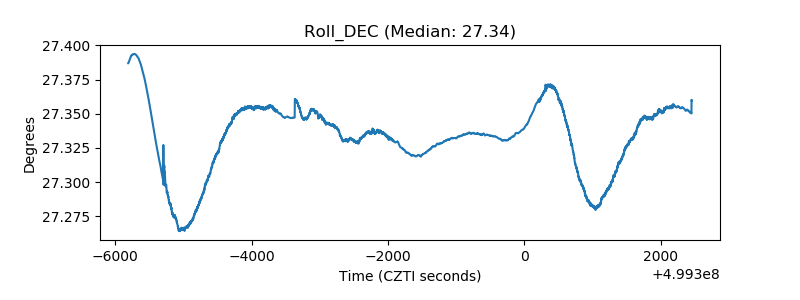 |
| _Roll_RA | 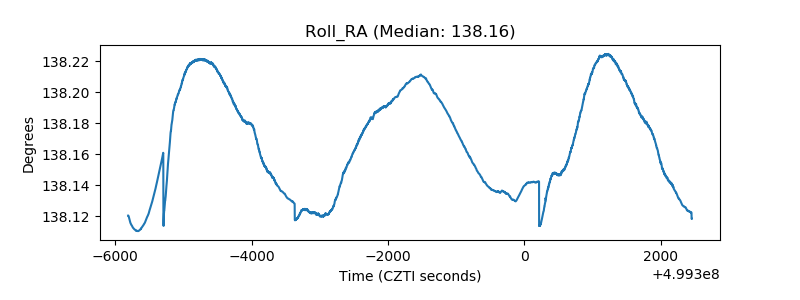 |
| Veto Counter | 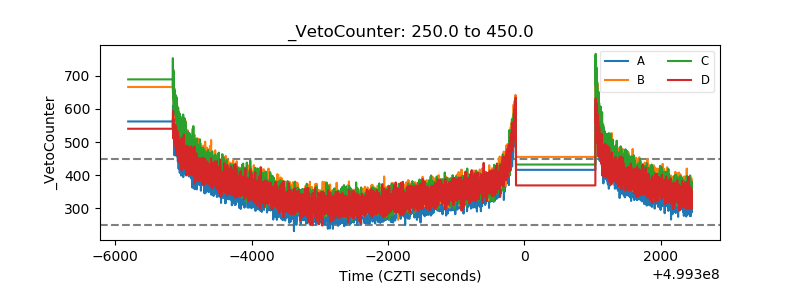 |