| Param | Original file | Final file |
|---|---|---|
| Filename | modeM0/AS1A14_127T09_9000006520_54546cztM0_level2.fits | modeM0/AS1A14_127T09_9000006520_54546cztM0_level2_quad_clean.evt |
| Size (bytes) | 437,880,960 | 108,132,480 |
| Size | 417.6 MB | 103.1 MB |
| Events in quadrant A | 3,445,955 | 718,295 |
| Events in quadrant B | 3,665,665 | 767,596 |
| Events in quadrant C | 5,002,611 | 650,547 |
| Events in quadrant D | 3,537,845 | 639,788 |
| Mode M0 | |||
|---|---|---|---|
| Quadrant | BADHDUFLAG | Total packets | Discarded packets |
| A | 0 | 15422 | 2 |
| B | 0 | 15973 | 2 |
| C | 0 | 20088 | 2 |
| D | 0 | 15691 | 2 |
| Mode SS | |||
|---|---|---|---|
| Quadrant | BADHDUFLAG | Total packets | Discarded packets |
| A | 0 | 146 | 0 |
| B | 0 | 146 | 0 |
| C | 0 | 146 | 0 |
| D | 0 | 146 | 0 |
| Mode M9 | |||
|---|---|---|---|
| Quadrant | BADHDUFLAG | Total packets | Discarded packets |
| A | 0 | 23 | 0 |
| B | 0 | 23 | 0 |
| C | 0 | 23 | 0 |
| D | 0 | 23 | 0 |
| Quadrant | Total seconds | Saturated seconds | Saturation percentage |
|---|---|---|---|
| A | 7156 | 83 | 1.159866% |
| B | 7157 | 135 | 1.886265% |
| C | 7157 | 511 | 7.139863% |
| D | 7157 | 87 | 1.215593% |
Noise dominated data is calculated using 1-second bins in cleaned event files. If a bin has >2000 counts, and if more than 50% of those come from <1% of pixels, then it is considered to be noise-dominated and hence unusable.
| Quadrant | # 1 sec bins | Bins with >0 counts | Bins with >2000 counts | High rate bins dominated by noise | Noise dominated (total time) | Noise dominated (detector-on time) | Marked lightcurve |
|---|---|---|---|---|---|---|---|
| A | 9461 | 7158 | 26 | 26 | 0.27% | 0.36% | 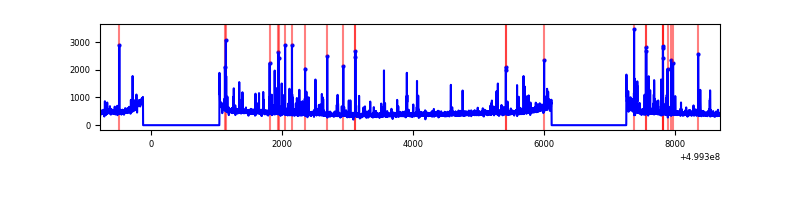 |
| B | 9462 | 7157 | 20 | 20 | 0.21% | 0.28% | 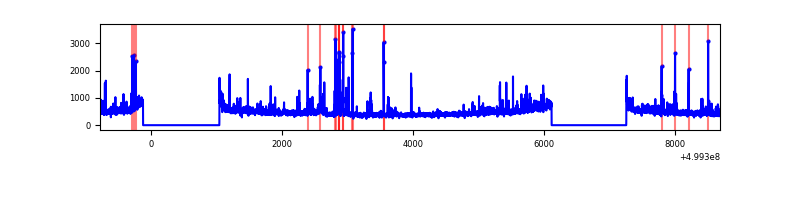 |
| C | 9462 | 7159 | 382 | 382 | 4.04% | 5.34% | 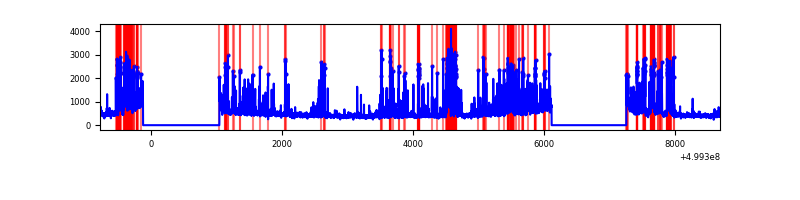 |
| D | 9462 | 7159 | 26 | 26 | 0.27% | 0.36% | 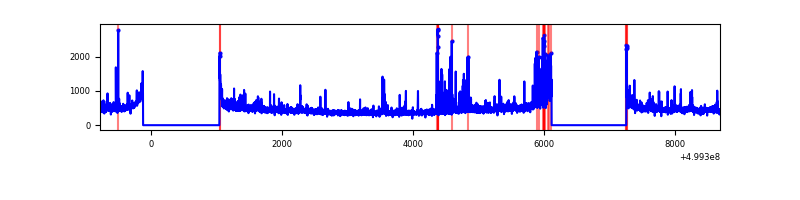 |
Top three noisy pixels from each quadrant. If the there are fewer than three noisy pixels in the level2.evt file, extra rows are filled as -1
| Pixel properties | Quadrant properties | ||||||
|---|---|---|---|---|---|---|---|
| Quadrant | DetID | PixID | Counts | Sigma | Mean | Median | Sigma |
| A | 11 | 3 | 171136 | 852.2 | 810 | 789 | 199.9 |
| A | 4 | 249 | 51891 | 255.65 | 810 | 789 | 199.9 |
| A | 4 | 3 | 30160 | 146.94 | 810 | 789 | 199.9 |
| B | 10 | 247 | 171579 | 984.82 | 805 | 775 | 173.4 |
| B | 8 | 234 | 95316 | 545.1 | 805 | 775 | 173.4 |
| B | 0 | 213 | 63750 | 363.1 | 805 | 775 | 173.4 |
| C | 12 | 254 | 578096 | 2729.24 | 769 | 762 | 211.5 |
| C | 13 | 3 | 575100 | 2715.08 | 769 | 762 | 211.5 |
| C | 1 | 45 | 400319 | 1888.83 | 769 | 762 | 211.5 |
| D | 6 | 239 | 149915 | 670.46 | 783 | 749 | 222.5 |
| D | 15 | 170 | 65196 | 289.67 | 783 | 749 | 222.5 |
| D | 5 | 173 | 52180 | 231.17 | 783 | 749 | 222.5 |
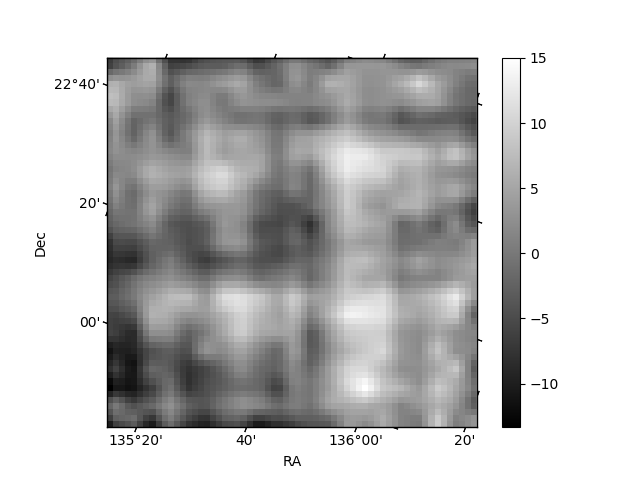
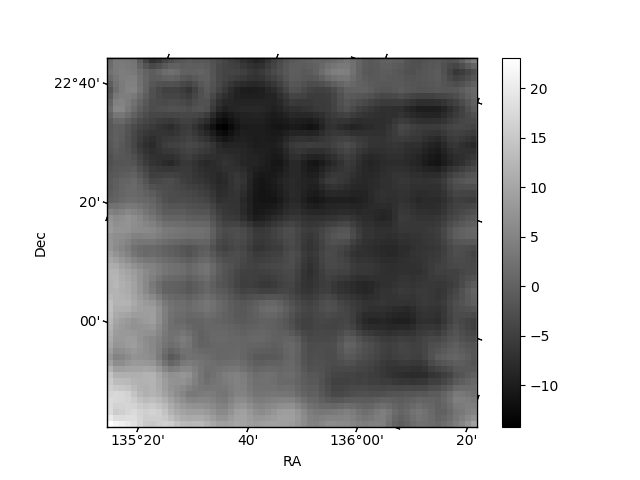
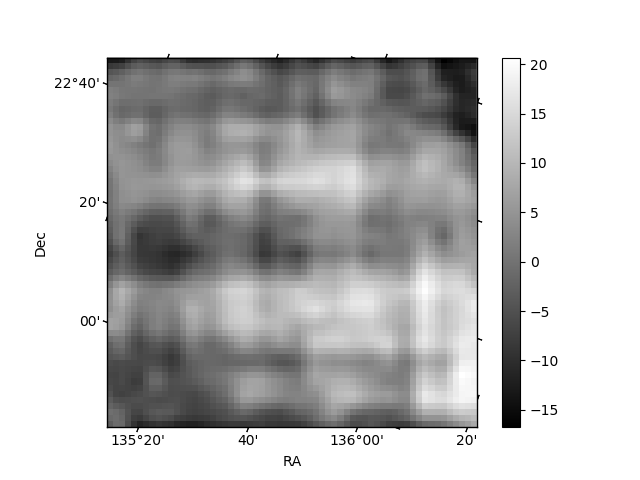
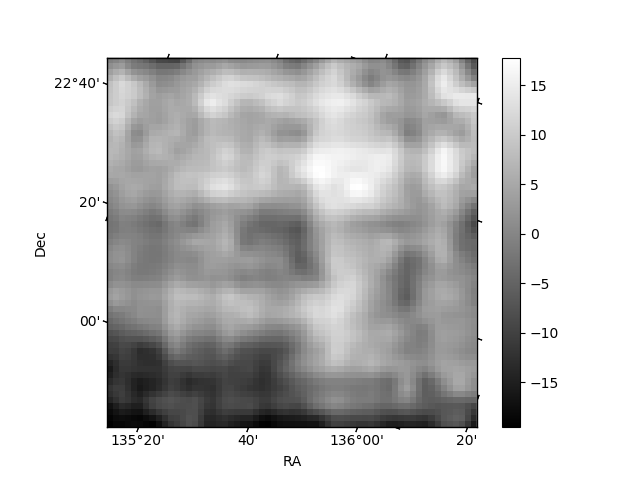
Histogram calculated using DETX and DETY for each event in the final _common_clean file
| Quadrant A | 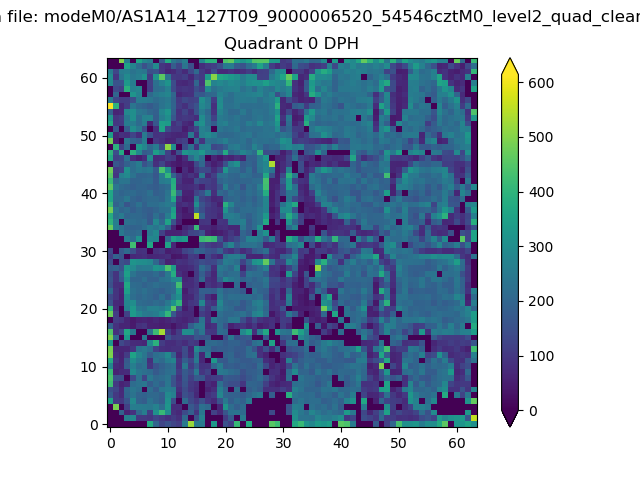 |
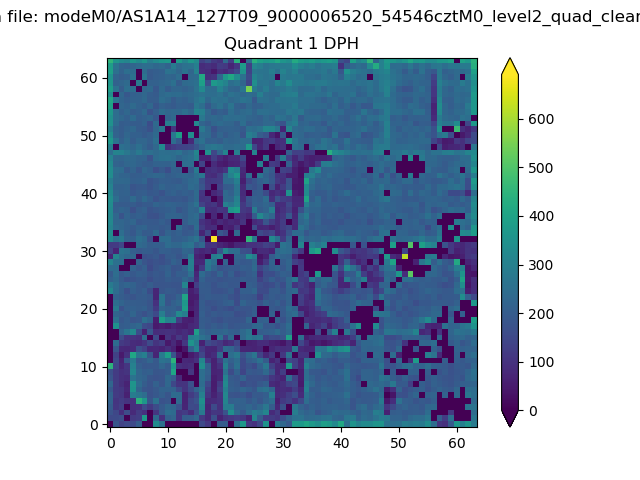 |
Quadrant B |
|---|---|---|---|
| Quadrant D | 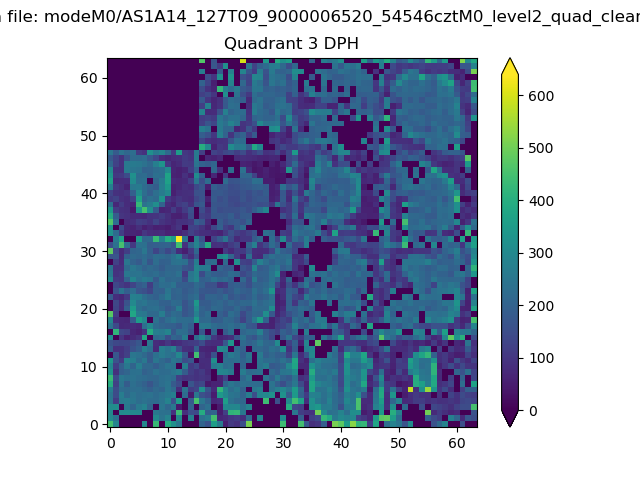 |
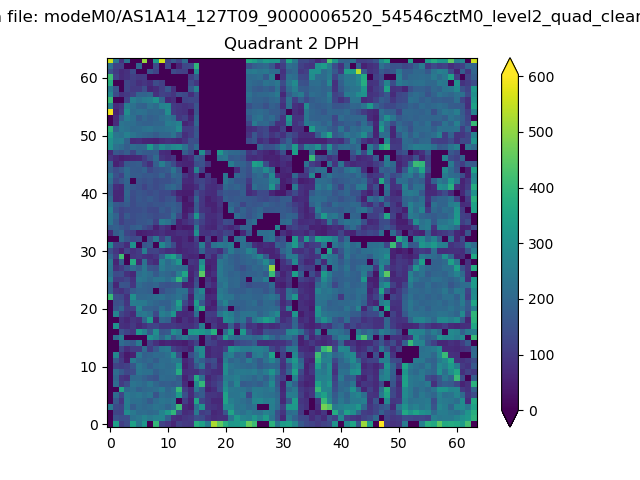 |
Quadrant C |
| Plot type | Count rate plots | Images |
|---|---|---|
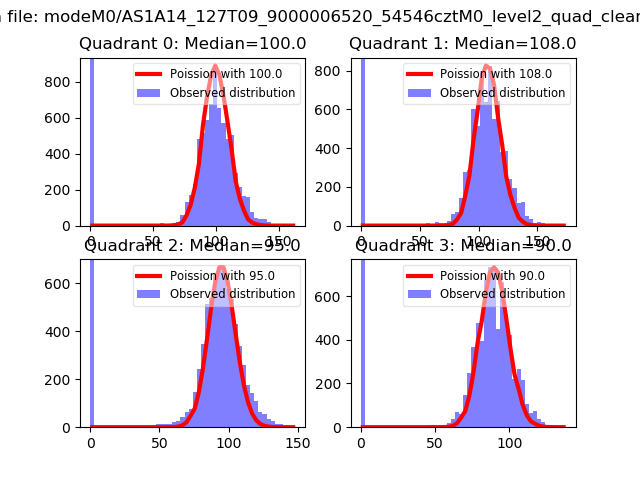
| Comparison with Poisson distribution Blue bars denote a histogram of data divided into 1 sec bins. Red curve is a Poisson curve with rate = median count rate of data. |
 |
 |
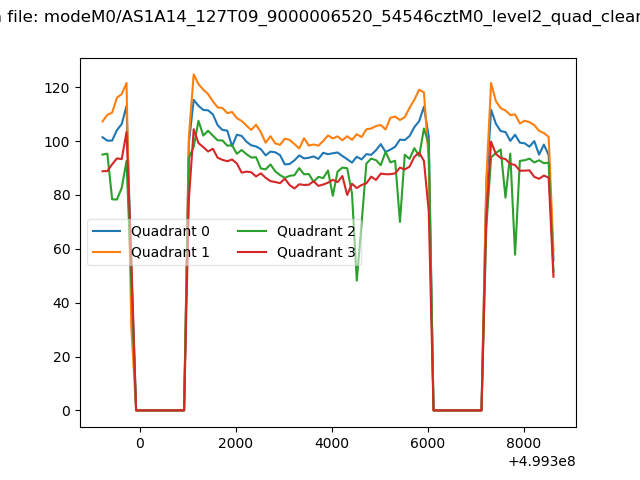
| Quadrant-wise count rates Data is divided into 100 sec bins |
 |
|
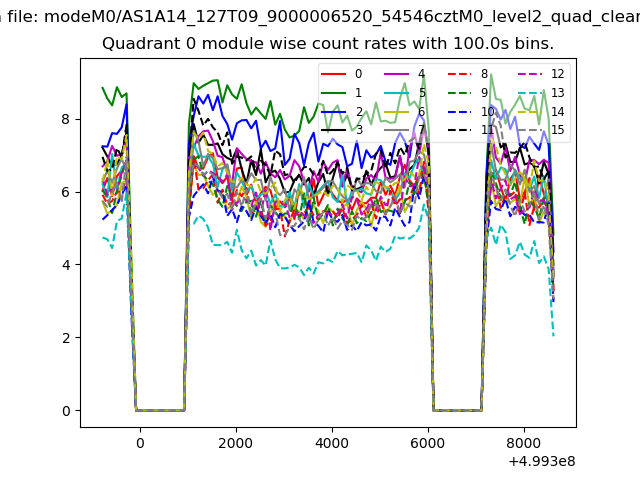
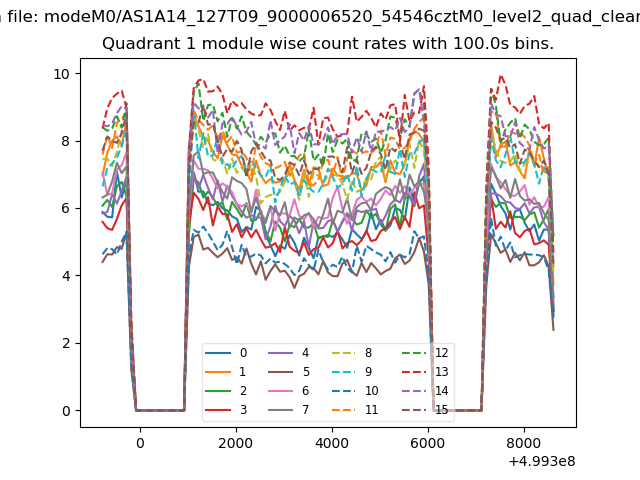
| Module-wise count rates for Quadrant A Data is divided into 100 sec bins |
 |
 |
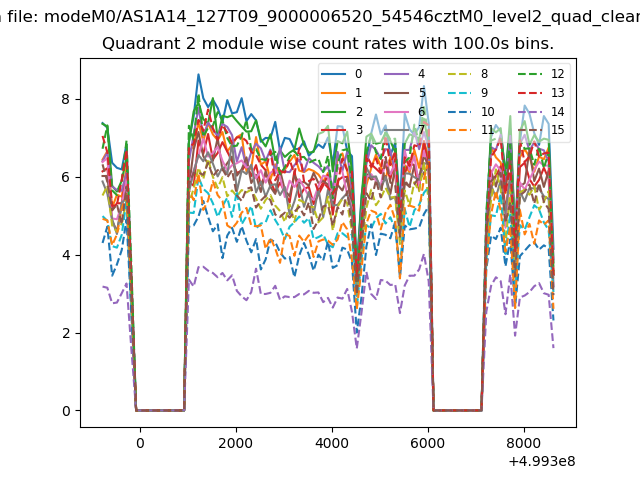
| Module-wise count rates for Quadrant B Data is divided into 100 sec bins |
 |
 |
| Module-wise count rates for Quadrant C Data is divided into 100 sec bins |
 |
 |
| Module-wise count rates for Quadrant D Data is divided into 100 sec bins |
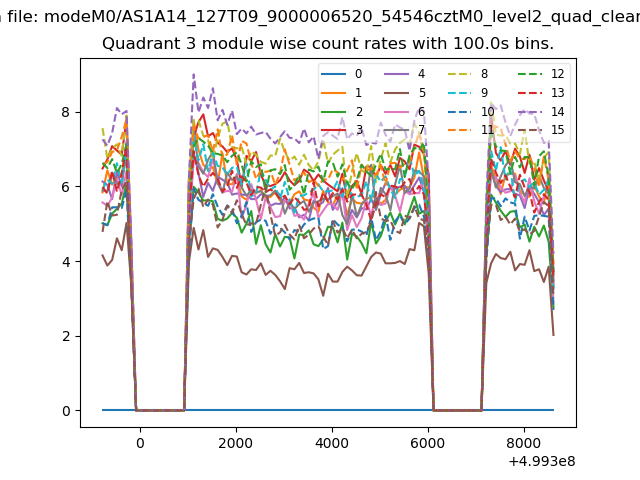 |
 |
| Parameter | Plot |
|---|---|
| CZT HV Monitor | 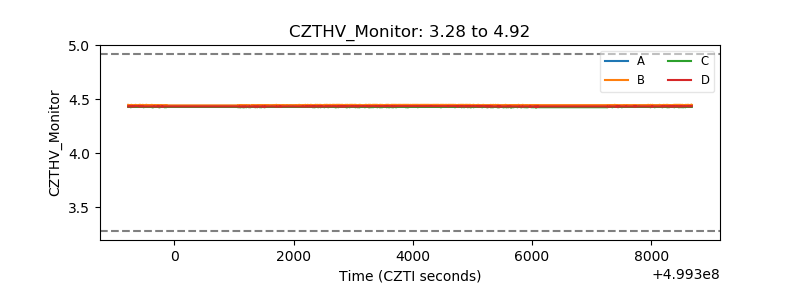 |
| D_VDD | 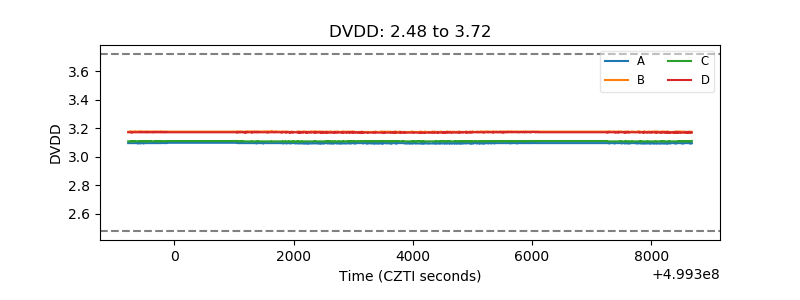 |
| Temperature 1 | 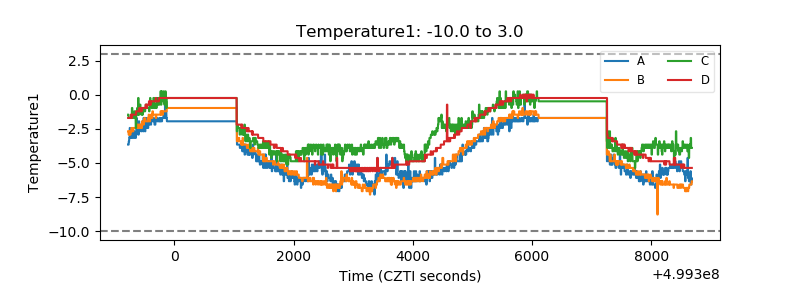 |
| Veto HV Monitor | 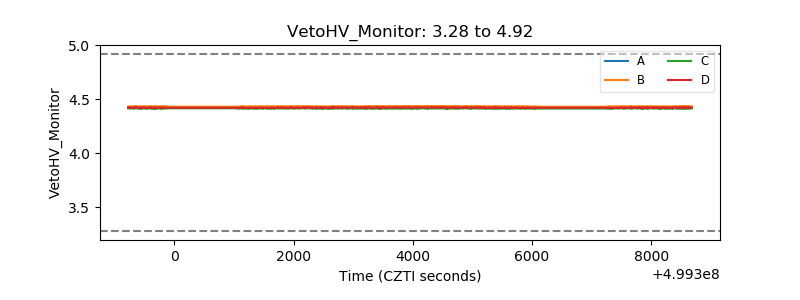 |
| Veto LLD | 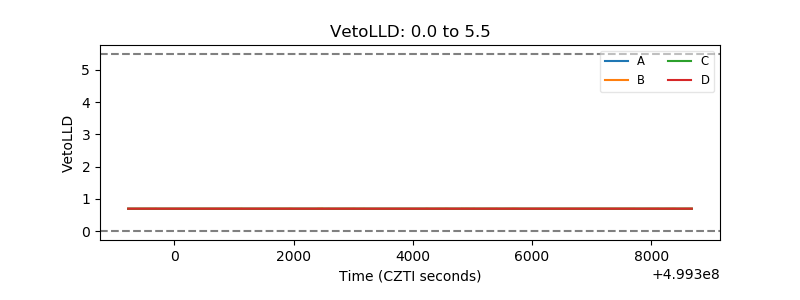 |
| Alpha Counter | 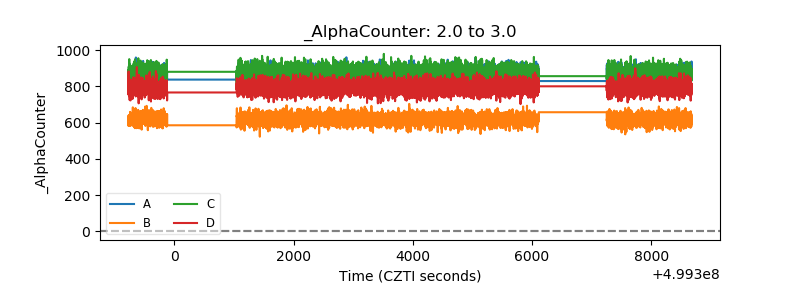 |
| _CPM_Rate | 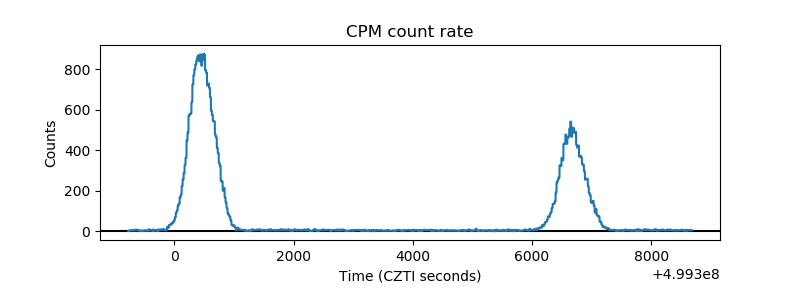 |
| CZT Counter | 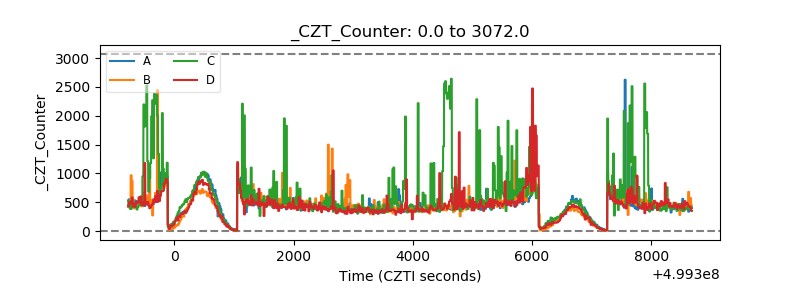 |
| +2.5 Volts monitor |  |
| +5 Volts monitor |  |
| _ROLL_ROT | 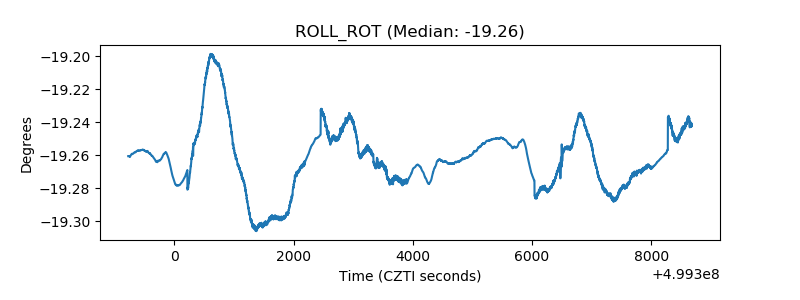 |
| _Roll_DEC | 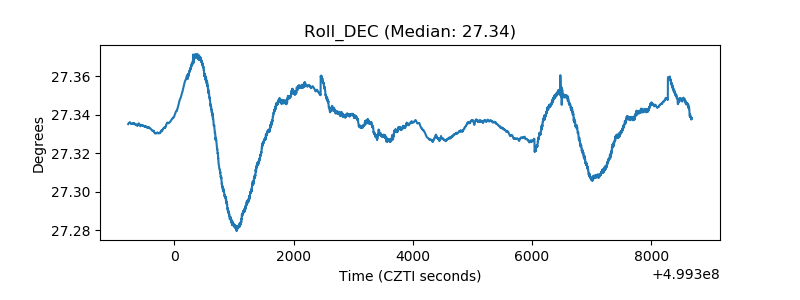 |
| _Roll_RA | 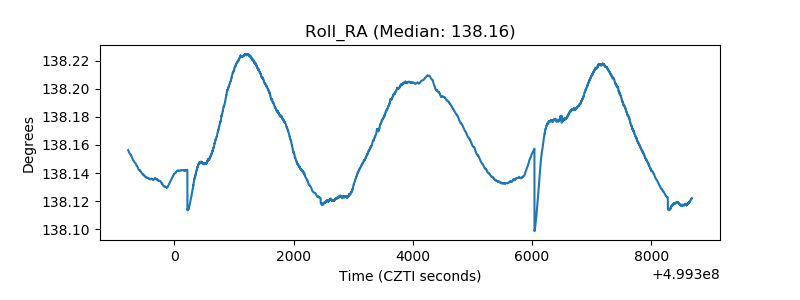 |
| Veto Counter | 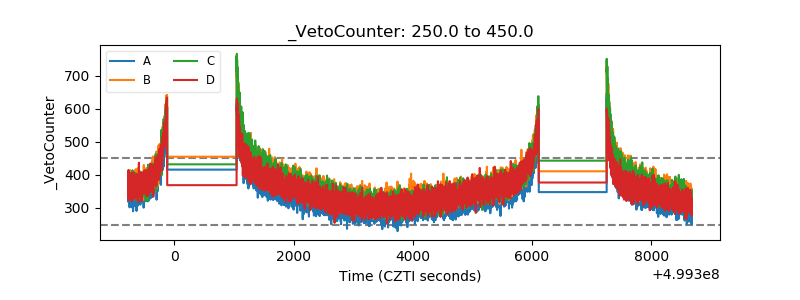 |