| Param | Original file | Final file |
|---|---|---|
| Filename | modeM0/AS1A14_127T09_9000006520_54547cztM0_level2.fits | modeM0/AS1A14_127T09_9000006520_54547cztM0_level2_quad_clean.evt |
| Size (bytes) | 457,672,320 | 103,377,600 |
| Size | 436.5 MB | 98.6 MB |
| Events in quadrant A | 3,415,801 | 691,932 |
| Events in quadrant B | 3,534,454 | 739,605 |
| Events in quadrant C | 5,609,555 | 592,455 |
| Events in quadrant D | 3,826,691 | 609,327 |
| Mode M0 | |||
|---|---|---|---|
| Quadrant | BADHDUFLAG | Total packets | Discarded packets |
| A | 0 | 15498 | 2 |
| B | 0 | 15806 | 2 |
| C | 0 | 22031 | 8 |
| D | 0 | 16715 | 2 |
| Mode SS | |||
|---|---|---|---|
| Quadrant | BADHDUFLAG | Total packets | Discarded packets |
| A | 0 | 148 | 0 |
| B | 0 | 148 | 0 |
| C | 0 | 148 | 0 |
| D | 0 | 148 | 0 |
| Mode M9 | |||
|---|---|---|---|
| Quadrant | BADHDUFLAG | Total packets | Discarded packets |
| A | 0 | 21 | 0 |
| B | 0 | 21 | 0 |
| C | 0 | 21 | 0 |
| D | 0 | 21 | 0 |
| Quadrant | Total seconds | Saturated seconds | Saturation percentage |
|---|---|---|---|
| A | 7131 | 83 | 1.163932% |
| B | 7131 | 144 | 2.019352% |
| C | 7131 | 887 | 12.438648% |
| D | 7131 | 177 | 2.482120% |
Noise dominated data is calculated using 1-second bins in cleaned event files. If a bin has >2000 counts, and if more than 50% of those come from <1% of pixels, then it is considered to be noise-dominated and hence unusable.
| Quadrant | # 1 sec bins | Bins with >0 counts | Bins with >2000 counts | High rate bins dominated by noise | Noise dominated (total time) | Noise dominated (detector-on time) | Marked lightcurve |
|---|---|---|---|---|---|---|---|
| A | 9246 | 7133 | 41 | 41 | 0.44% | 0.57% | 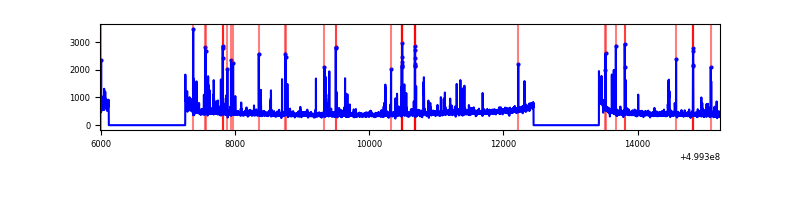 |
| B | 9246 | 7132 | 28 | 28 | 0.30% | 0.39% | 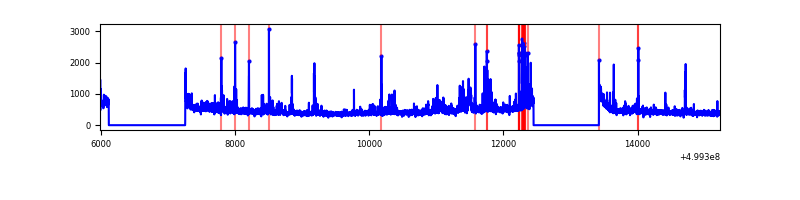 |
| C | 9245 | 7132 | 728 | 728 | 7.87% | 10.21% | 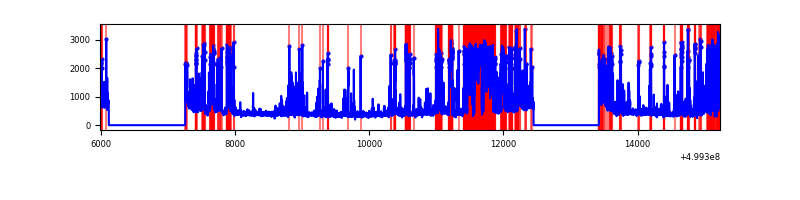 |
| D | 9246 | 7133 | 137 | 137 | 1.48% | 1.92% | 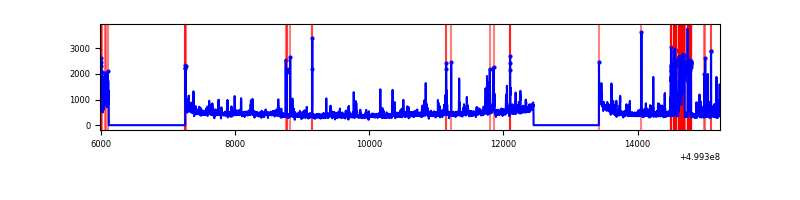 |
Top three noisy pixels from each quadrant. If the there are fewer than three noisy pixels in the level2.evt file, extra rows are filled as -1
| Pixel properties | Quadrant properties | ||||||
|---|---|---|---|---|---|---|---|
| Quadrant | DetID | PixID | Counts | Sigma | Mean | Median | Sigma |
| A | 11 | 3 | 223734 | 1152.39 | 780 | 760 | 193.5 |
| A | 4 | 3 | 39335 | 199.37 | 780 | 760 | 193.5 |
| A | 3 | 110 | 35271 | 178.36 | 780 | 760 | 193.5 |
| B | 8 | 234 | 113939 | 672.47 | 775 | 747 | 168.3 |
| B | 2 | 249 | 83951 | 494.31 | 775 | 747 | 168.3 |
| B | 10 | 247 | 58567 | 343.51 | 775 | 747 | 168.3 |
| C | 12 | 254 | 1329261 | 6797.75 | 709 | 704 | 195.4 |
| C | 4 | 5 | 493849 | 2523.25 | 709 | 704 | 195.4 |
| C | 1 | 45 | 411187 | 2100.3 | 709 | 704 | 195.4 |
| D | 10 | 181 | 390326 | 1804.25 | 750 | 716 | 215.9 |
| D | 6 | 239 | 129973 | 598.58 | 750 | 716 | 215.9 |
| D | 3 | 12 | 109027 | 501.58 | 750 | 716 | 215.9 |
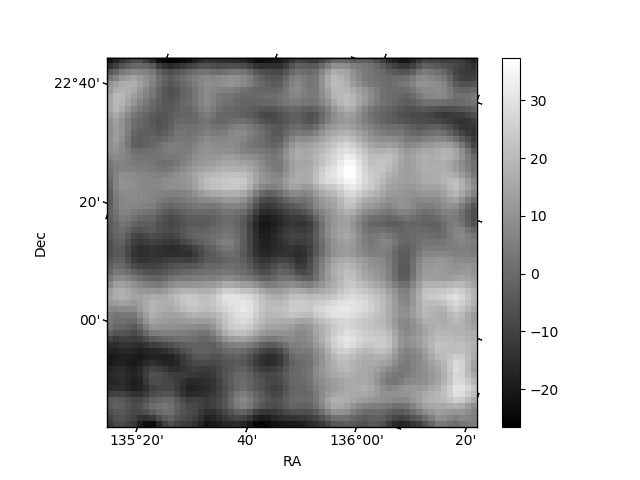
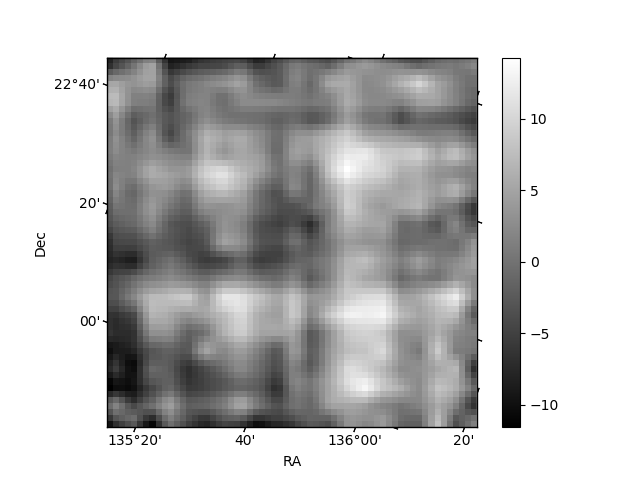
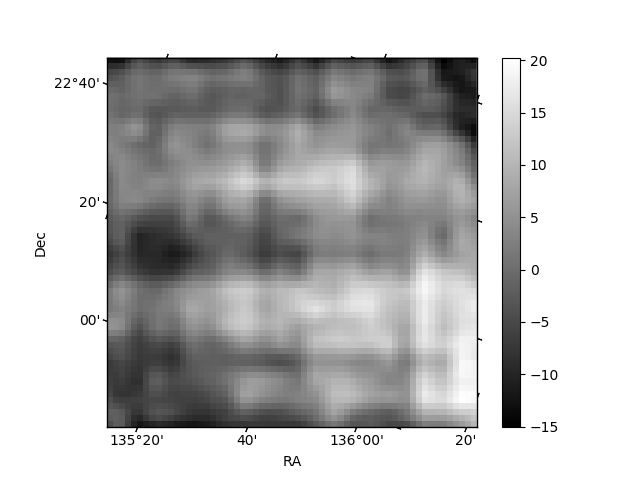
Histogram calculated using DETX and DETY for each event in the final _common_clean file
| Quadrant A | 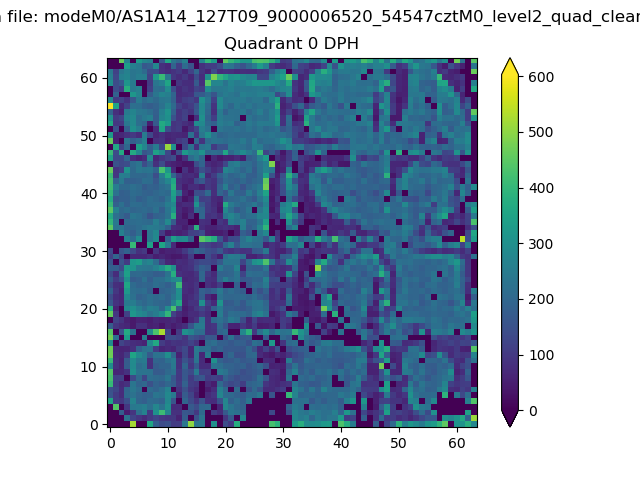 |
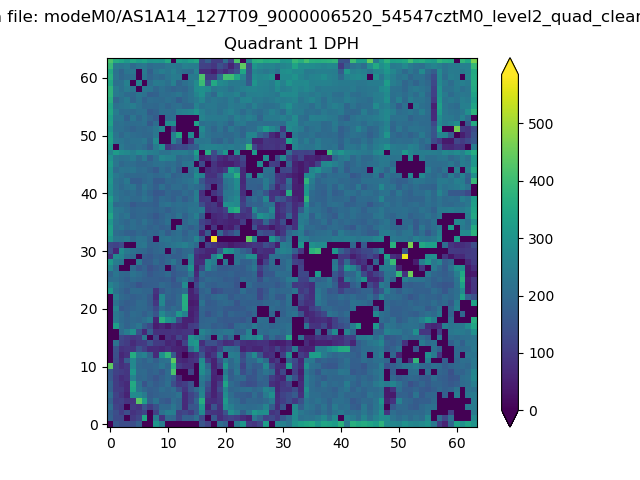 |
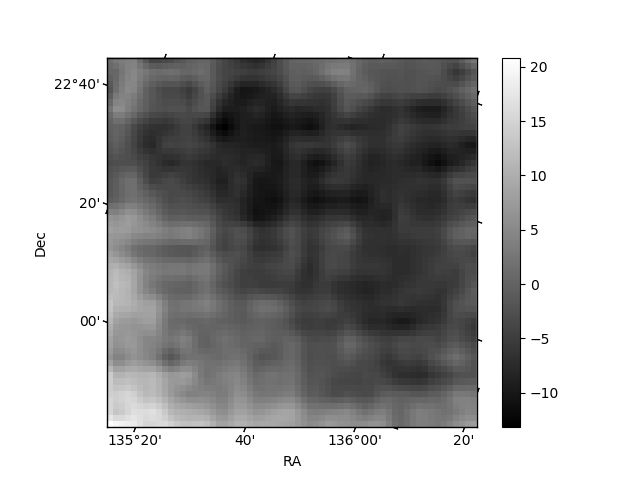
Quadrant B |
|---|---|---|---|
| Quadrant D | 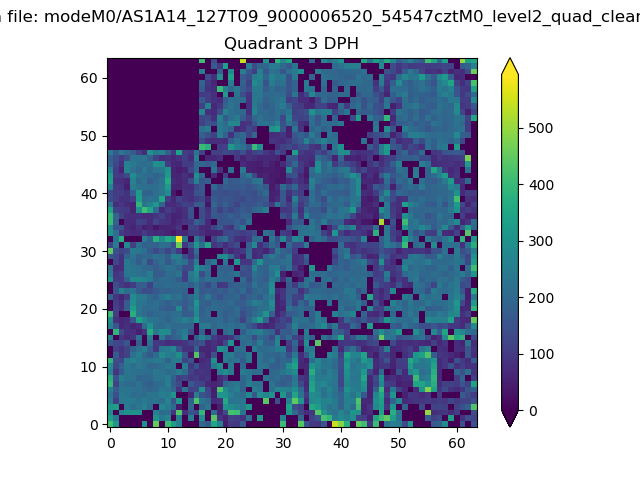 |
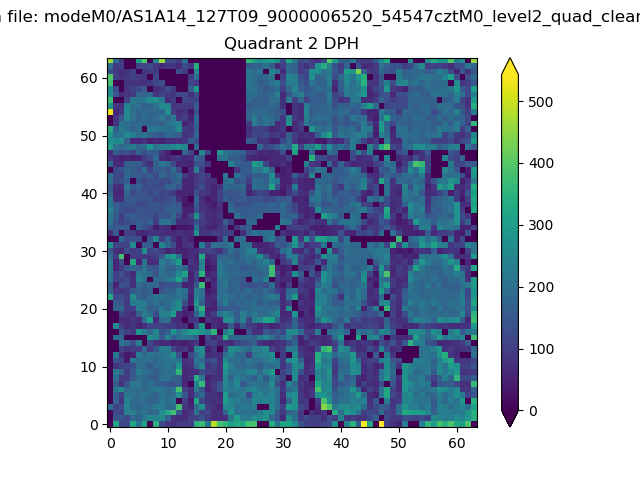 |
Quadrant C |
| Plot type | Count rate plots | Images |
|---|---|---|
| Comparison with Poisson distribution Blue bars denote a histogram of data divided into 1 sec bins. Red curve is a Poisson curve with rate = median count rate of data. |
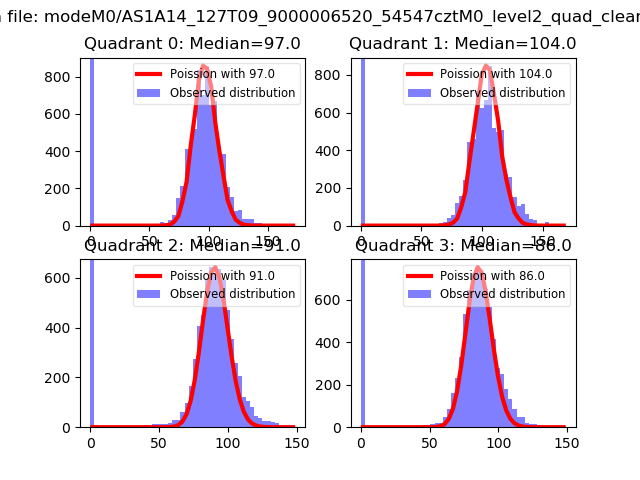 |
 |
| Quadrant-wise count rates Data is divided into 100 sec bins |
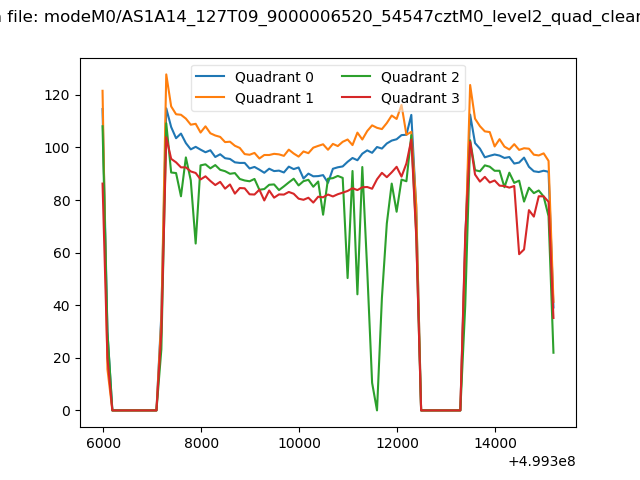 |
|
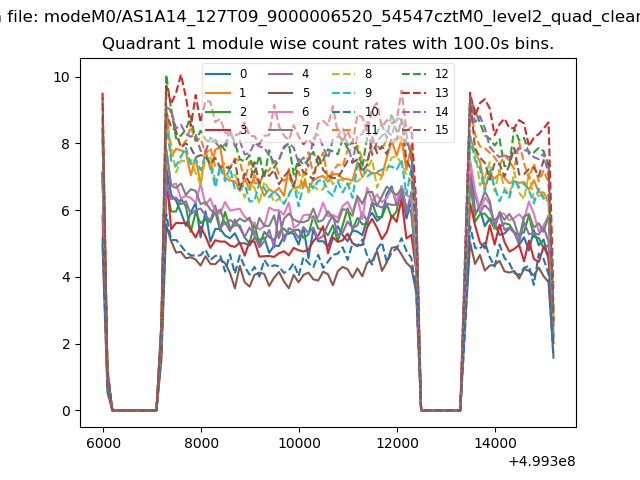
| Module-wise count rates for Quadrant A Data is divided into 100 sec bins |
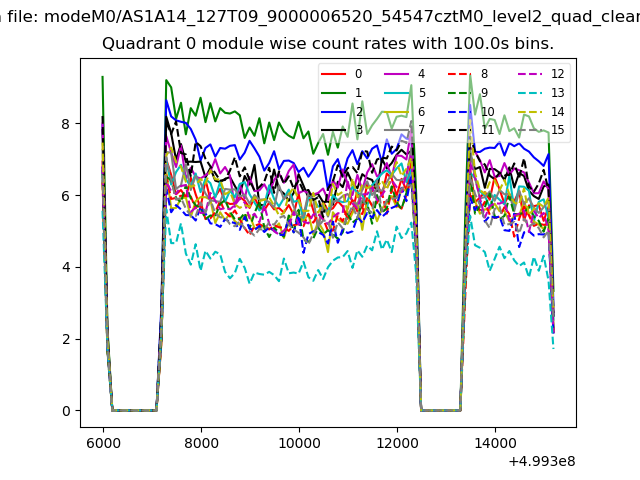 |
 |
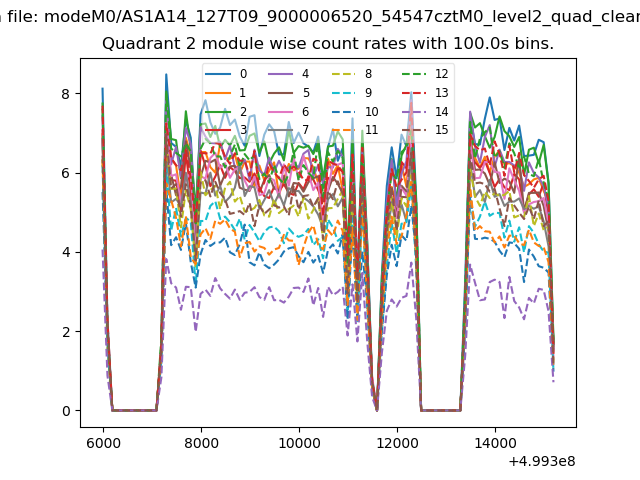
| Module-wise count rates for Quadrant B Data is divided into 100 sec bins |
 |
 |
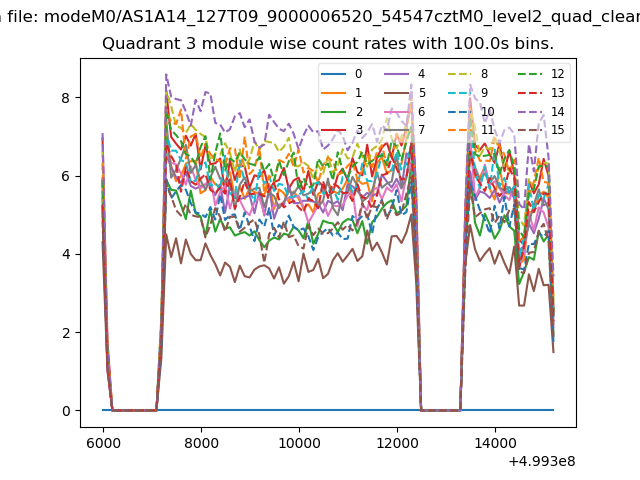
| Module-wise count rates for Quadrant C Data is divided into 100 sec bins |
 |
 |
| Module-wise count rates for Quadrant D Data is divided into 100 sec bins |
 |
 |
| Parameter | Plot |
|---|---|
| CZT HV Monitor | 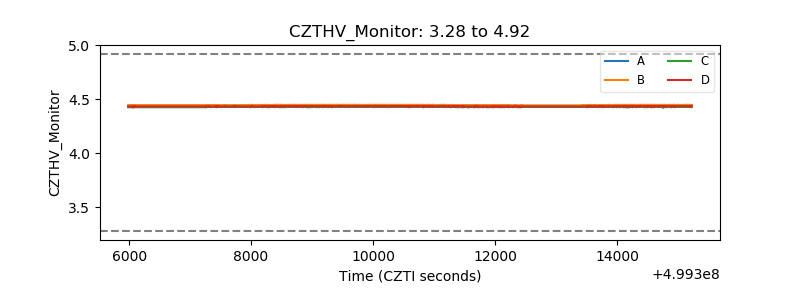 |
| D_VDD | 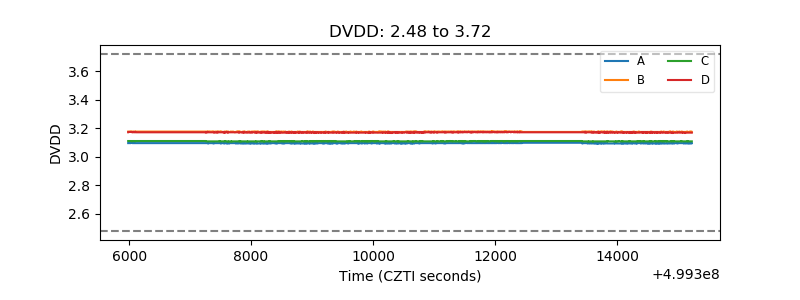 |
| Temperature 1 | 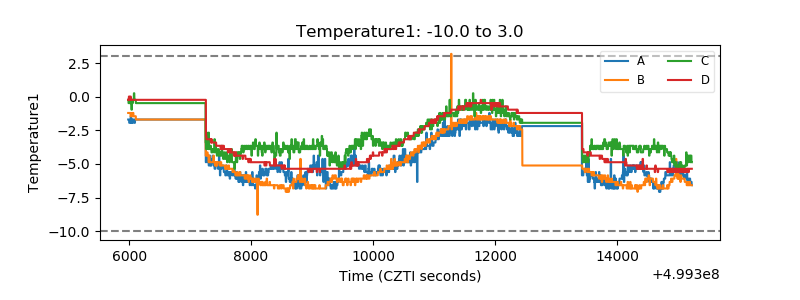 |
| Veto HV Monitor | 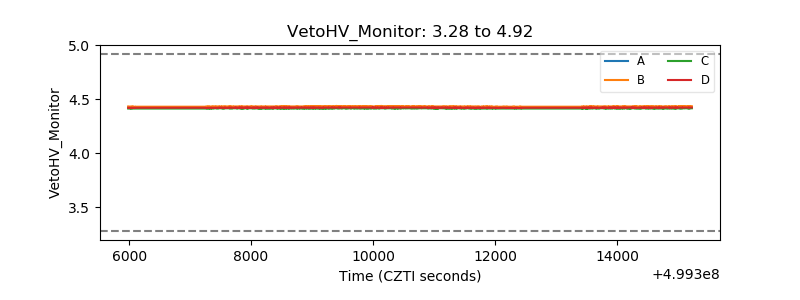 |
| Veto LLD | 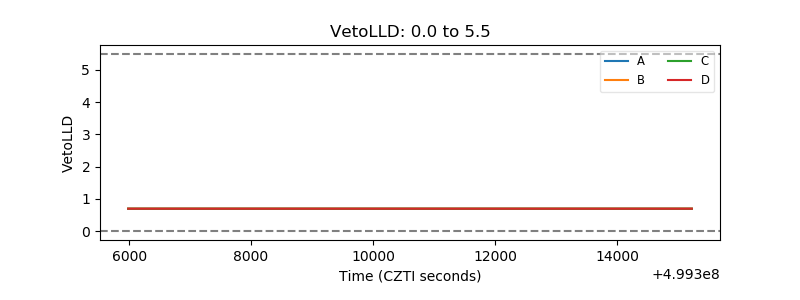 |
| Alpha Counter | 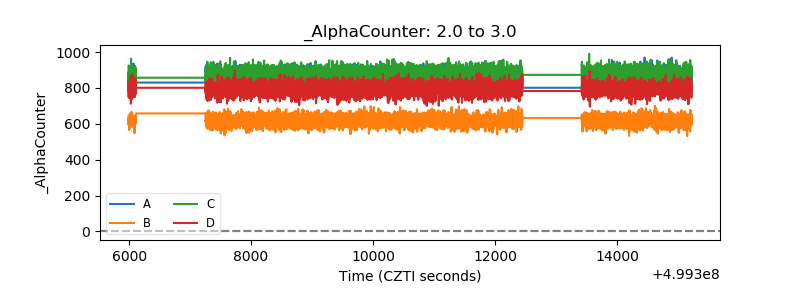 |
| _CPM_Rate | 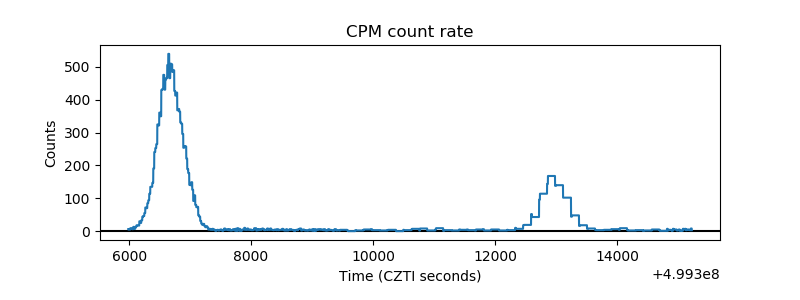 |
| CZT Counter | 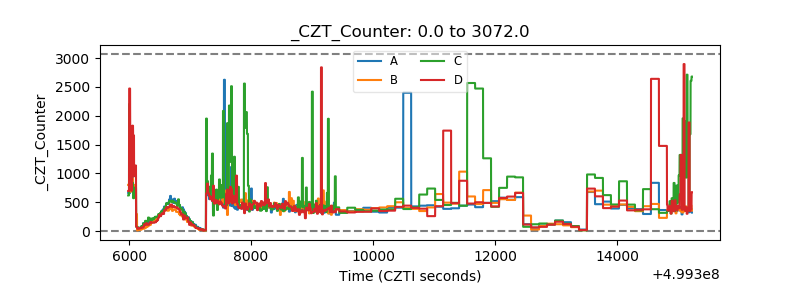 |
| +2.5 Volts monitor | 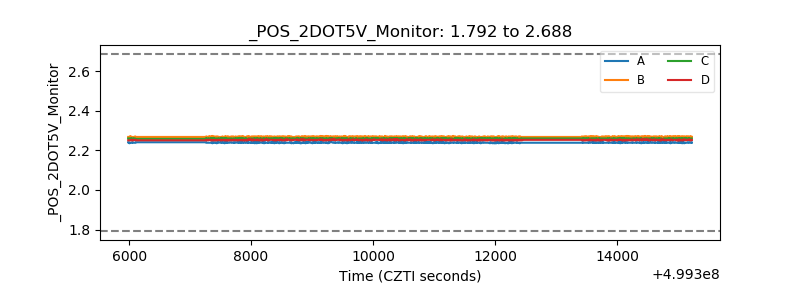 |
| +5 Volts monitor | 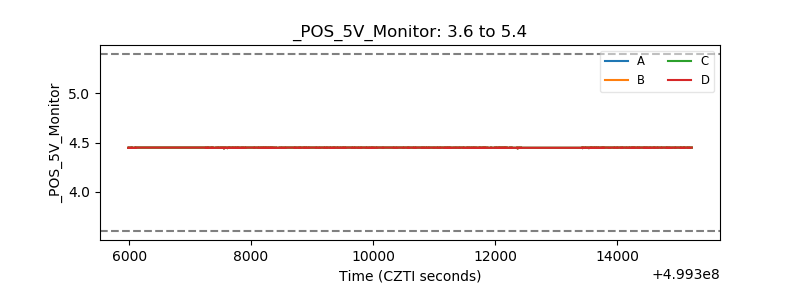 |
| _ROLL_ROT | 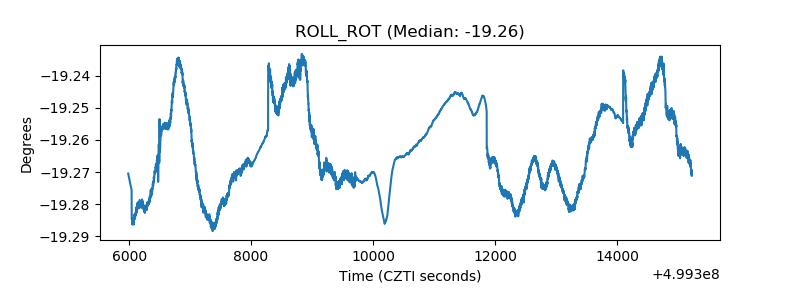 |
| _Roll_DEC | 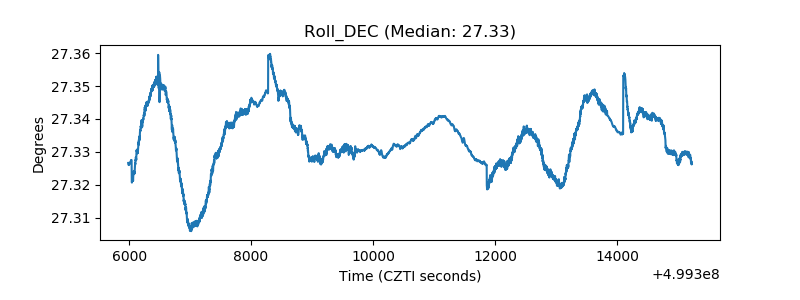 |
| _Roll_RA | 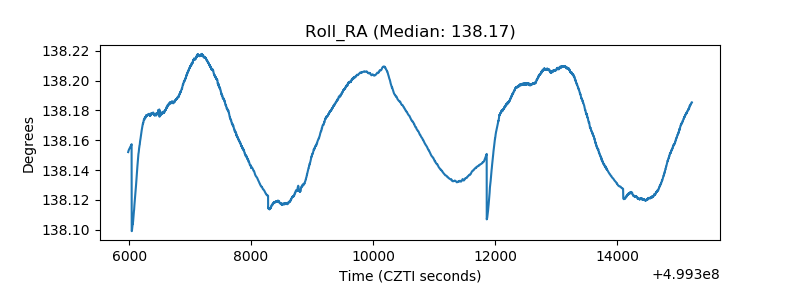 |
| Veto Counter | 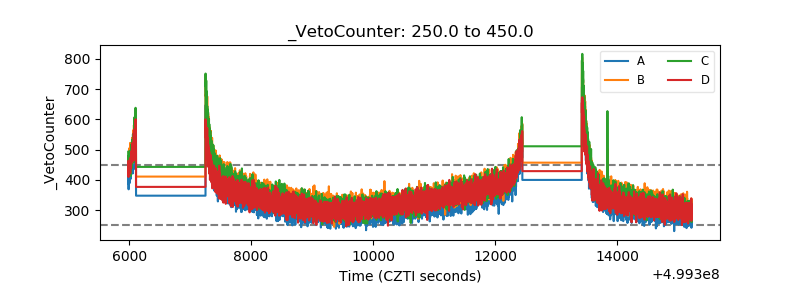 |