| Param | Original file | Final file |
|---|---|---|
| Filename | modeM0/AS1A14_127T09_9000006520_54548cztM0_level2.fits | modeM0/AS1A14_127T09_9000006520_54548cztM0_level2_quad_clean.evt |
| Size (bytes) | 464,993,280 | 110,623,680 |
| Size | 443.5 MB | 105.5 MB |
| Events in quadrant A | 3,516,605 | 731,747 |
| Events in quadrant B | 3,642,775 | 777,928 |
| Events in quadrant C | 4,903,655 | 671,897 |
| Events in quadrant D | 4,555,593 | 637,164 |
| Mode M0 | |||
|---|---|---|---|
| Quadrant | BADHDUFLAG | Total packets | Discarded packets |
| A | 0 | 16247 | 2 |
| B | 0 | 16583 | 2 |
| C | 0 | 20199 | 2 |
| D | 0 | 19196 | 3 |
| Mode SS | |||
|---|---|---|---|
| Quadrant | BADHDUFLAG | Total packets | Discarded packets |
| A | 0 | 156 | 0 |
| B | 0 | 156 | 0 |
| C | 0 | 156 | 0 |
| D | 0 | 156 | 0 |
| Mode M9 | |||
|---|---|---|---|
| Quadrant | BADHDUFLAG | Total packets | Discarded packets |
| A | 0 | 17 | 0 |
| B | 0 | 17 | 0 |
| C | 0 | 17 | 0 |
| D | 0 | 17 | 0 |
| Quadrant | Total seconds | Saturated seconds | Saturation percentage |
|---|---|---|---|
| A | 7636 | 59 | 0.772656% |
| B | 7636 | 122 | 1.597695% |
| C | 7637 | 338 | 4.425822% |
| D | 7636 | 241 | 3.156103% |
Noise dominated data is calculated using 1-second bins in cleaned event files. If a bin has >2000 counts, and if more than 50% of those come from <1% of pixels, then it is considered to be noise-dominated and hence unusable.
| Quadrant | # 1 sec bins | Bins with >0 counts | Bins with >2000 counts | High rate bins dominated by noise | Noise dominated (total time) | Noise dominated (detector-on time) | Marked lightcurve |
|---|---|---|---|---|---|---|---|
| A | 9277 | 7638 | 22 | 22 | 0.24% | 0.29% | 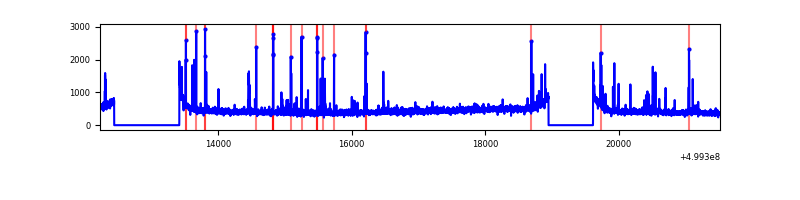 |
| B | 9277 | 7637 | 27 | 27 | 0.29% | 0.35% | 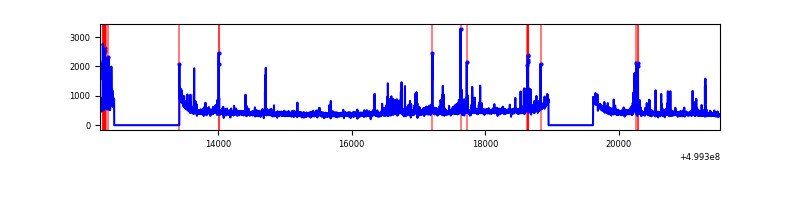 |
| C | 9278 | 7639 | 287 | 287 | 3.09% | 3.76% | 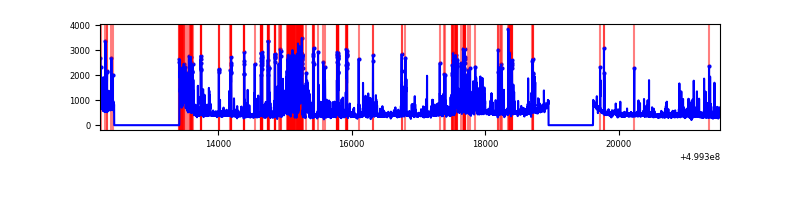 |
| D | 9277 | 7638 | 236 | 236 | 2.54% | 3.09% | 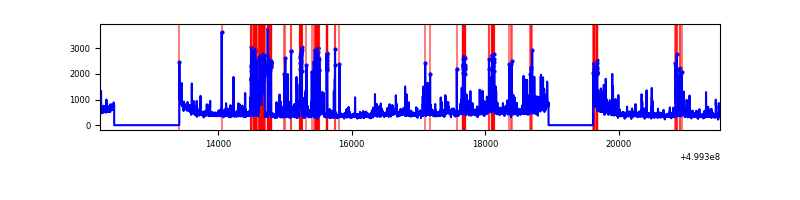 |
Top three noisy pixels from each quadrant. If the there are fewer than three noisy pixels in the level2.evt file, extra rows are filled as -1
| Pixel properties | Quadrant properties | ||||||
|---|---|---|---|---|---|---|---|
| Quadrant | DetID | PixID | Counts | Sigma | Mean | Median | Sigma |
| A | 11 | 3 | 150105 | 718.65 | 834 | 813 | 207.7 |
| A | 4 | 3 | 37370 | 175.97 | 834 | 813 | 207.7 |
| A | 3 | 14 | 25368 | 118.2 | 834 | 813 | 207.7 |
| B | 8 | 234 | 109168 | 606.89 | 827 | 797 | 178.6 |
| B | 0 | 213 | 94318 | 523.73 | 827 | 797 | 178.6 |
| B | 10 | 247 | 53514 | 295.22 | 827 | 797 | 178.6 |
| C | 12 | 254 | 965347 | 4402.11 | 799 | 792 | 219.1 |
| C | 13 | 3 | 195334 | 887.86 | 799 | 792 | 219.1 |
| C | 1 | 45 | 182407 | 828.87 | 799 | 792 | 219.1 |
| D | 10 | 181 | 475472 | 2098.66 | 795 | 760 | 226.2 |
| D | 8 | 160 | 310134 | 1367.72 | 795 | 760 | 226.2 |
| D | 6 | 239 | 287517 | 1267.73 | 795 | 760 | 226.2 |
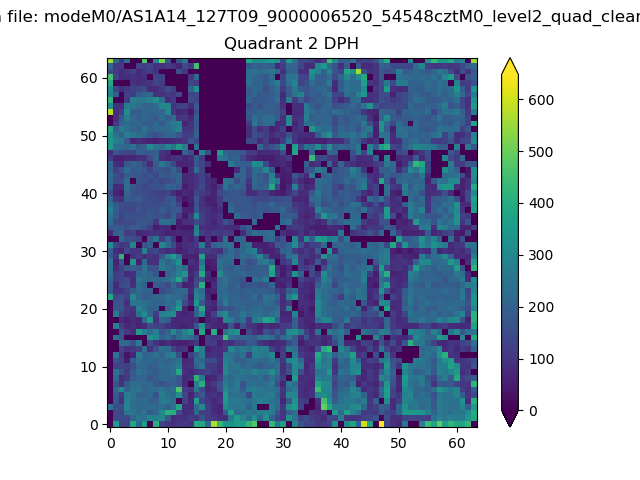
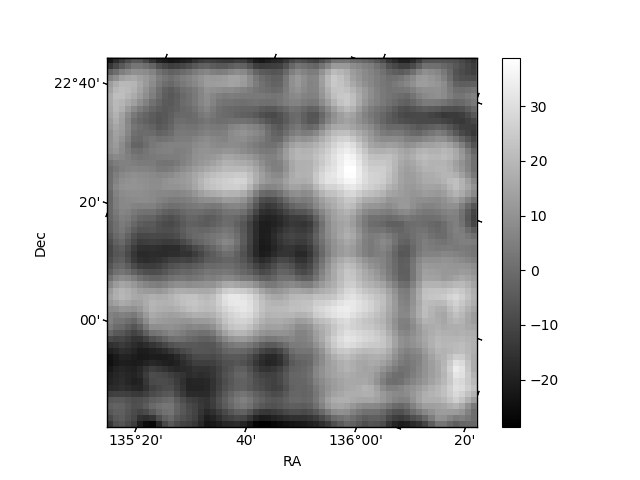
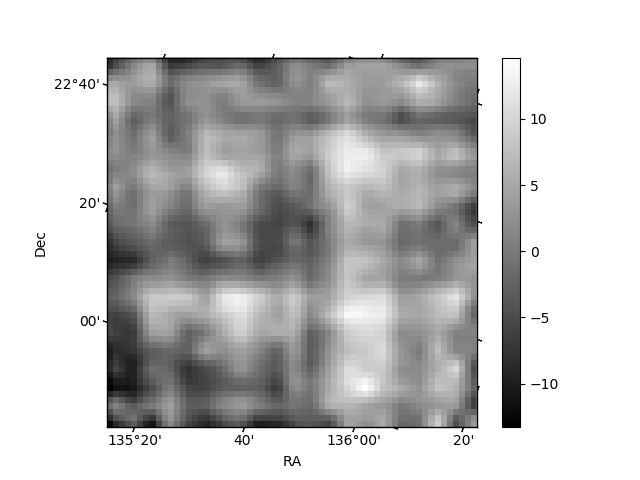
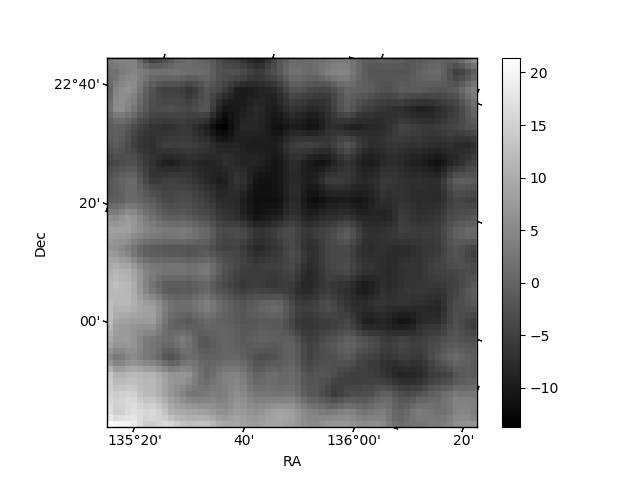
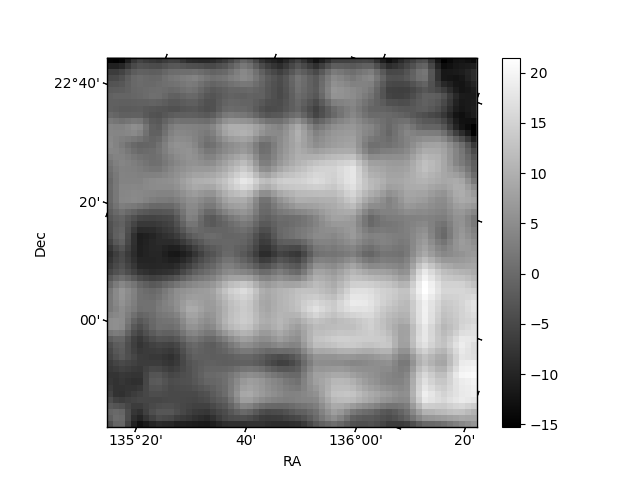
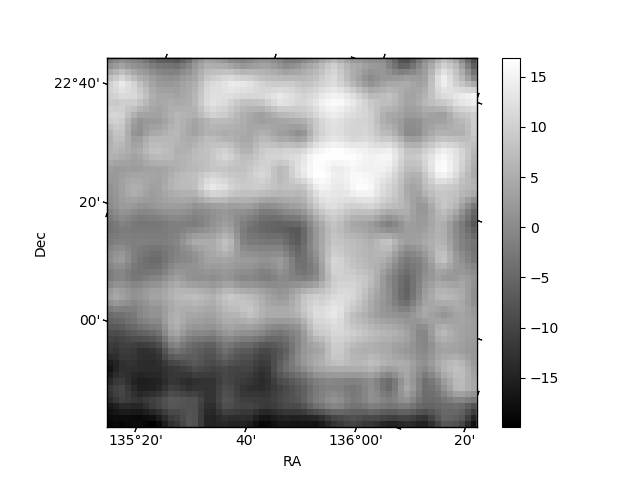
Histogram calculated using DETX and DETY for each event in the final _common_clean file
| Quadrant A | 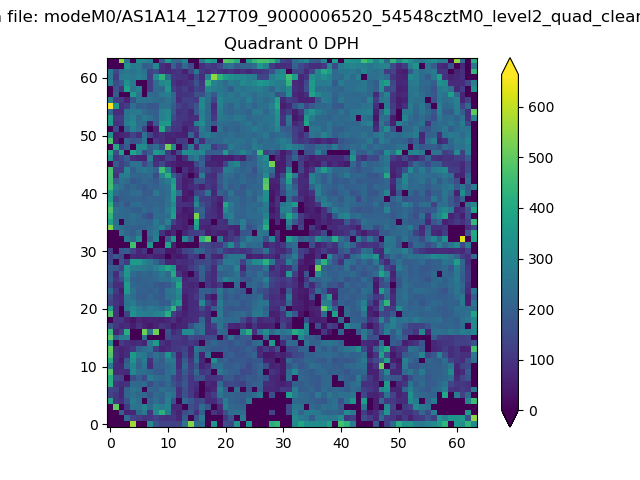 |
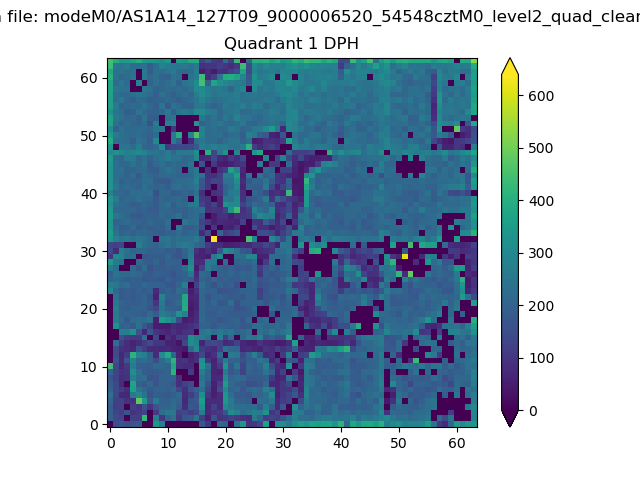 |
Quadrant B |
|---|---|---|---|
| Quadrant D | 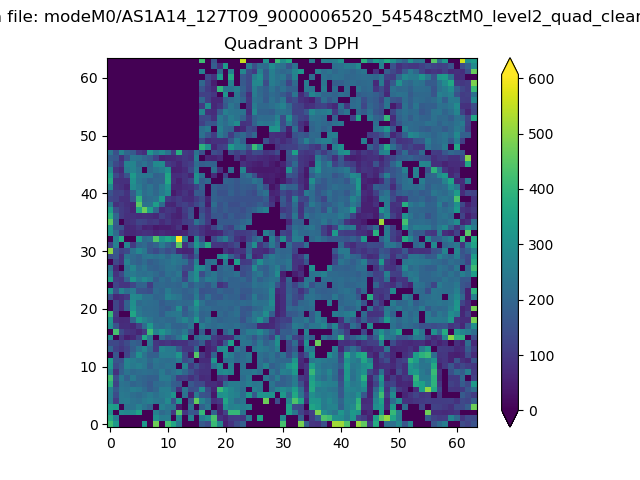 |
 |
Quadrant C |
| Plot type | Count rate plots | Images |
|---|---|---|
| Comparison with Poisson distribution Blue bars denote a histogram of data divided into 1 sec bins. Red curve is a Poisson curve with rate = median count rate of data. |
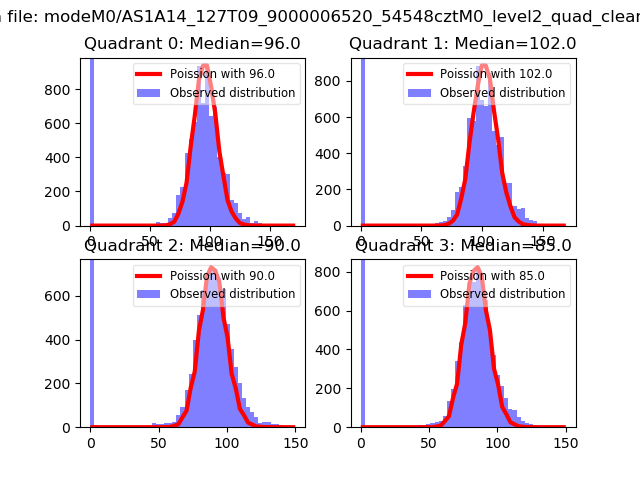 |
 |
| Quadrant-wise count rates Data is divided into 100 sec bins |
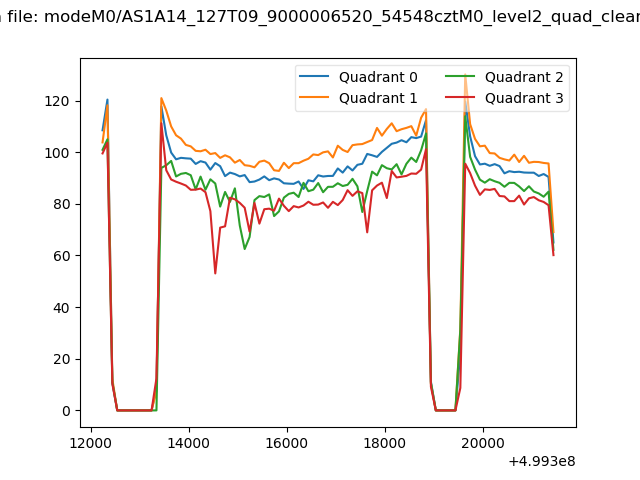 |
|
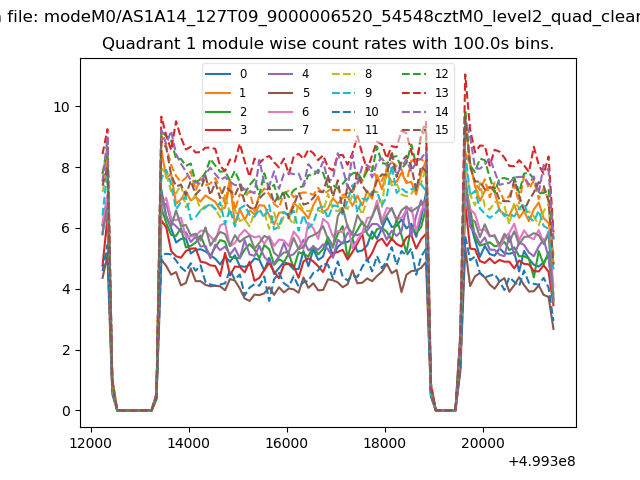
| Module-wise count rates for Quadrant A Data is divided into 100 sec bins |
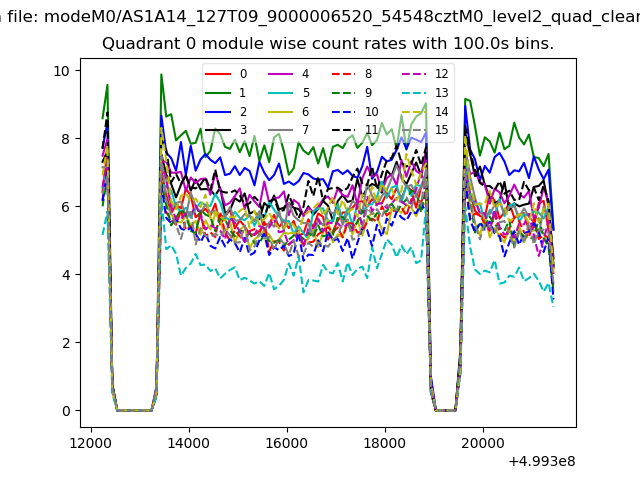 |
 |
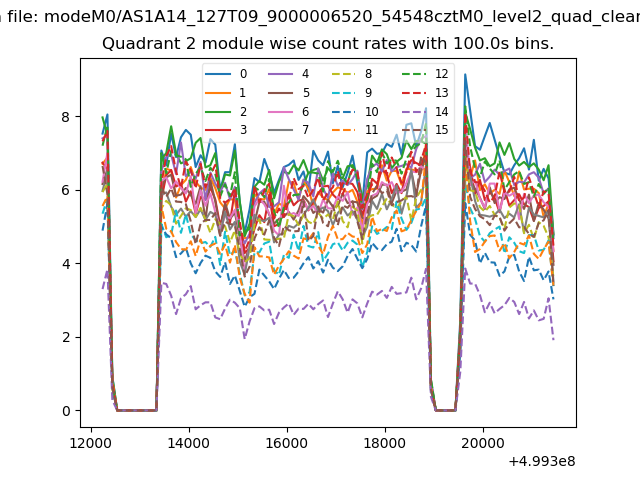
| Module-wise count rates for Quadrant B Data is divided into 100 sec bins |
 |
 |
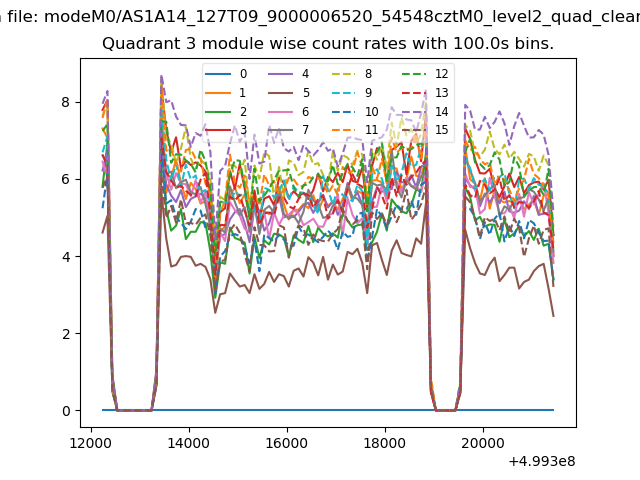
| Module-wise count rates for Quadrant C Data is divided into 100 sec bins |
 |
 |
| Module-wise count rates for Quadrant D Data is divided into 100 sec bins |
 |
 |
| Parameter | Plot |
|---|---|
| CZT HV Monitor | 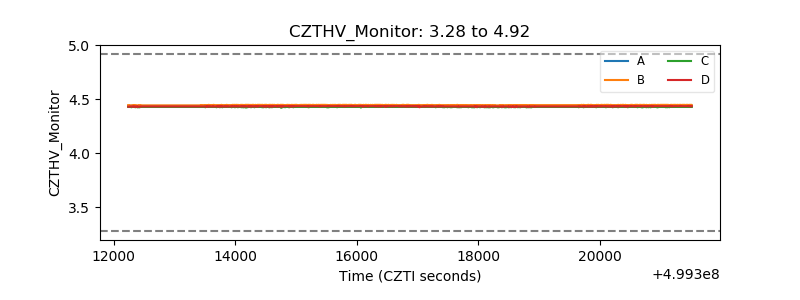 |
| D_VDD | 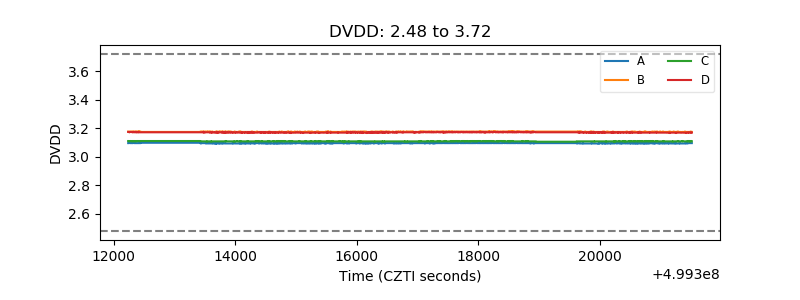 |
| Temperature 1 | 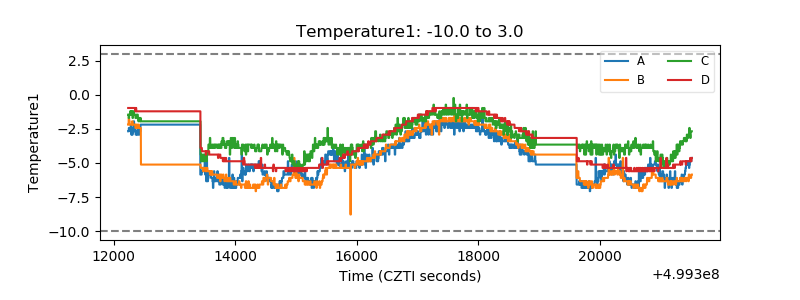 |
| Veto HV Monitor | 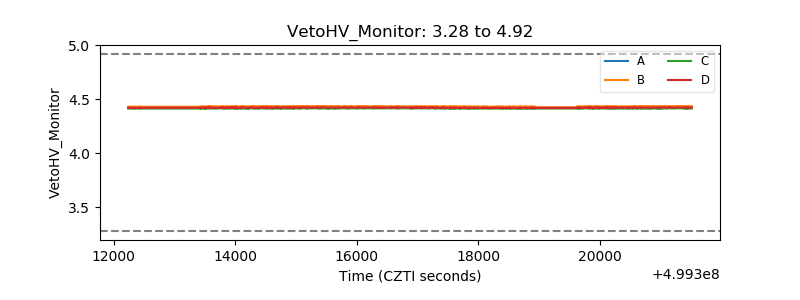 |
| Veto LLD | 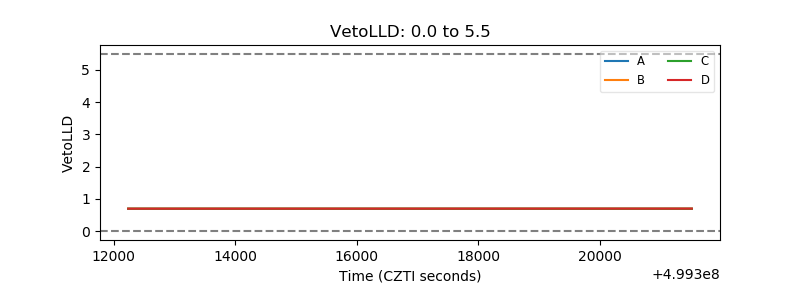 |
| Alpha Counter | 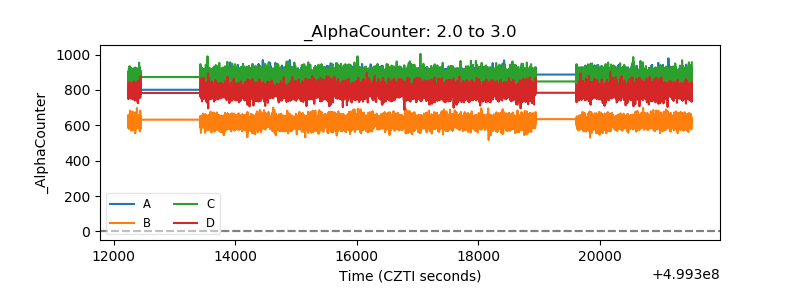 |
| _CPM_Rate | 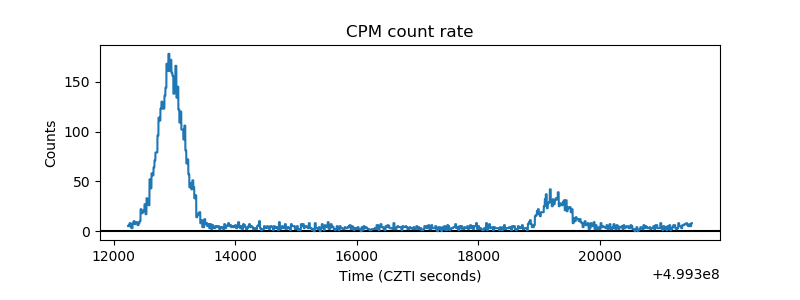 |
| CZT Counter | 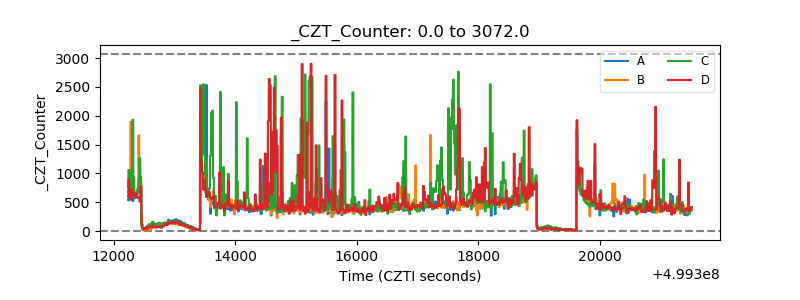 |
| +2.5 Volts monitor |  |
| +5 Volts monitor |  |
| _ROLL_ROT | 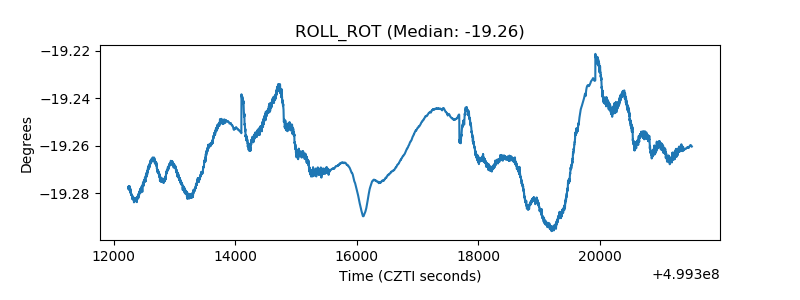 |
| _Roll_DEC | 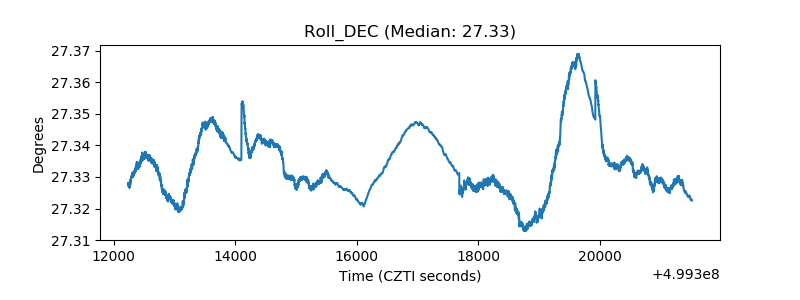 |
| _Roll_RA | 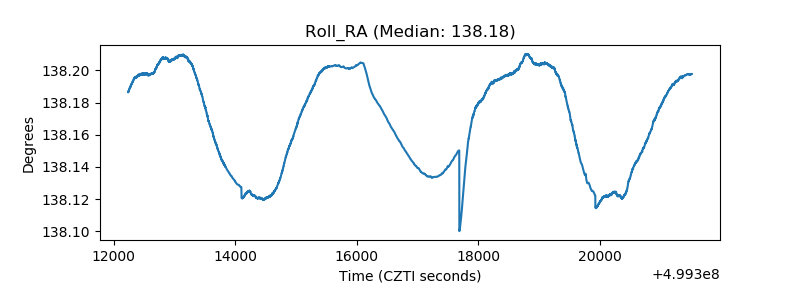 |
| Veto Counter | 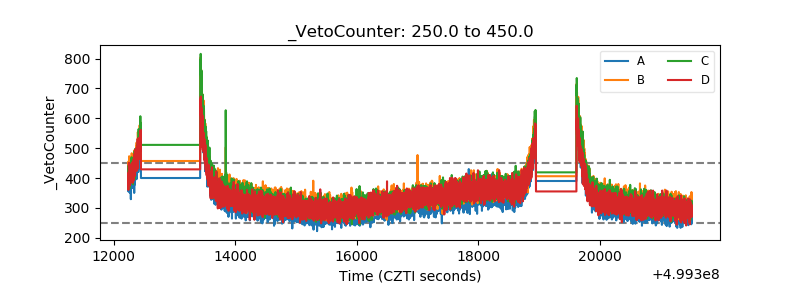 |