| Param | Original file | Final file |
|---|---|---|
| Filename | modeM0/AS1A14_127T09_9000006520_54549cztM0_level2.fits | modeM0/AS1A14_127T09_9000006520_54549cztM0_level2_quad_clean.evt |
| Size (bytes) | 529,634,880 | 117,074,880 |
| Size | 505.1 MB | 111.7 MB |
| Events in quadrant A | 3,879,103 | 772,635 |
| Events in quadrant B | 4,495,427 | 814,250 |
| Events in quadrant C | 5,231,987 | 719,182 |
| Events in quadrant D | 5,366,550 | 673,078 |
| Mode M0 | |||
|---|---|---|---|
| Quadrant | BADHDUFLAG | Total packets | Discarded packets |
| A | 0 | 17674 | 1 |
| B | 0 | 19305 | 1 |
| C | 0 | 21496 | 3 |
| D | 0 | 22009 | 1 |
| Mode SS | |||
|---|---|---|---|
| Quadrant | BADHDUFLAG | Total packets | Discarded packets |
| A | 0 | 164 | 0 |
| B | 0 | 164 | 0 |
| C | 0 | 166 | 0 |
| D | 0 | 166 | 0 |
| Mode M9 | |||
|---|---|---|---|
| Quadrant | BADHDUFLAG | Total packets | Discarded packets |
| A | 0 | 7 | 0 |
| B | 0 | 7 | 0 |
| C | 0 | 7 | 0 |
| D | 0 | 7 | 0 |
| Quadrant | Total seconds | Saturated seconds | Saturation percentage |
|---|---|---|---|
| A | 8141 | 80 | 0.982680% |
| B | 8141 | 245 | 3.009458% |
| C | 8140 | 322 | 3.955774% |
| D | 8141 | 313 | 3.844737% |
Noise dominated data is calculated using 1-second bins in cleaned event files. If a bin has >2000 counts, and if more than 50% of those come from <1% of pixels, then it is considered to be noise-dominated and hence unusable.
| Quadrant | # 1 sec bins | Bins with >0 counts | Bins with >2000 counts | High rate bins dominated by noise | Noise dominated (total time) | Noise dominated (detector-on time) | Marked lightcurve |
|---|---|---|---|---|---|---|---|
| A | 8807 | 8142 | 55 | 55 | 0.62% | 0.68% | 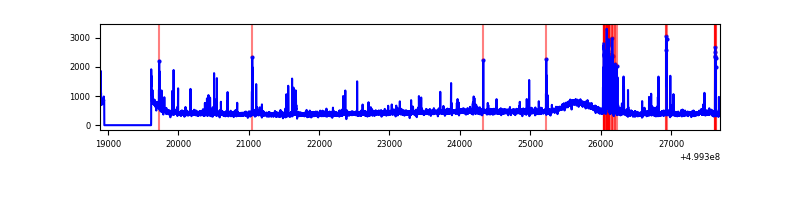 |
| B | 8807 | 8141 | 110 | 110 | 1.25% | 1.35% | 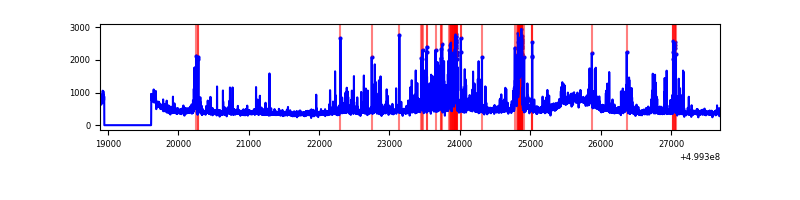 |
| C | 8806 | 8141 | 330 | 330 | 3.75% | 4.05% | 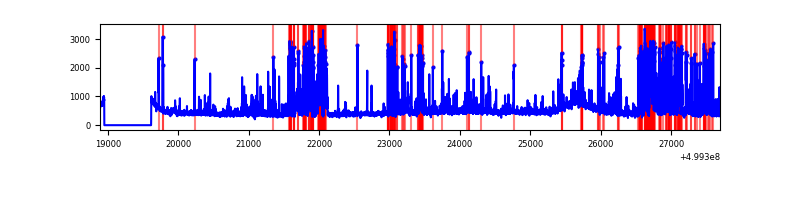 |
| D | 8807 | 8142 | 301 | 301 | 3.42% | 3.70% | 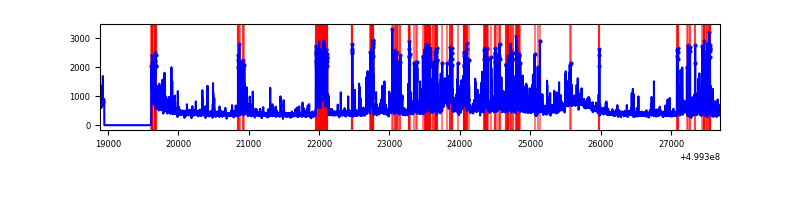 |
Top three noisy pixels from each quadrant. If the there are fewer than three noisy pixels in the level2.evt file, extra rows are filled as -1
| Pixel properties | Quadrant properties | ||||||
|---|---|---|---|---|---|---|---|
| Quadrant | DetID | PixID | Counts | Sigma | Mean | Median | Sigma |
| A | 4 | 249 | 144515 | 638.82 | 901 | 878 | 224.8 |
| A | 11 | 3 | 121424 | 536.12 | 901 | 878 | 224.8 |
| A | 4 | 3 | 35450 | 153.76 | 901 | 878 | 224.8 |
| B | 5 | 185 | 331960 | 1718.09 | 888 | 854 | 192.7 |
| B | 5 | 172 | 150723 | 777.66 | 888 | 854 | 192.7 |
| B | 0 | 213 | 127929 | 659.38 | 888 | 854 | 192.7 |
| C | 12 | 254 | 627075 | 2644.47 | 864 | 857 | 236.8 |
| C | 12 | 252 | 575737 | 2427.68 | 864 | 857 | 236.8 |
| C | 13 | 3 | 269740 | 1135.47 | 864 | 857 | 236.8 |
| D | 6 | 239 | 861191 | 3541.86 | 856 | 818 | 242.9 |
| D | 3 | 12 | 459395 | 1887.8 | 856 | 818 | 242.9 |
| D | 8 | 160 | 273717 | 1123.43 | 856 | 818 | 242.9 |
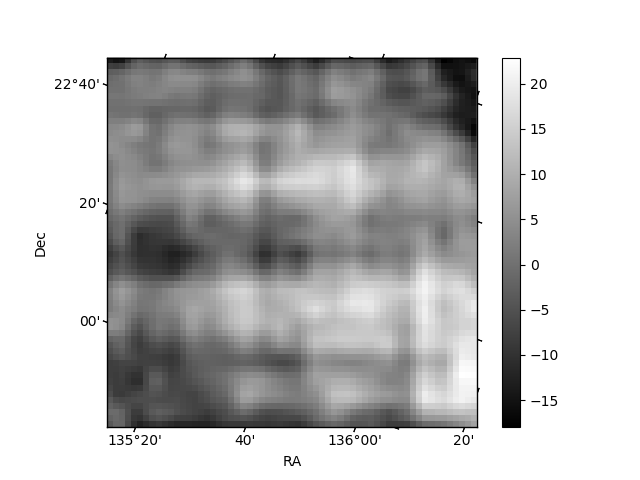
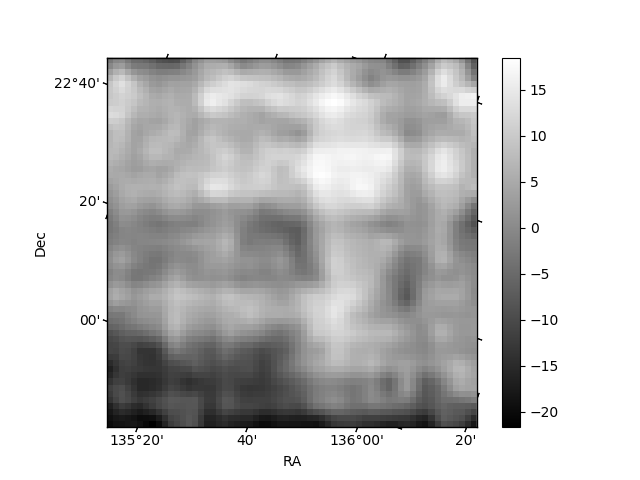
Histogram calculated using DETX and DETY for each event in the final _common_clean file
| Quadrant A | 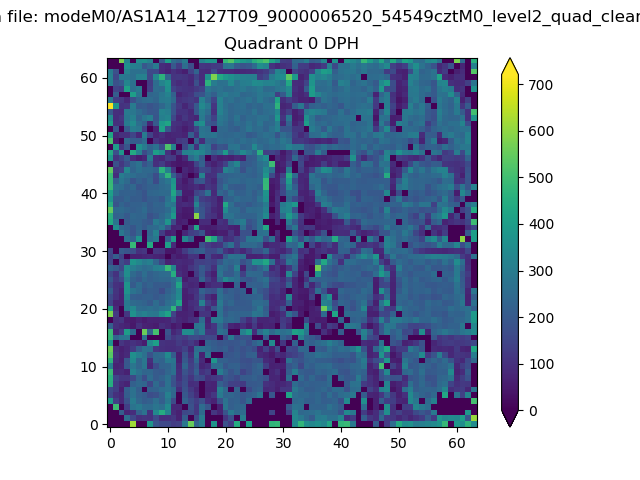 |
 |
Quadrant B |
|---|---|---|---|
| Quadrant D | 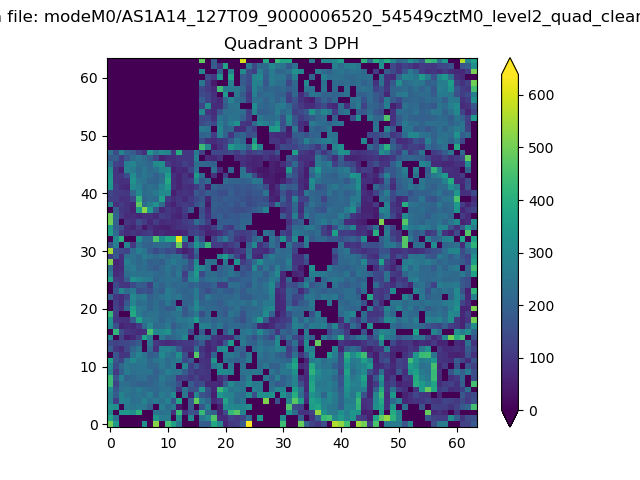 |
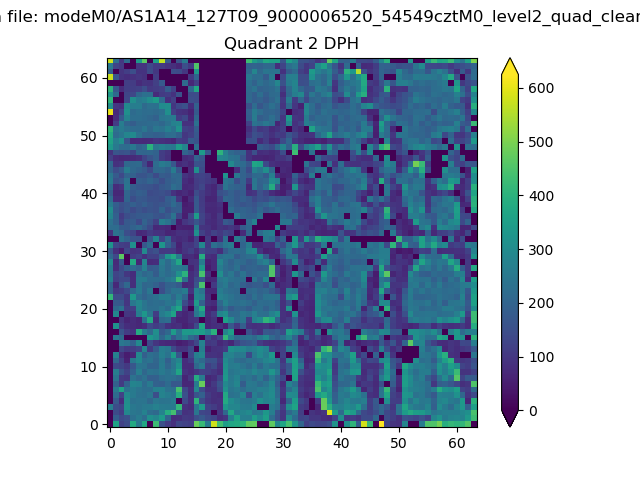 |
Quadrant C |
| Plot type | Count rate plots | Images |
|---|---|---|
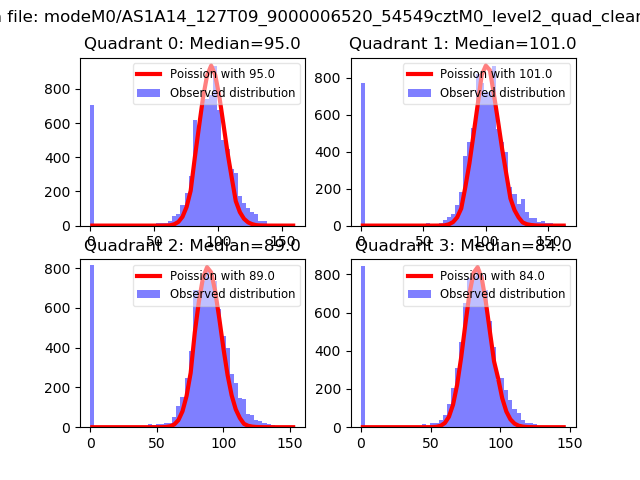
| Comparison with Poisson distribution Blue bars denote a histogram of data divided into 1 sec bins. Red curve is a Poisson curve with rate = median count rate of data. |
 |
 |
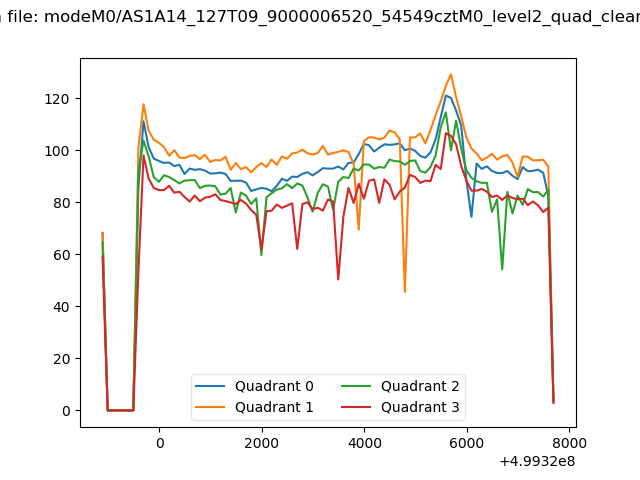
| Quadrant-wise count rates Data is divided into 100 sec bins |
 |
|
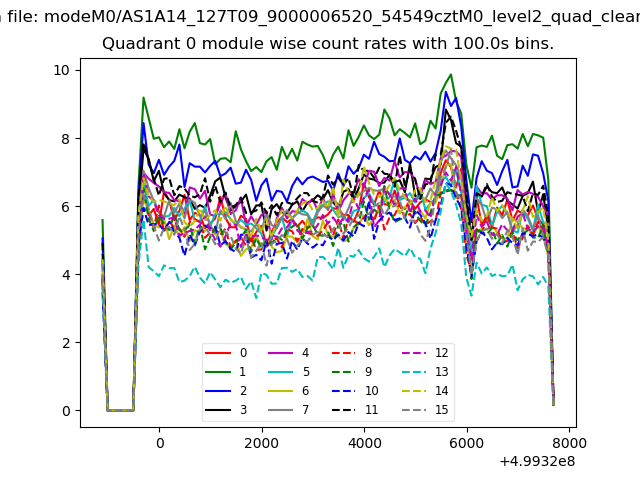
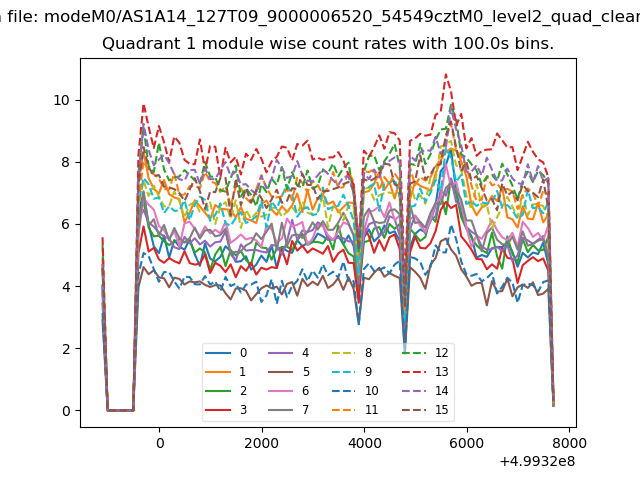
| Module-wise count rates for Quadrant A Data is divided into 100 sec bins |
 |
 |
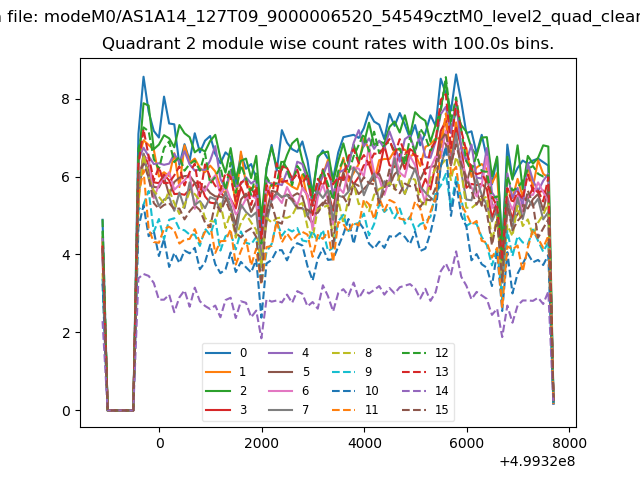
| Module-wise count rates for Quadrant B Data is divided into 100 sec bins |
 |
 |
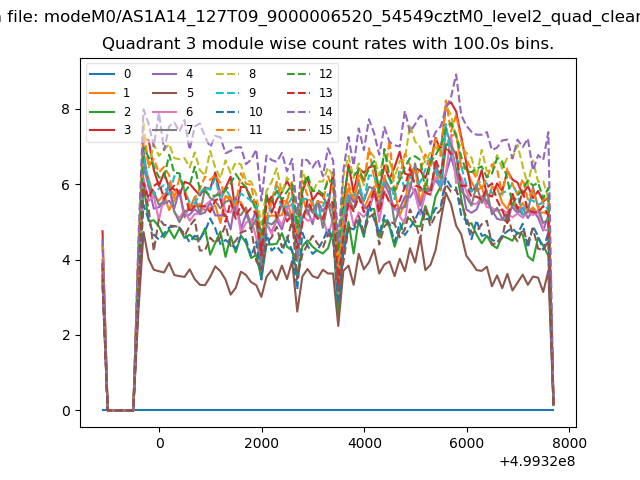
| Module-wise count rates for Quadrant C Data is divided into 100 sec bins |
 |
 |
| Module-wise count rates for Quadrant D Data is divided into 100 sec bins |
 |
 |
| Parameter | Plot |
|---|---|
| CZT HV Monitor | 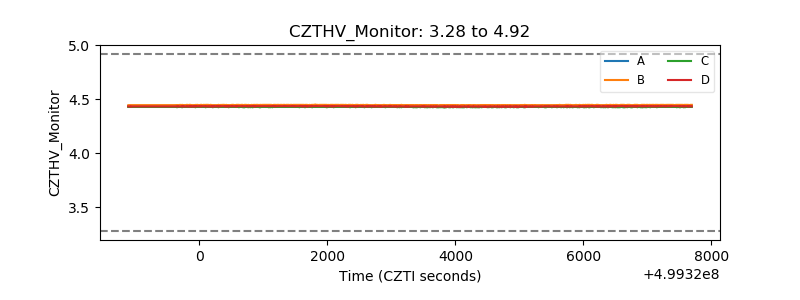 |
| D_VDD | 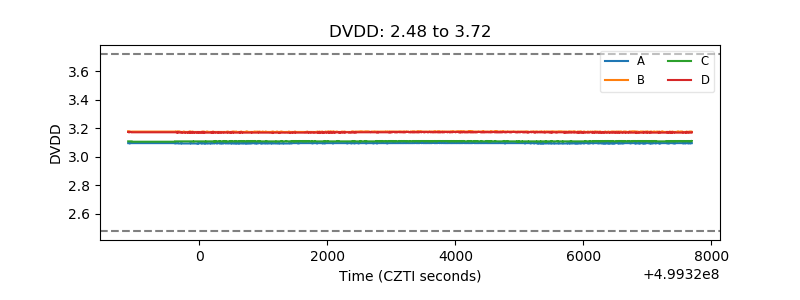 |
| Temperature 1 | 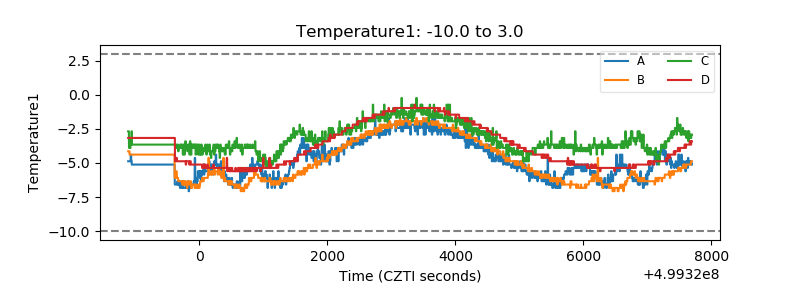 |
| Veto HV Monitor |  |
| Veto LLD | 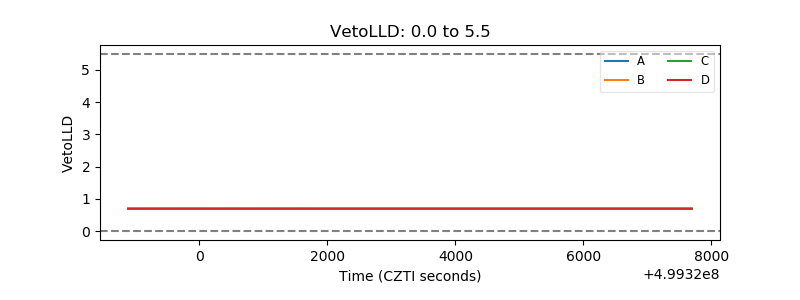 |
| Alpha Counter | 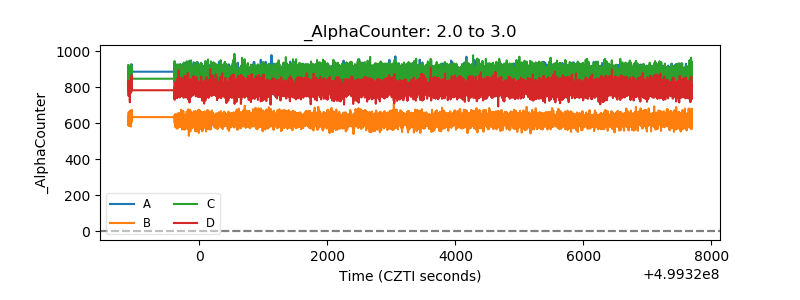 |
| _CPM_Rate | 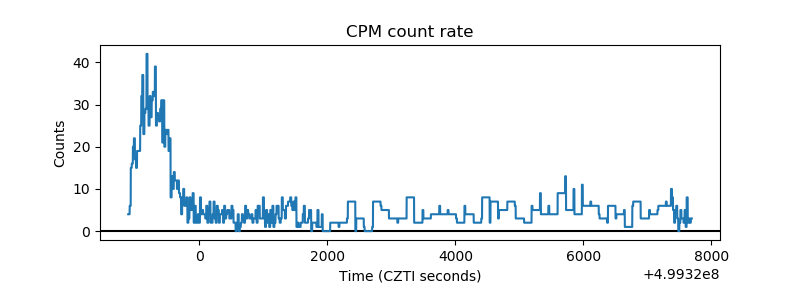 |
| CZT Counter | 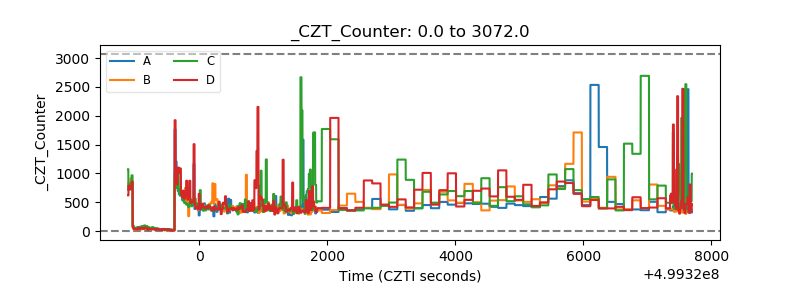 |
| +2.5 Volts monitor |  |
| +5 Volts monitor |  |
| _ROLL_ROT | 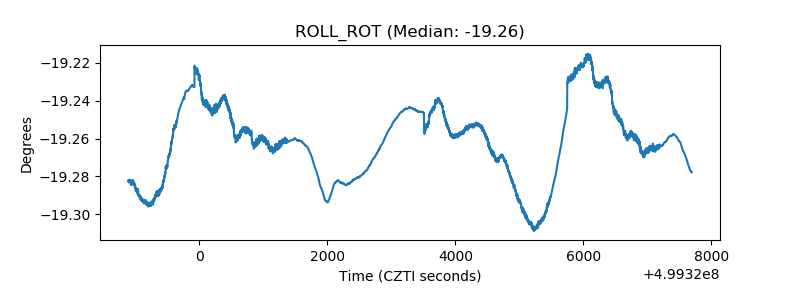 |
| _Roll_DEC | 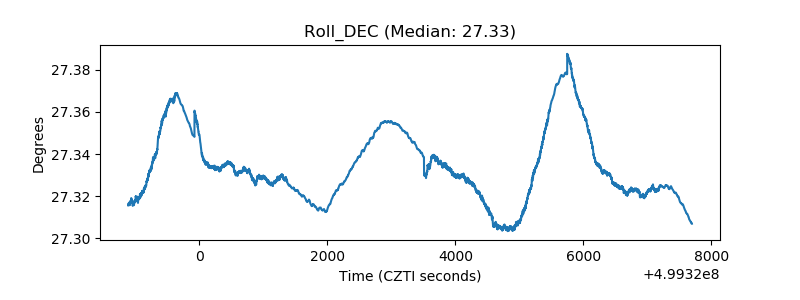 |
| _Roll_RA | 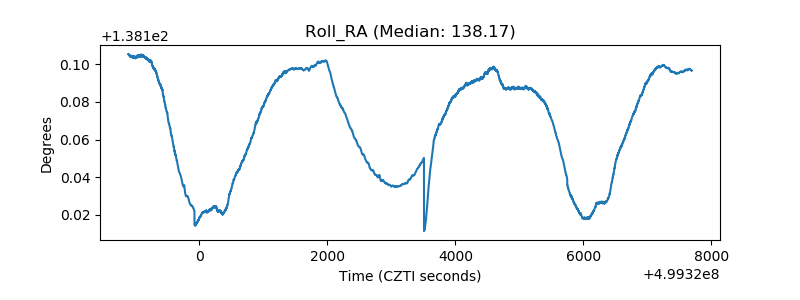 |
| Veto Counter | 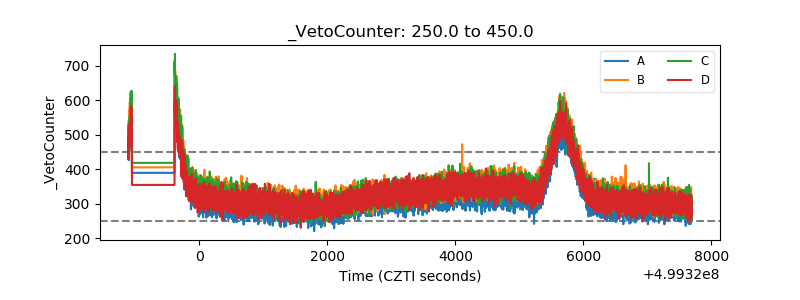 |