| Param | Original file | Final file |
|---|---|---|
| Filename | modeM0/AS1A14_127T09_9000006520_54550cztM0_level2.fits | modeM0/AS1A14_127T09_9000006520_54550cztM0_level2_quad_clean.evt |
| Size (bytes) | 697,772,160 | 112,187,520 |
| Size | 665.4 MB | 107.0 MB |
| Events in quadrant A | 4,326,260 | 778,519 |
| Events in quadrant B | 4,967,260 | 833,364 |
| Events in quadrant C | 10,784,394 | 512,938 |
| Events in quadrant D | 5,103,315 | 692,029 |
| Mode M0 | |||
|---|---|---|---|
| Quadrant | BADHDUFLAG | Total packets | Discarded packets |
| A | 0 | 19015 | 0 |
| B | 0 | 20725 | 0 |
| C | 0 | 37971 | 0 |
| D | 0 | 21168 | 0 |
| Mode SS | |||
|---|---|---|---|
| Quadrant | BADHDUFLAG | Total packets | Discarded packets |
| A | 0 | 166 | 0 |
| B | 0 | 166 | 0 |
| C | 0 | 166 | 0 |
| D | 0 | 166 | 0 |
| Quadrant | Total seconds | Saturated seconds | Saturation percentage |
|---|---|---|---|
| A | 8350 | 159 | 1.904192% |
| B | 8351 | 214 | 2.562567% |
| C | 8351 | 2775 | 33.229553% |
| D | 8351 | 211 | 2.526644% |
Noise dominated data is calculated using 1-second bins in cleaned event files. If a bin has >2000 counts, and if more than 50% of those come from <1% of pixels, then it is considered to be noise-dominated and hence unusable.
| Quadrant | # 1 sec bins | Bins with >0 counts | Bins with >2000 counts | High rate bins dominated by noise | Noise dominated (total time) | Noise dominated (detector-on time) | Marked lightcurve |
|---|---|---|---|---|---|---|---|
| A | 8350 | 8350 | 151 | 151 | 1.81% | 1.81% | 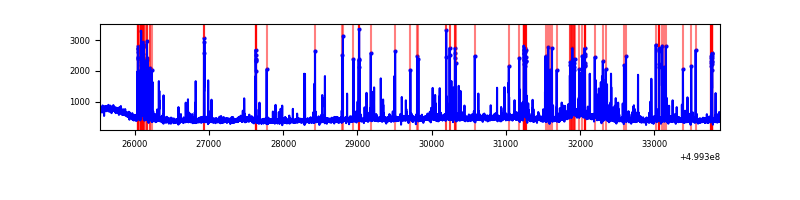 |
| B | 8351 | 8351 | 120 | 120 | 1.44% | 1.44% | 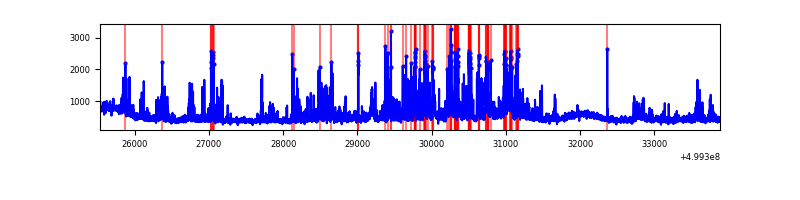 |
| C | 8351 | 8351 | 2614 | 2614 | 31.30% | 31.30% | 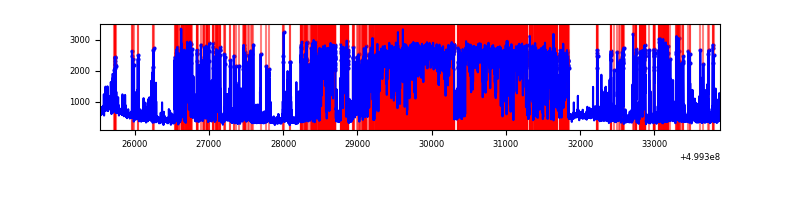 |
| D | 8351 | 8351 | 210 | 210 | 2.51% | 2.51% | 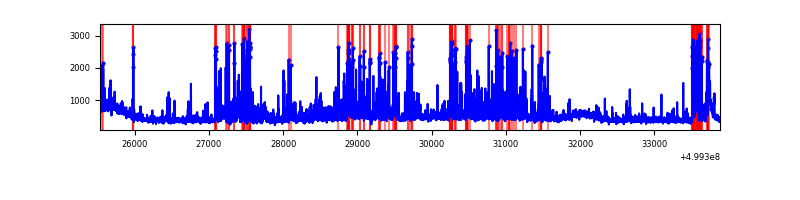 |
Top three noisy pixels from each quadrant. If the there are fewer than three noisy pixels in the level2.evt file, extra rows are filled as -1
| Pixel properties | Quadrant properties | ||||||
|---|---|---|---|---|---|---|---|
| Quadrant | DetID | PixID | Counts | Sigma | Mean | Median | Sigma |
| A | 11 | 3 | 363650 | 1612.76 | 906 | 880 | 224.9 |
| A | 4 | 249 | 194423 | 860.43 | 906 | 880 | 224.9 |
| A | 3 | 110 | 116005 | 511.81 | 906 | 880 | 224.9 |
| B | 8 | 234 | 653993 | 3358.81 | 899 | 867 | 194.5 |
| B | 10 | 14 | 280397 | 1437.53 | 899 | 867 | 194.5 |
| B | 0 | 213 | 152607 | 780.35 | 899 | 867 | 194.5 |
| C | 12 | 254 | 3799190 | 19226.46 | 719 | 714 | 197.6 |
| C | 4 | 5 | 2265722 | 11464.62 | 719 | 714 | 197.6 |
| C | 12 | 252 | 960541 | 4858.28 | 719 | 714 | 197.6 |
| D | 6 | 239 | 760445 | 3093.16 | 869 | 829 | 245.6 |
| D | 3 | 12 | 468355 | 1903.77 | 869 | 829 | 245.6 |
| D | 8 | 160 | 219942 | 892.23 | 869 | 829 | 245.6 |
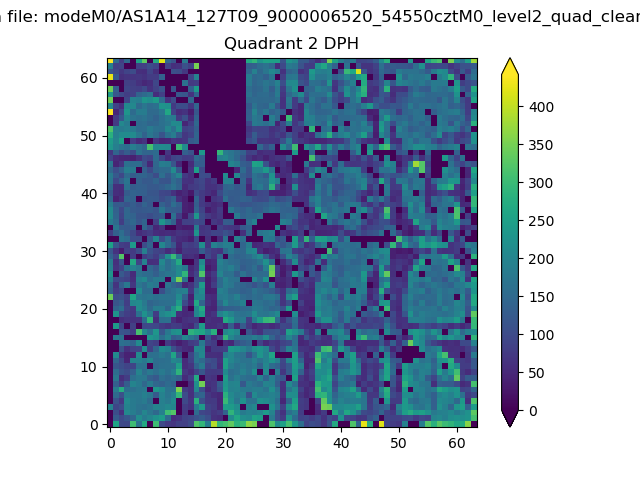
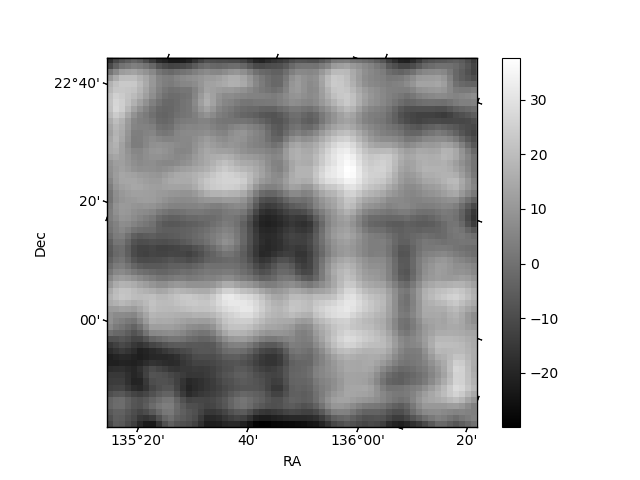
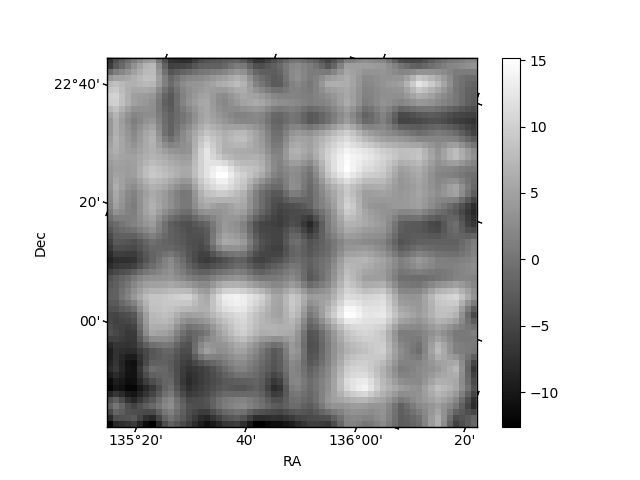
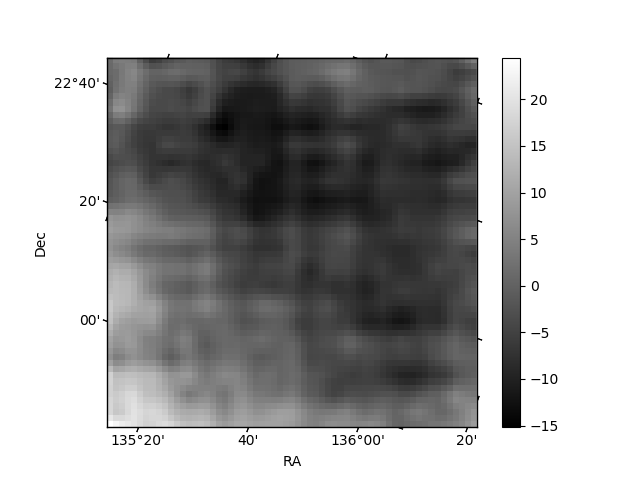
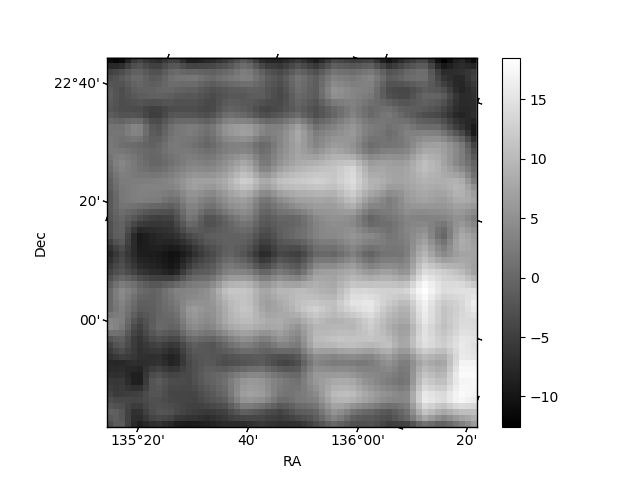
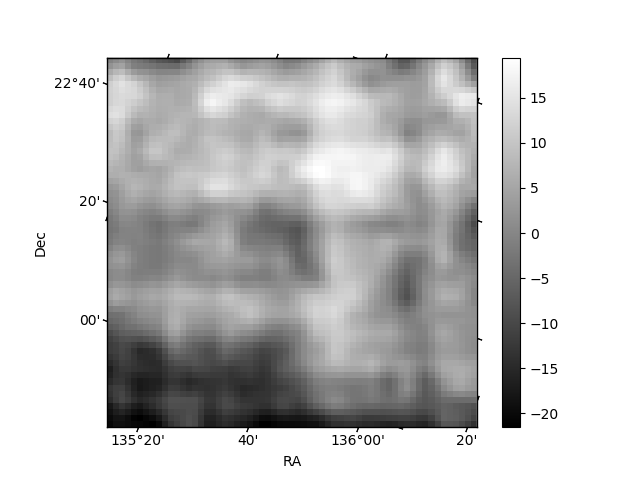
Histogram calculated using DETX and DETY for each event in the final _common_clean file
| Quadrant A | 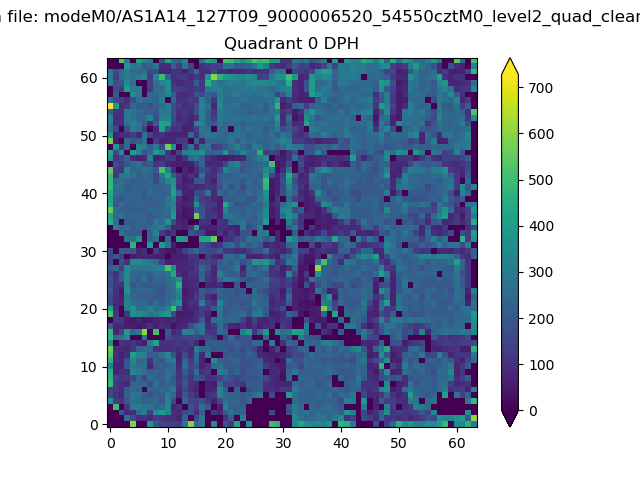 |
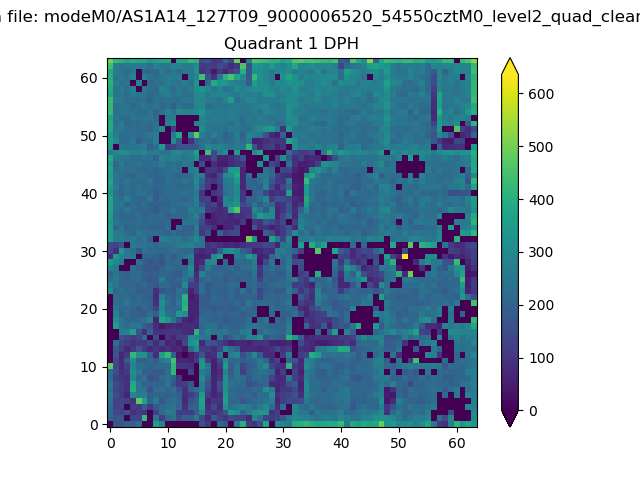 |
Quadrant B |
|---|---|---|---|
| Quadrant D | 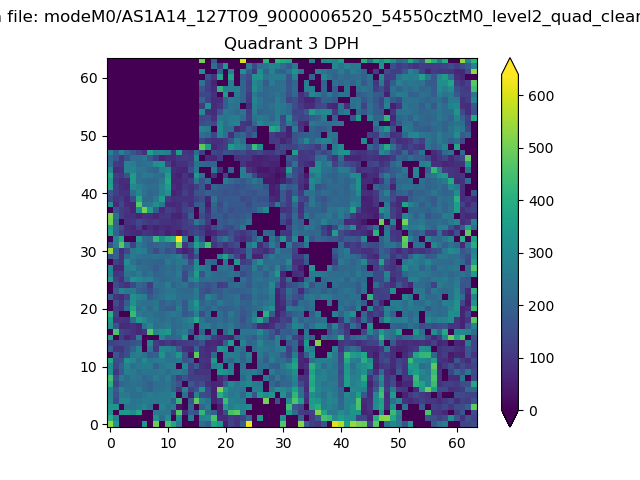 |
 |
Quadrant C |
| Plot type | Count rate plots | Images |
|---|---|---|
| Comparison with Poisson distribution Blue bars denote a histogram of data divided into 1 sec bins. Red curve is a Poisson curve with rate = median count rate of data. |
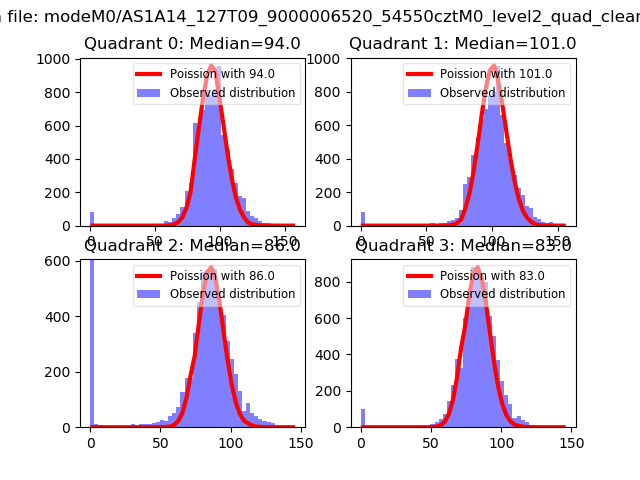 |
 |
| Quadrant-wise count rates Data is divided into 100 sec bins |
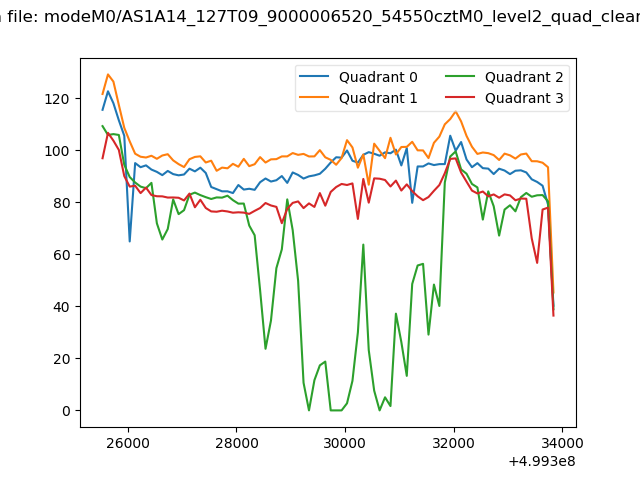 |
|
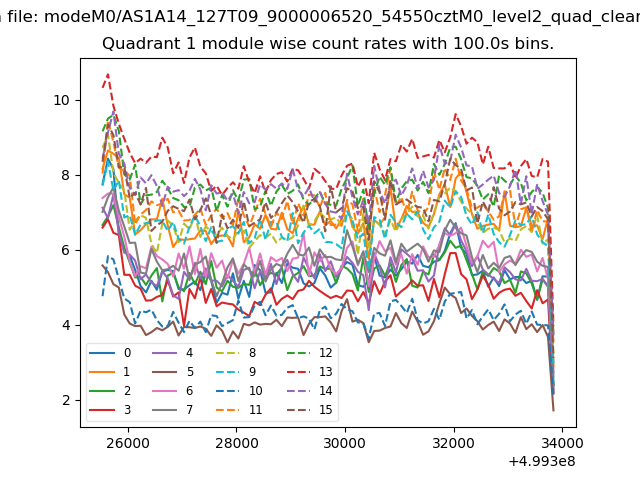
| Module-wise count rates for Quadrant A Data is divided into 100 sec bins |
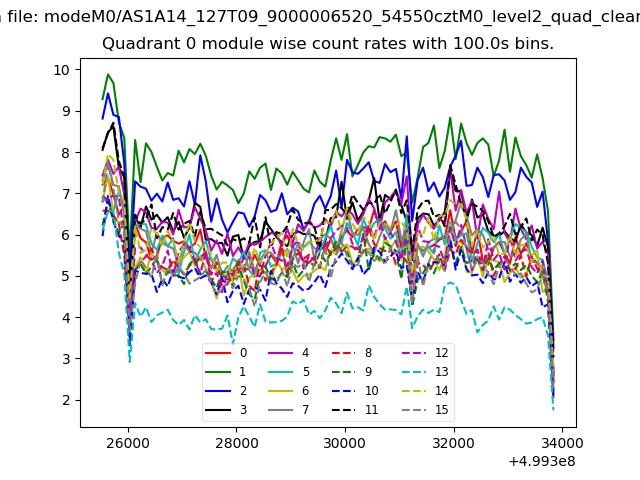 |
 |
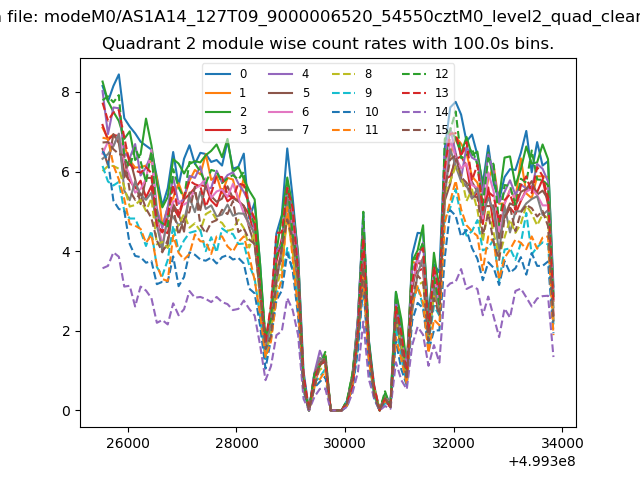
| Module-wise count rates for Quadrant B Data is divided into 100 sec bins |
 |
 |
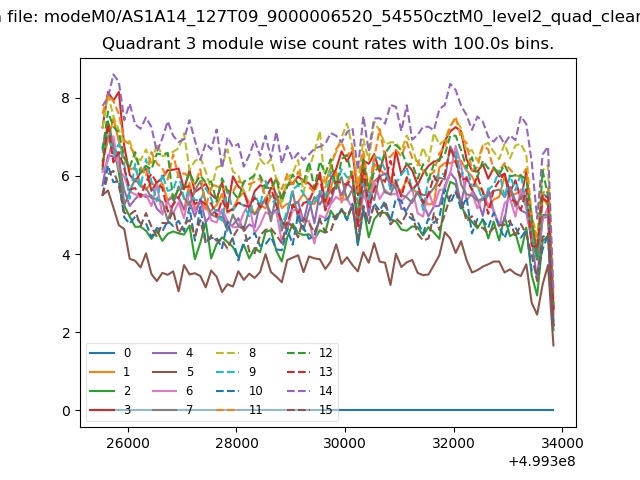
| Module-wise count rates for Quadrant C Data is divided into 100 sec bins |
 |
 |
| Module-wise count rates for Quadrant D Data is divided into 100 sec bins |
 |
 |
| Parameter | Plot |
|---|---|
| CZT HV Monitor | 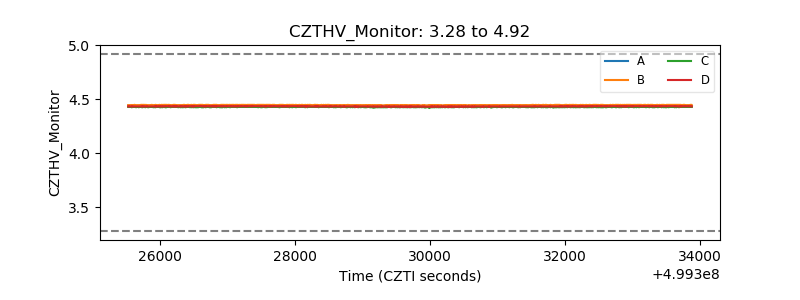 |
| D_VDD | 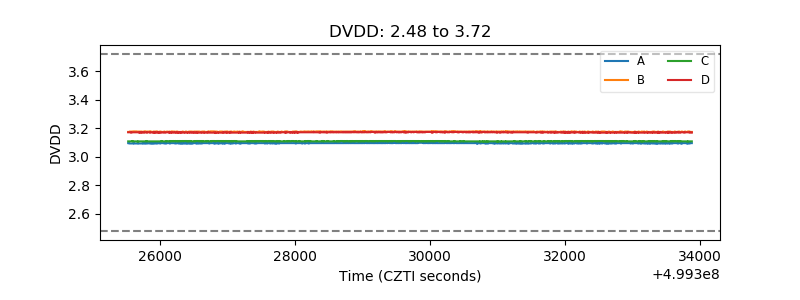 |
| Temperature 1 | 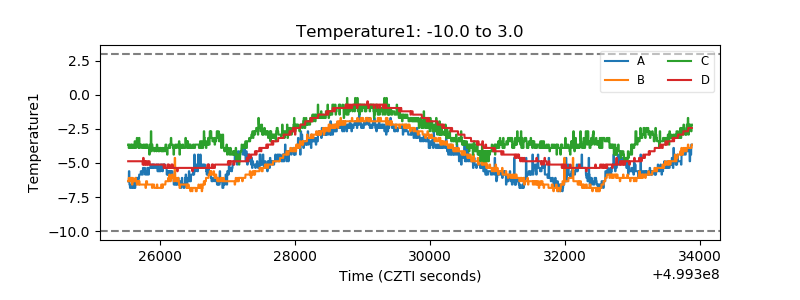 |
| Veto HV Monitor |  |
| Veto LLD | 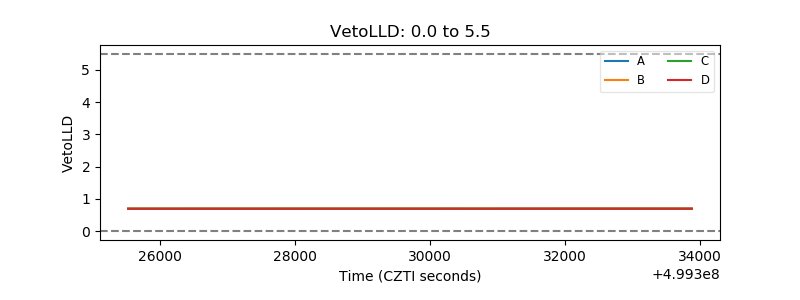 |
| Alpha Counter | 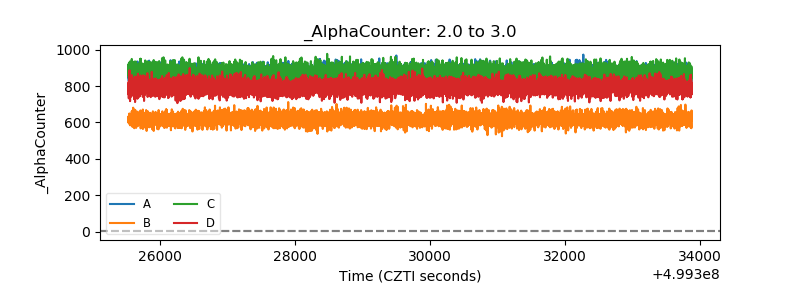 |
| _CPM_Rate | 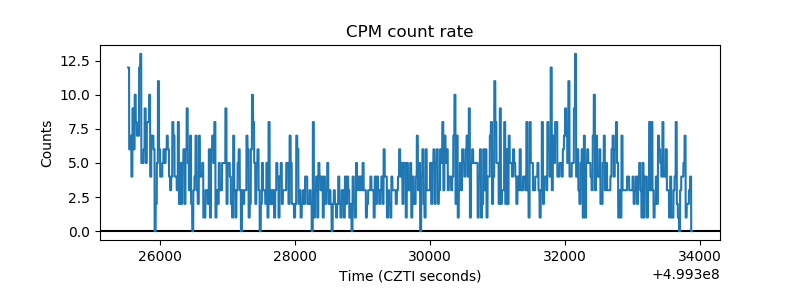 |
| CZT Counter | 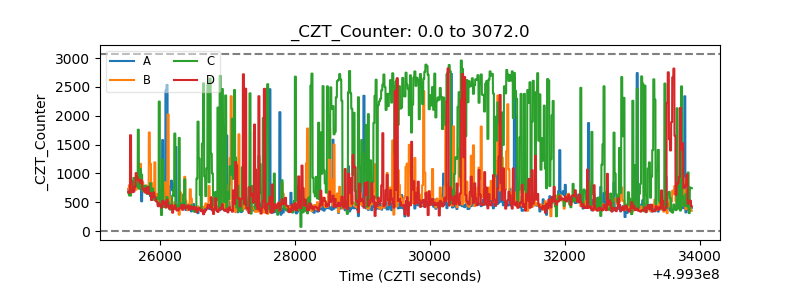 |
| +2.5 Volts monitor |  |
| +5 Volts monitor |  |
| _ROLL_ROT | 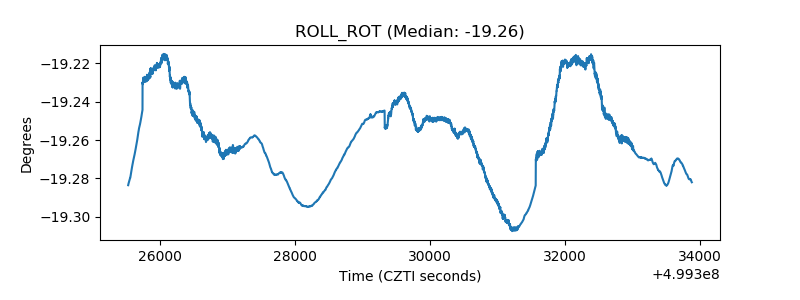 |
| _Roll_DEC | 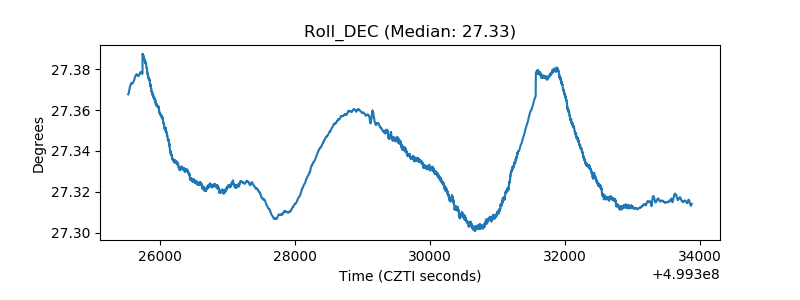 |
| _Roll_RA | 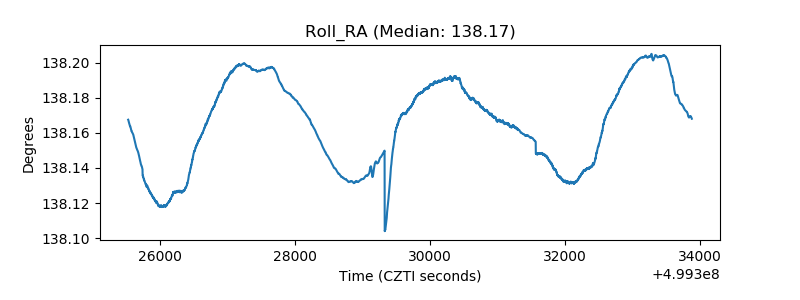 |
| Veto Counter | 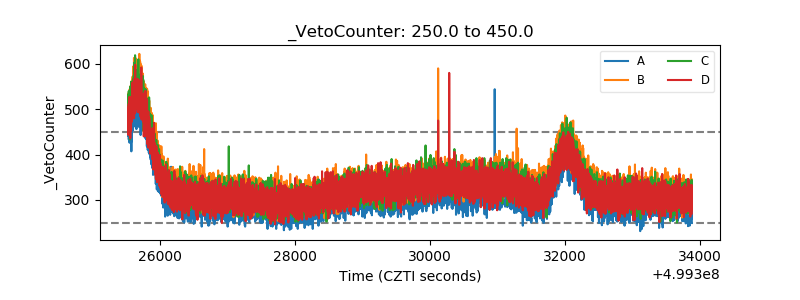 |