| Param | Original file | Final file |
|---|---|---|
| Filename | modeM0/AS1A14_127T09_9000006520_54551cztM0_level2.fits | modeM0/AS1A14_127T09_9000006520_54551cztM0_level2_quad_clean.evt |
| Size (bytes) | 559,031,040 | 107,052,480 |
| Size | 533.1 MB | 102.1 MB |
| Events in quadrant A | 3,854,023 | 711,938 |
| Events in quadrant B | 4,066,878 | 763,838 |
| Events in quadrant C | 7,357,214 | 602,824 |
| Events in quadrant D | 4,817,665 | 627,010 |
| Mode M0 | |||
|---|---|---|---|
| Quadrant | BADHDUFLAG | Total packets | Discarded packets |
| A | 0 | 17188 | 0 |
| B | 0 | 17584 | 0 |
| C | 0 | 27381 | 0 |
| D | 0 | 19911 | 0 |
| Mode SS | |||
|---|---|---|---|
| Quadrant | BADHDUFLAG | Total packets | Discarded packets |
| A | 0 | 154 | 0 |
| B | 0 | 154 | 0 |
| C | 0 | 154 | 0 |
| D | 0 | 154 | 0 |
| Quadrant | Total seconds | Saturated seconds | Saturation percentage |
|---|---|---|---|
| A | 7700 | 106 | 1.376623% |
| B | 7701 | 75 | 0.973899% |
| C | 7701 | 1096 | 14.231918% |
| D | 7701 | 194 | 2.519153% |
Noise dominated data is calculated using 1-second bins in cleaned event files. If a bin has >2000 counts, and if more than 50% of those come from <1% of pixels, then it is considered to be noise-dominated and hence unusable.
| Quadrant | # 1 sec bins | Bins with >0 counts | Bins with >2000 counts | High rate bins dominated by noise | Noise dominated (total time) | Noise dominated (detector-on time) | Marked lightcurve |
|---|---|---|---|---|---|---|---|
| A | 7700 | 7700 | 111 | 111 | 1.44% | 1.44% |  |
| B | 7701 | 7701 | 38 | 38 | 0.49% | 0.49% |  |
| C | 7701 | 7701 | 1120 | 1120 | 14.54% | 14.54% | 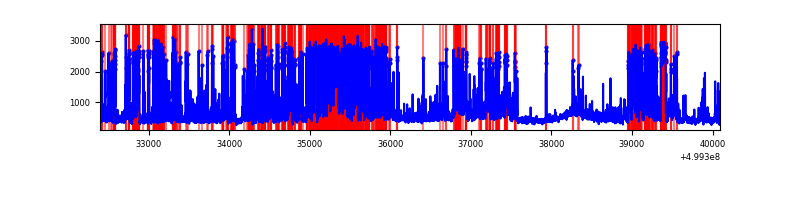 |
| D | 7701 | 7701 | 221 | 221 | 2.87% | 2.87% | 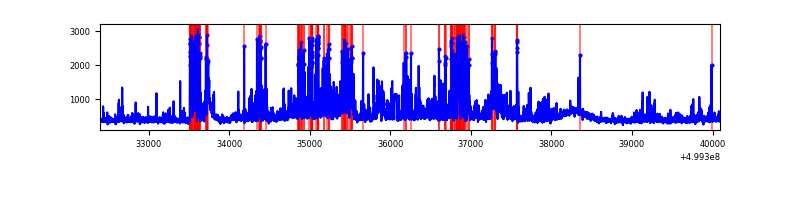 |
Top three noisy pixels from each quadrant. If the there are fewer than three noisy pixels in the level2.evt file, extra rows are filled as -1
| Pixel properties | Quadrant properties | ||||||
|---|---|---|---|---|---|---|---|
| Quadrant | DetID | PixID | Counts | Sigma | Mean | Median | Sigma |
| A | 11 | 3 | 470296 | 2314.36 | 816 | 797 | 202.9 |
| A | 3 | 110 | 65799 | 320.42 | 816 | 797 | 202.9 |
| A | 4 | 249 | 44618 | 216.01 | 816 | 797 | 202.9 |
| B | 8 | 234 | 384257 | 2198.65 | 809 | 780 | 174.4 |
| B | 0 | 213 | 190308 | 1086.65 | 809 | 780 | 174.4 |
| B | 10 | 14 | 93917 | 534.0 | 809 | 780 | 174.4 |
| C | 12 | 252 | 1887398 | 9320.35 | 741 | 735 | 202.4 |
| C | 12 | 254 | 1467296 | 7244.99 | 741 | 735 | 202.4 |
| C | 13 | 3 | 399387 | 1969.39 | 741 | 735 | 202.4 |
| D | 3 | 12 | 636962 | 2885.91 | 781 | 749 | 220.5 |
| D | 6 | 239 | 503342 | 2279.8 | 781 | 749 | 220.5 |
| D | 6 | 42 | 173321 | 782.8 | 781 | 749 | 220.5 |
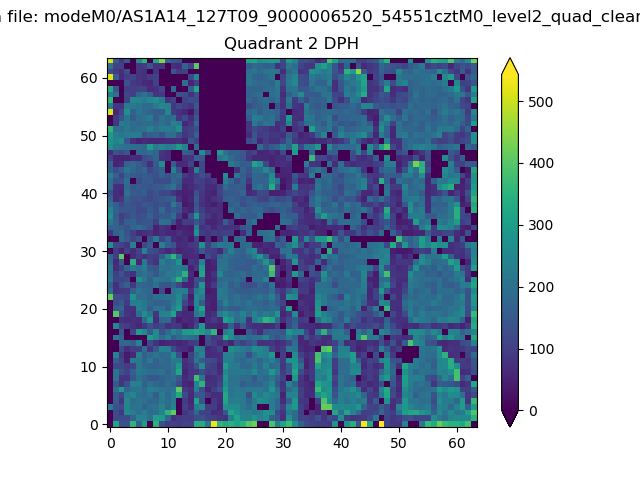
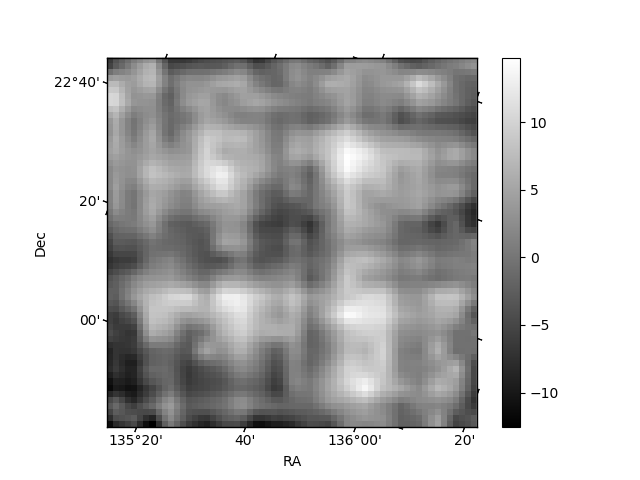
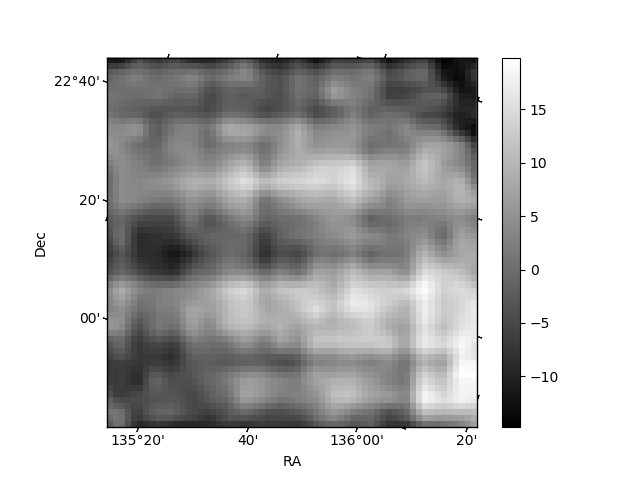
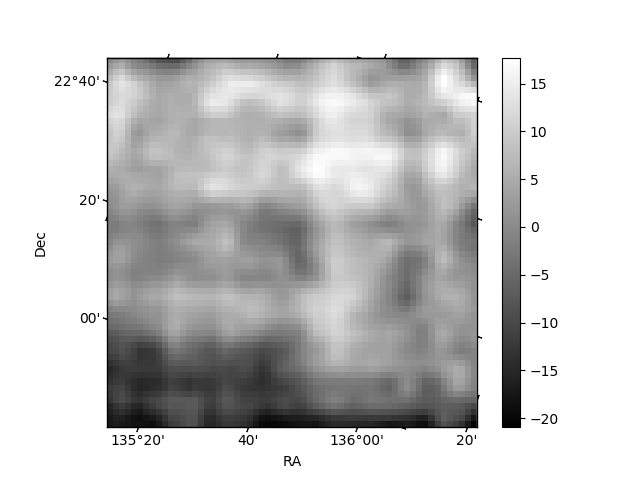
Histogram calculated using DETX and DETY for each event in the final _common_clean file
| Quadrant A | 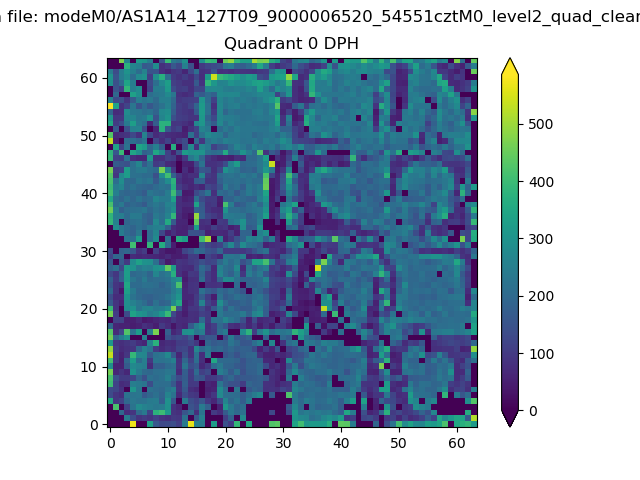 |
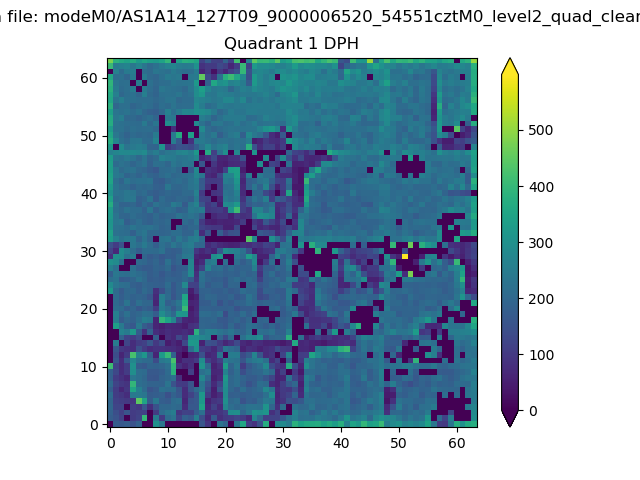 |
Quadrant B |
|---|---|---|---|
| Quadrant D | 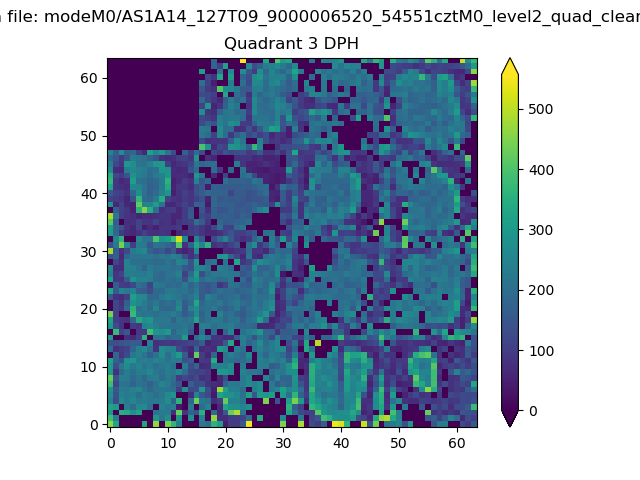 |
 |
Quadrant C |
| Plot type | Count rate plots | Images |
|---|---|---|
| Comparison with Poisson distribution Blue bars denote a histogram of data divided into 1 sec bins. Red curve is a Poisson curve with rate = median count rate of data. |
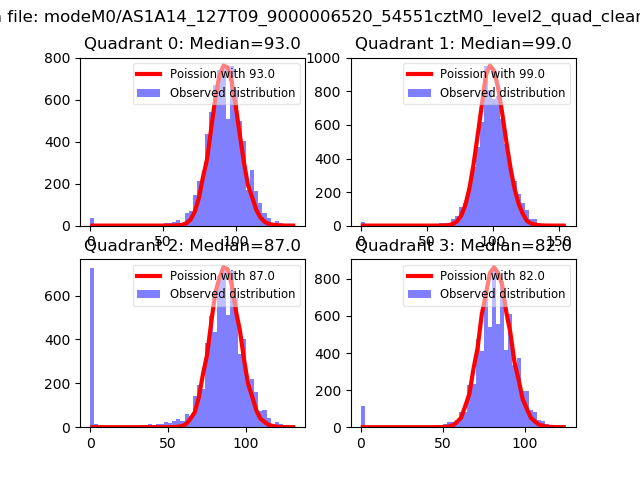 |
 |
| Quadrant-wise count rates Data is divided into 100 sec bins |
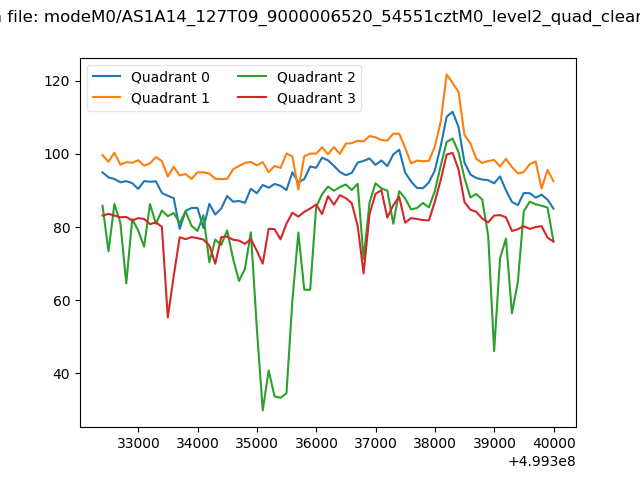 |
|
| Module-wise count rates for Quadrant A Data is divided into 100 sec bins |
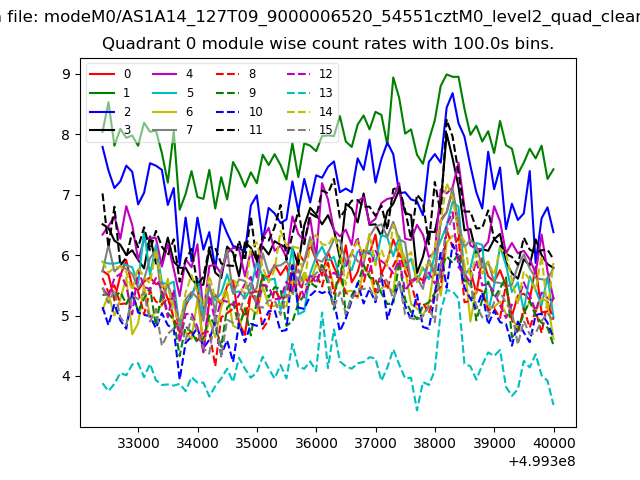 |
 |
| Module-wise count rates for Quadrant B Data is divided into 100 sec bins |
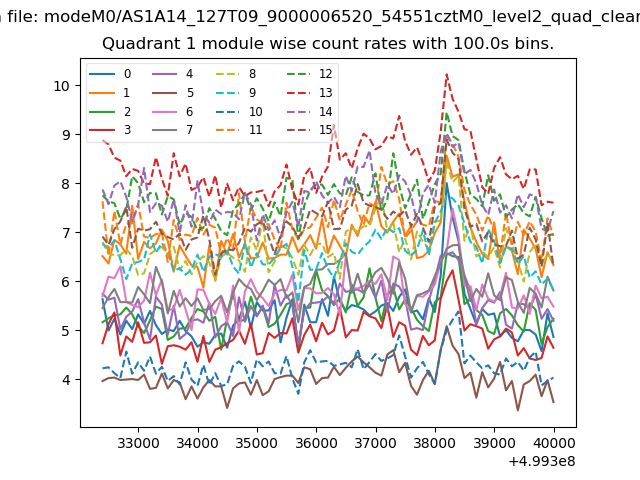 |
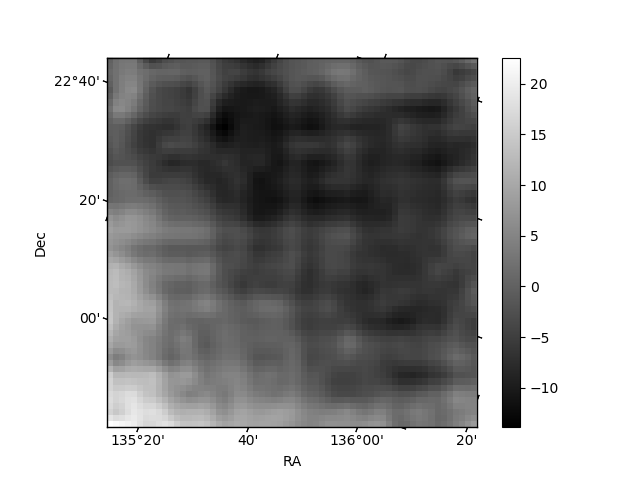 |
| Module-wise count rates for Quadrant C Data is divided into 100 sec bins |
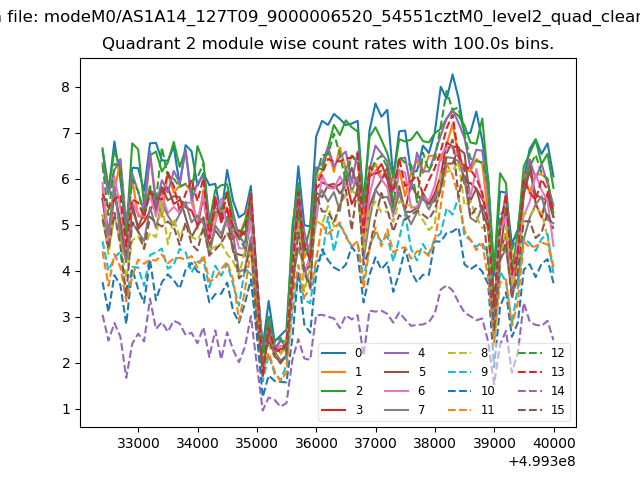 |
 |
| Module-wise count rates for Quadrant D Data is divided into 100 sec bins |
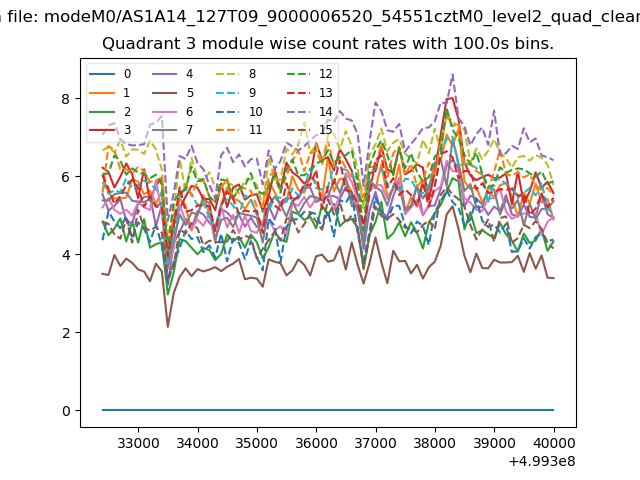 |
 |
| Parameter | Plot |
|---|---|
| CZT HV Monitor | 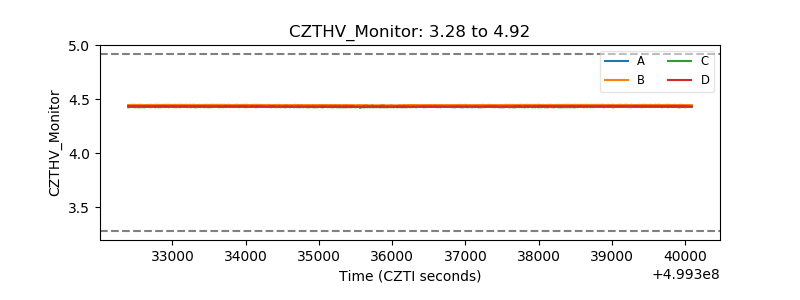 |
| D_VDD |  |
| Temperature 1 | 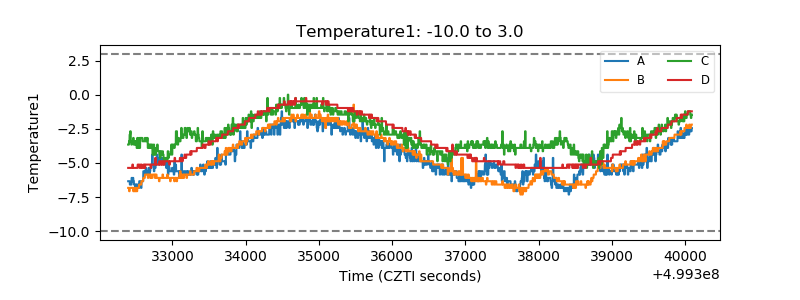 |
| Veto HV Monitor | 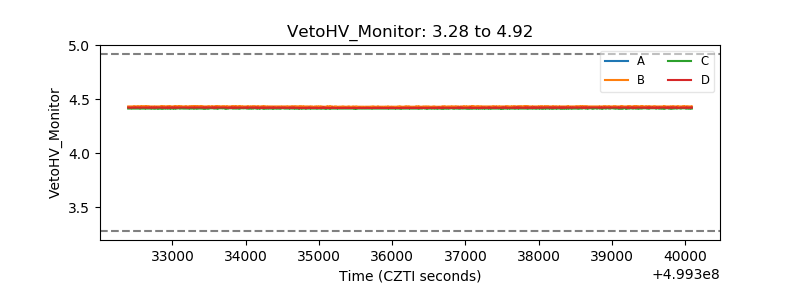 |
| Veto LLD | 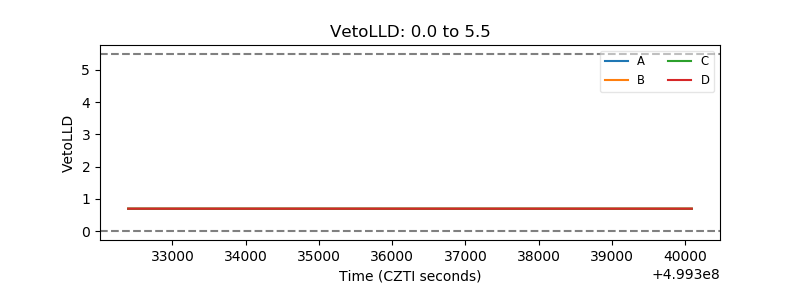 |
| Alpha Counter | 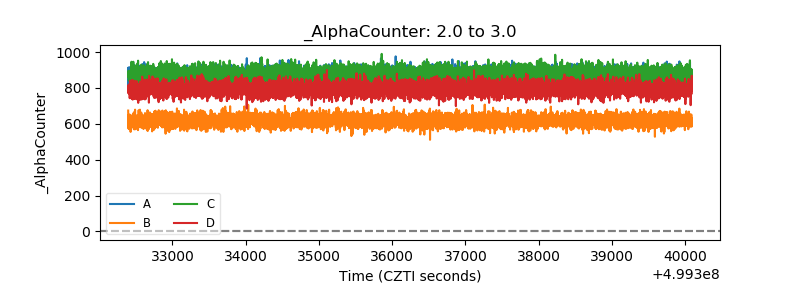 |
| _CPM_Rate | 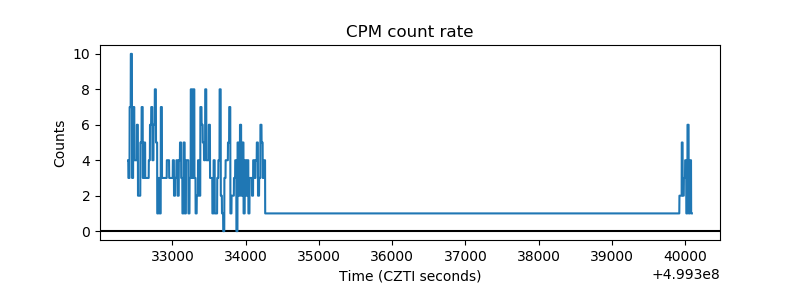 |
| CZT Counter | 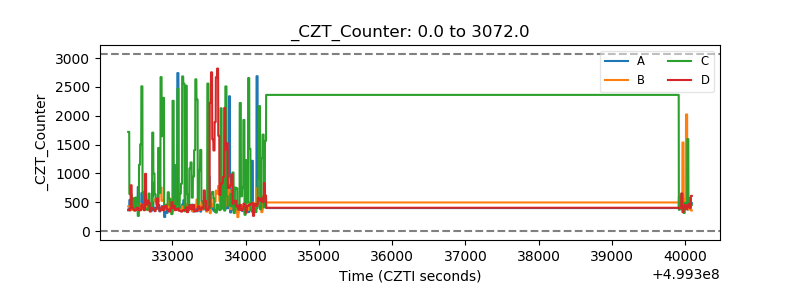 |
| +2.5 Volts monitor | 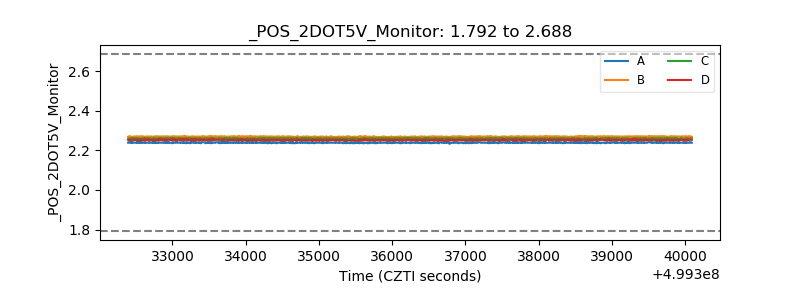 |
| +5 Volts monitor | 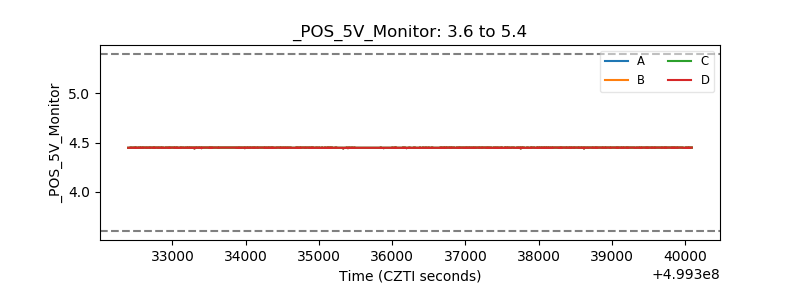 |
| _ROLL_ROT | 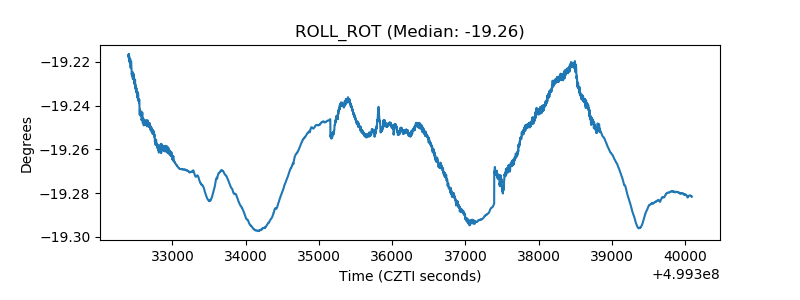 |
| _Roll_DEC | 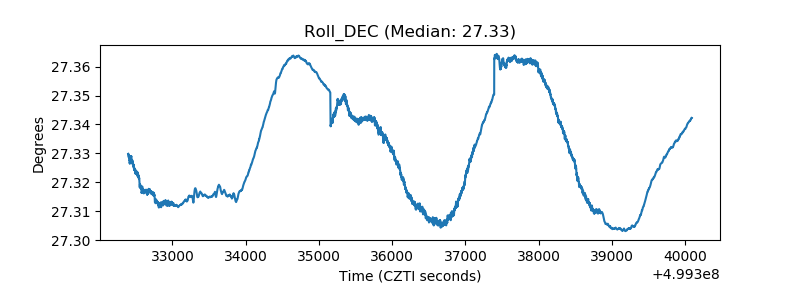 |
| _Roll_RA |  |
| Veto Counter | 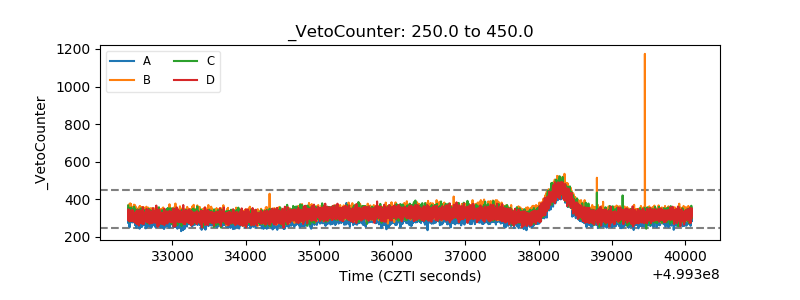 |