| Param | Original file | Final file |
|---|---|---|
| Filename | modeM0/AS1A14_127T09_9000006520_54555cztM0_level2.fits | modeM0/AS1A14_127T09_9000006520_54555cztM0_level2_quad_clean.evt |
| Size (bytes) | 580,132,800 | 95,996,160 |
| Size | 553.3 MB | 91.5 MB |
| Events in quadrant A | 7,440,513 | 601,460 |
| Events in quadrant B | 4,357,699 | 663,506 |
| Events in quadrant C | 4,700,813 | 583,332 |
| Events in quadrant D | 4,439,872 | 576,354 |
| Mode M0 | |||
|---|---|---|---|
| Quadrant | BADHDUFLAG | Total packets | Discarded packets |
| A | 0 | 26984 | 2 |
| B | 0 | 17890 | 2 |
| C | 0 | 18723 | 3 |
| D | 0 | 18044 | 2 |
| Mode SS | |||
|---|---|---|---|
| Quadrant | BADHDUFLAG | Total packets | Discarded packets |
| A | 0 | 142 | 0 |
| B | 0 | 142 | 0 |
| C | 0 | 142 | 0 |
| D | 0 | 142 | 0 |
| Mode M9 | |||
|---|---|---|---|
| Quadrant | BADHDUFLAG | Total packets | Discarded packets |
| A | 0 | 8 | 0 |
| B | 0 | 8 | 0 |
| C | 0 | 8 | 0 |
| D | 0 | 8 | 0 |
| Quadrant | Total seconds | Saturated seconds | Saturation percentage |
|---|---|---|---|
| A | 6905 | 1007 | 14.583635% |
| B | 6905 | 508 | 7.356988% |
| C | 6905 | 548 | 7.936278% |
| D | 6905 | 272 | 3.939175% |
Noise dominated data is calculated using 1-second bins in cleaned event files. If a bin has >2000 counts, and if more than 50% of those come from <1% of pixels, then it is considered to be noise-dominated and hence unusable.
| Quadrant | # 1 sec bins | Bins with >0 counts | Bins with >2000 counts | High rate bins dominated by noise | Noise dominated (total time) | Noise dominated (detector-on time) | Marked lightcurve |
|---|---|---|---|---|---|---|---|
| A | 7774 | 6904 | 854 | 854 | 10.99% | 12.37% | 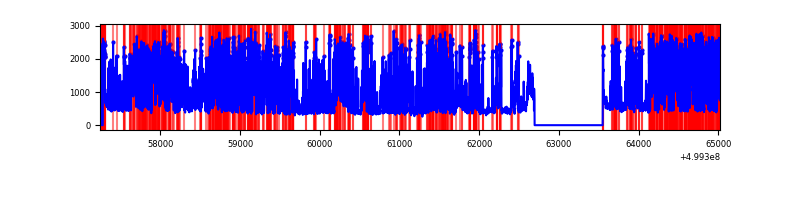 |
| B | 7774 | 6904 | 281 | 281 | 3.61% | 4.07% | 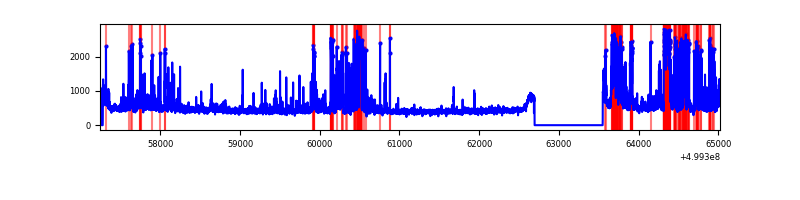 |
| C | 7774 | 6905 | 342 | 342 | 4.40% | 4.95% | 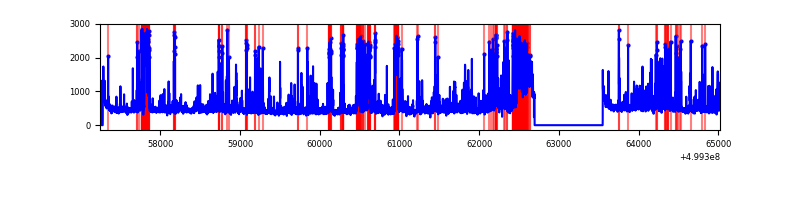 |
| D | 7774 | 6904 | 206 | 206 | 2.65% | 2.98% | 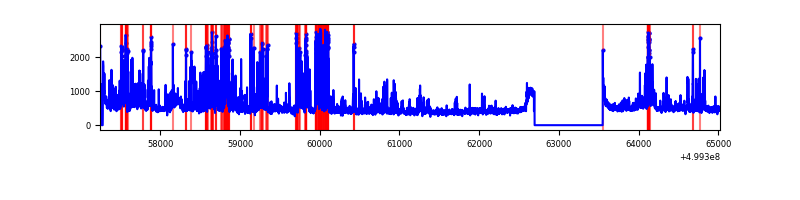 |
Top three noisy pixels from each quadrant. If the there are fewer than three noisy pixels in the level2.evt file, extra rows are filled as -1
| Pixel properties | Quadrant properties | ||||||
|---|---|---|---|---|---|---|---|
| Quadrant | DetID | PixID | Counts | Sigma | Mean | Median | Sigma |
| A | 3 | 14 | 3721154 | 20248.3 | 740 | 720 | 183.7 |
| A | 11 | 3 | 432678 | 2350.91 | 740 | 720 | 183.7 |
| A | 4 | 249 | 334518 | 1816.68 | 740 | 720 | 183.7 |
| B | 5 | 185 | 389819 | 2456.58 | 739 | 712 | 158.4 |
| B | 8 | 234 | 382294 | 2409.07 | 739 | 712 | 158.4 |
| B | 2 | 249 | 254074 | 1599.57 | 739 | 712 | 158.4 |
| C | 12 | 254 | 986660 | 4986.81 | 725 | 718 | 197.7 |
| C | 1 | 45 | 312773 | 1578.35 | 725 | 718 | 197.7 |
| C | 13 | 3 | 186825 | 941.31 | 725 | 718 | 197.7 |
| D | 1 | 3 | 1280885 | 6056.4 | 748 | 715 | 211.4 |
| D | 5 | 173 | 62904 | 294.21 | 748 | 715 | 211.4 |
| D | 2 | 233 | 32231 | 149.1 | 748 | 715 | 211.4 |
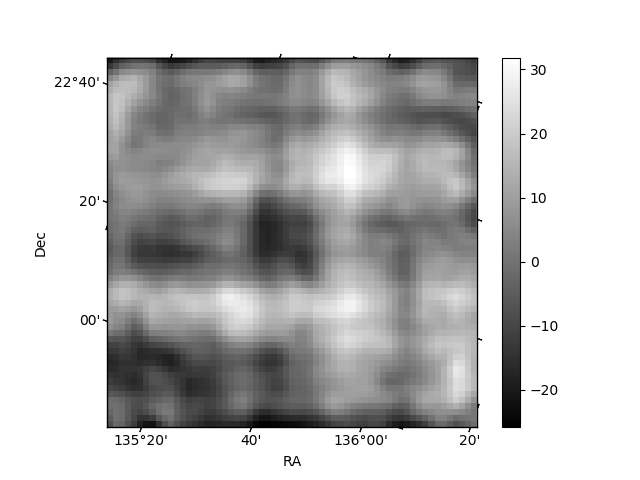
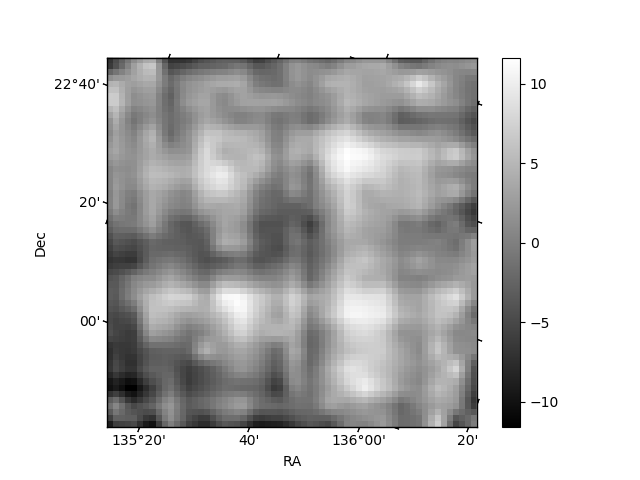
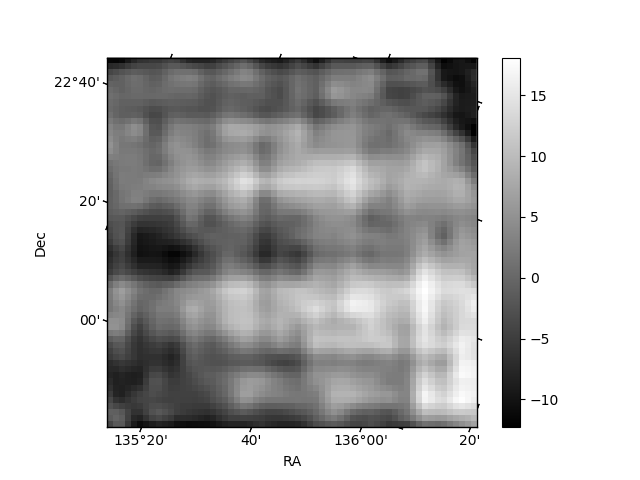
Histogram calculated using DETX and DETY for each event in the final _common_clean file
| Quadrant A | 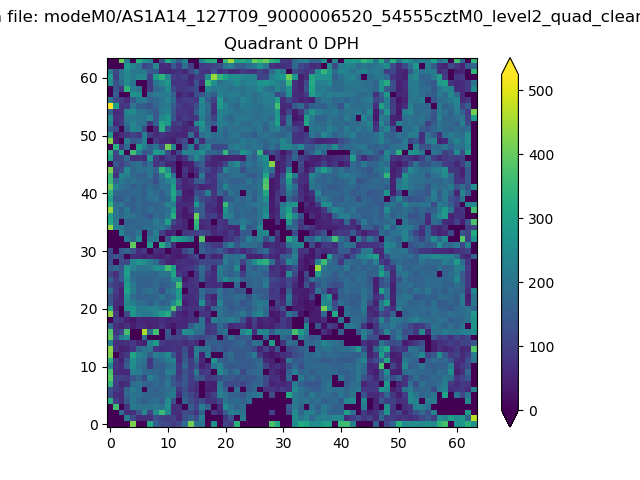 |
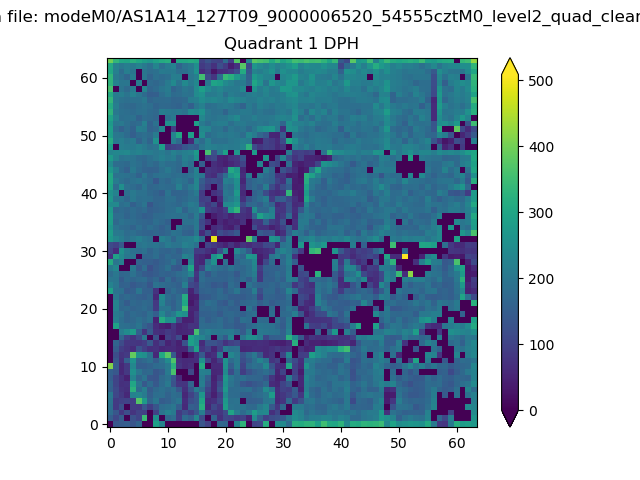 |
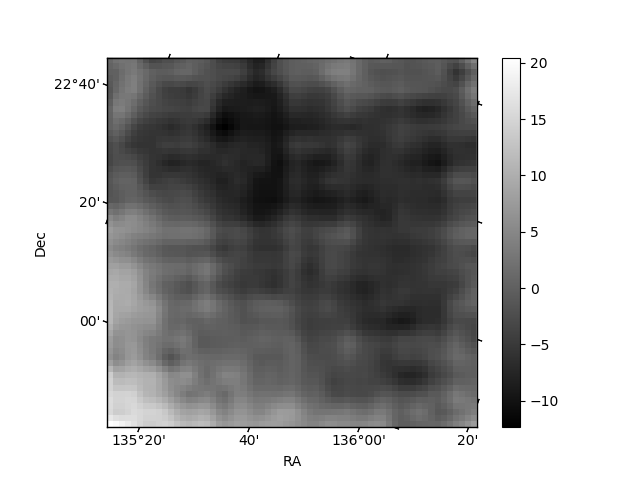
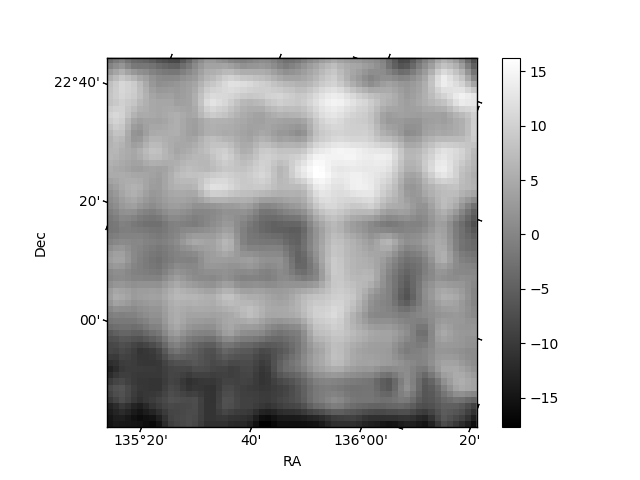
Quadrant B |
|---|---|---|---|
| Quadrant D | 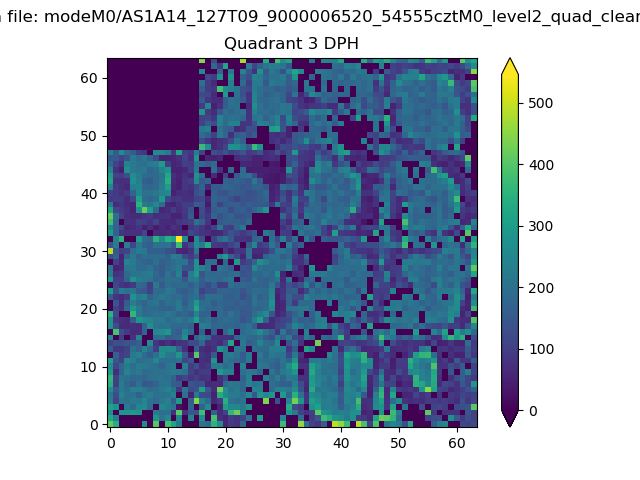 |
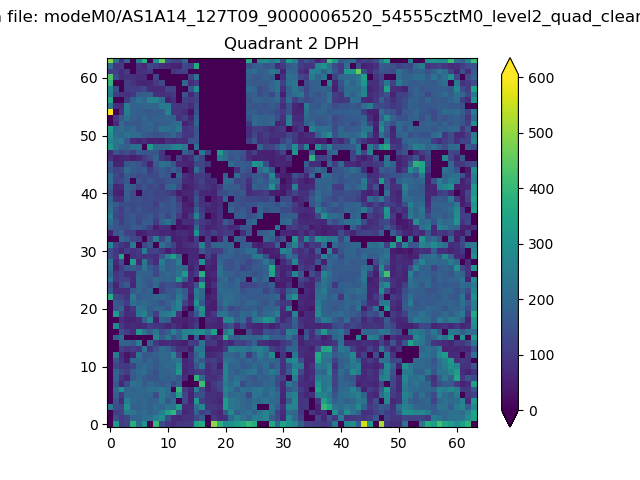 |
Quadrant C |
| Plot type | Count rate plots | Images |
|---|---|---|
| Comparison with Poisson distribution Blue bars denote a histogram of data divided into 1 sec bins. Red curve is a Poisson curve with rate = median count rate of data. |
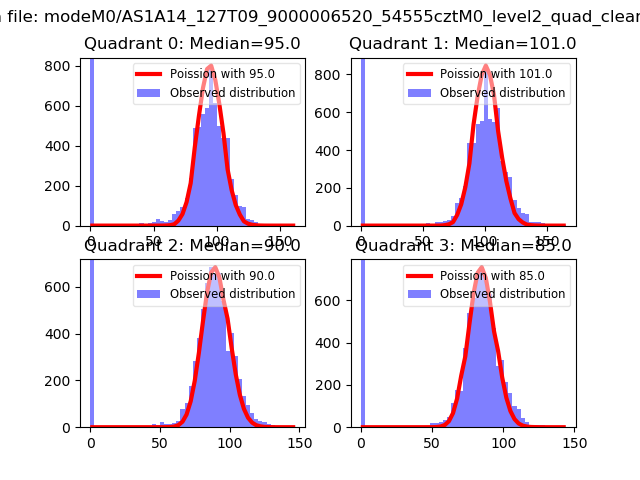 |
 |
| Quadrant-wise count rates Data is divided into 100 sec bins |
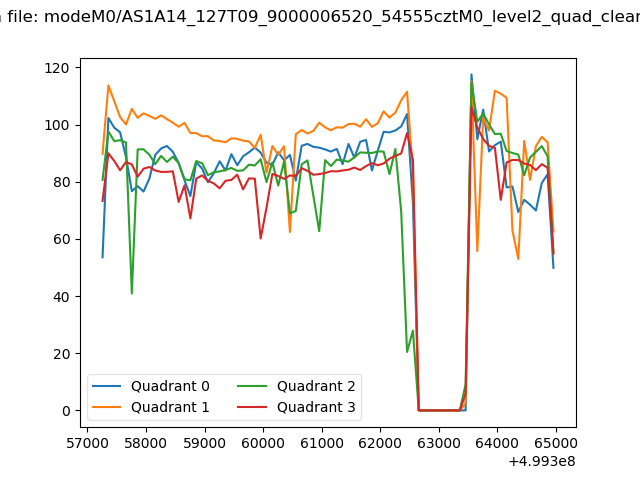 |
|
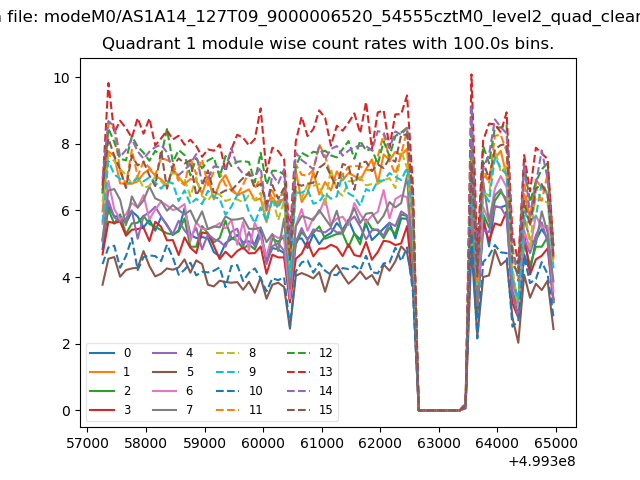
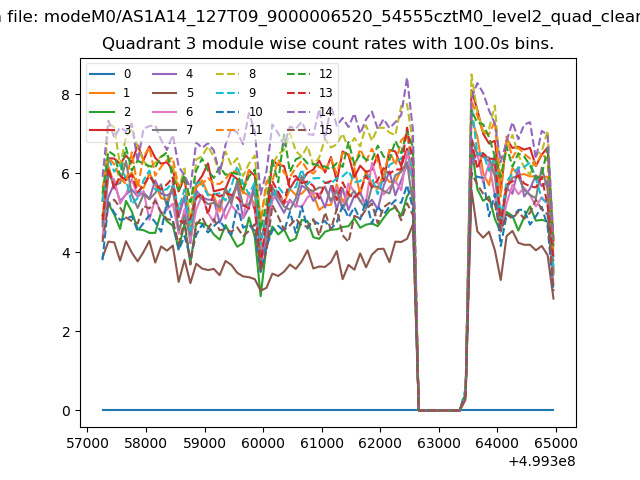
| Module-wise count rates for Quadrant A Data is divided into 100 sec bins |
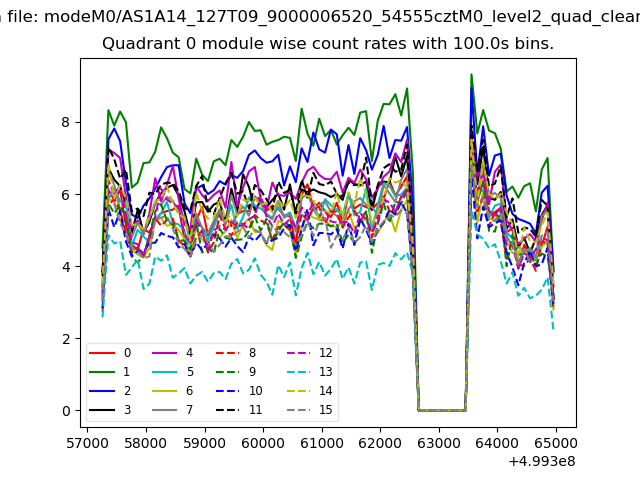 |
 |
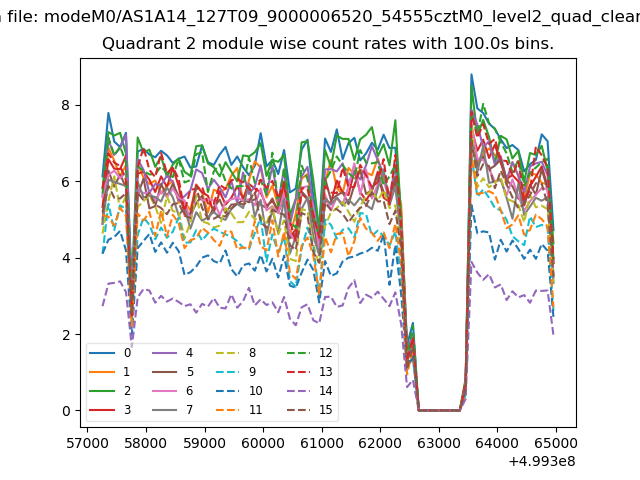
| Module-wise count rates for Quadrant B Data is divided into 100 sec bins |
 |
 |
| Module-wise count rates for Quadrant C Data is divided into 100 sec bins |
 |
 |
| Module-wise count rates for Quadrant D Data is divided into 100 sec bins |
 |
 |
| Parameter | Plot |
|---|---|
| CZT HV Monitor | 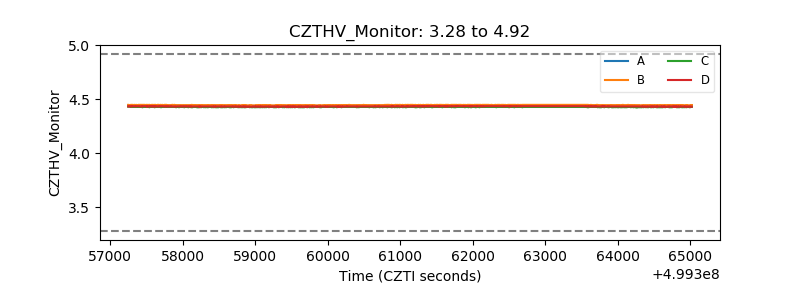 |
| D_VDD | 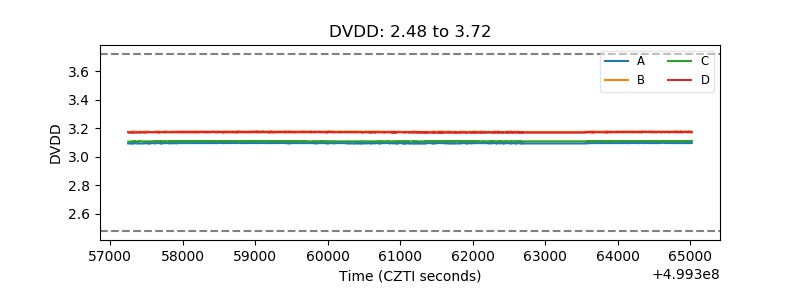 |
| Temperature 1 | 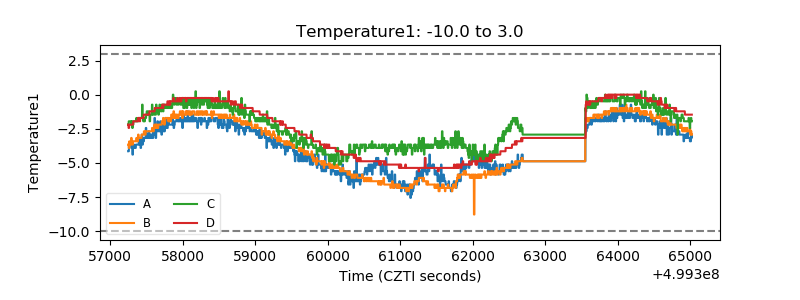 |
| Veto HV Monitor | 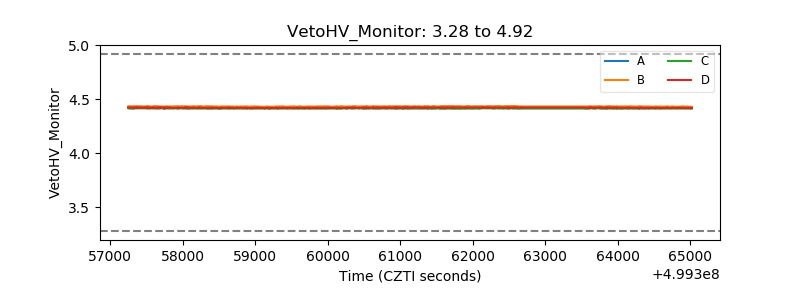 |
| Veto LLD | 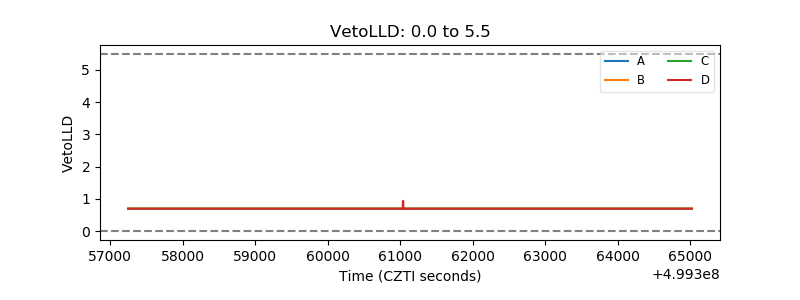 |
| Alpha Counter | 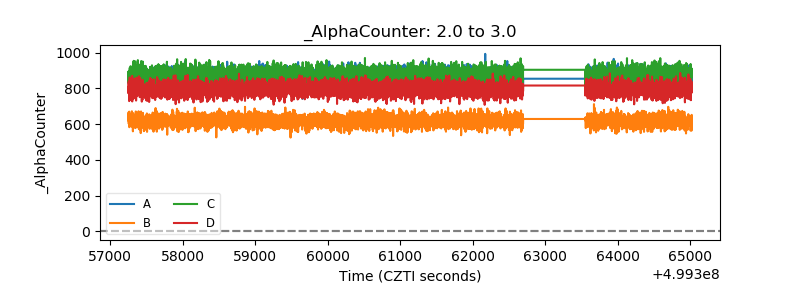 |
| _CPM_Rate | 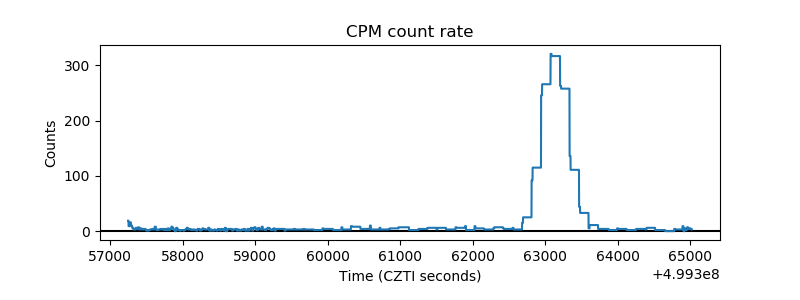 |
| CZT Counter | 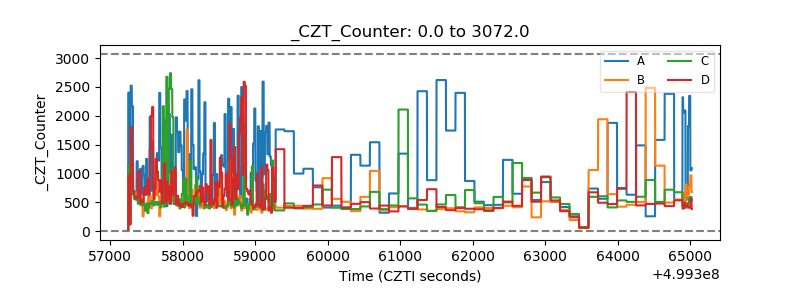 |
| +2.5 Volts monitor |  |
| +5 Volts monitor |  |
| _ROLL_ROT | 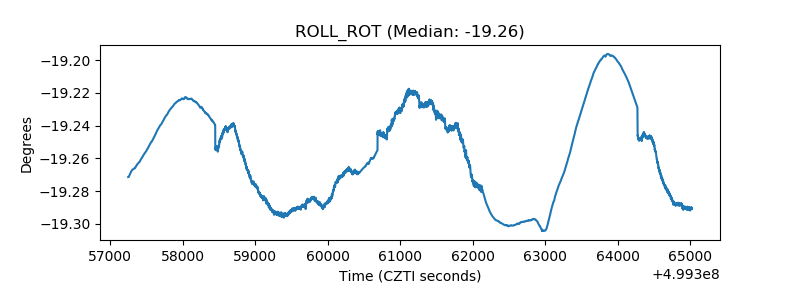 |
| _Roll_DEC | 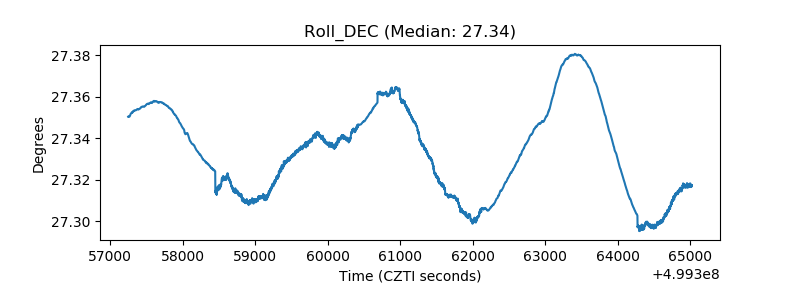 |
| _Roll_RA | 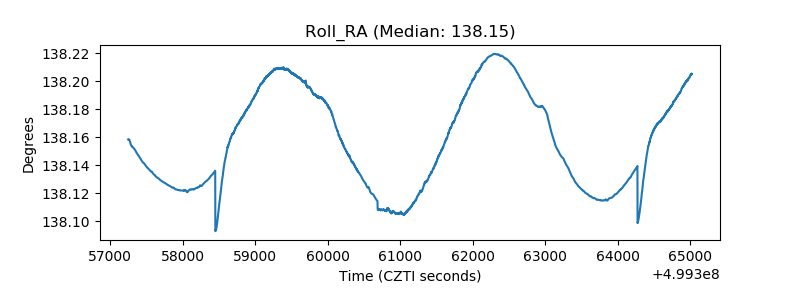 |
| Veto Counter | 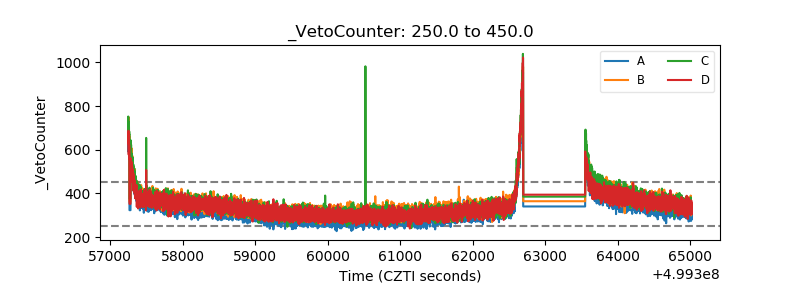 |