| Param | Original file | Final file |
|---|---|---|
| Filename | modeM0/AS1A14_127T09_9000006520_54557cztM0_level2.fits | modeM0/AS1A14_127T09_9000006520_54557cztM0_level2_quad_clean.evt |
| Size (bytes) | 606,804,480 | 91,923,840 |
| Size | 578.7 MB | 87.7 MB |
| Events in quadrant A | 6,871,422 | 587,123 |
| Events in quadrant B | 5,585,147 | 594,797 |
| Events in quadrant C | 5,780,625 | 557,457 |
| Events in quadrant D | 3,707,620 | 578,549 |
| Mode M0 | |||
|---|---|---|---|
| Quadrant | BADHDUFLAG | Total packets | Discarded packets |
| A | 0 | 24980 | 2 |
| B | 0 | 21277 | 2 |
| C | 0 | 21998 | 2 |
| D | 0 | 15908 | 3 |
| Mode SS | |||
|---|---|---|---|
| Quadrant | BADHDUFLAG | Total packets | Discarded packets |
| A | 0 | 138 | 0 |
| B | 0 | 138 | 0 |
| C | 0 | 138 | 0 |
| D | 0 | 138 | 0 |
| Mode M9 | |||
|---|---|---|---|
| Quadrant | BADHDUFLAG | Total packets | Discarded packets |
| A | 0 | 12 | 0 |
| B | 0 | 13 | 0 |
| C | 0 | 13 | 0 |
| D | 0 | 13 | 0 |
| Quadrant | Total seconds | Saturated seconds | Saturation percentage |
|---|---|---|---|
| A | 6662 | 1044 | 15.670970% |
| B | 6662 | 1064 | 15.971180% |
| C | 6662 | 843 | 12.653858% |
| D | 6661 | 124 | 1.861582% |
Noise dominated data is calculated using 1-second bins in cleaned event files. If a bin has >2000 counts, and if more than 50% of those come from <1% of pixels, then it is considered to be noise-dominated and hence unusable.
| Quadrant | # 1 sec bins | Bins with >0 counts | Bins with >2000 counts | High rate bins dominated by noise | Noise dominated (total time) | Noise dominated (detector-on time) | Marked lightcurve |
|---|---|---|---|---|---|---|---|
| A | 7656 | 6662 | 909 | 909 | 11.87% | 13.64% | 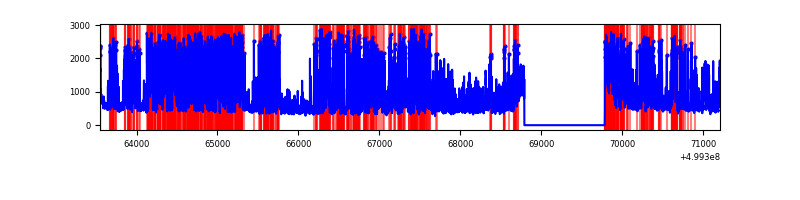 |
| B | 7656 | 6662 | 716 | 716 | 9.35% | 10.75% | 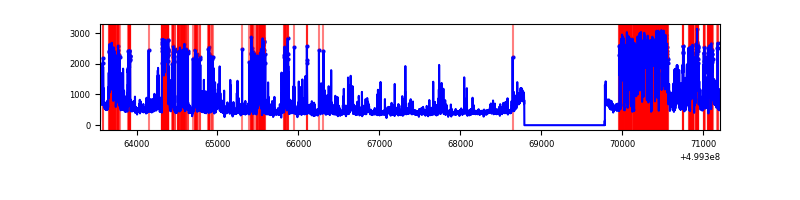 |
| C | 7656 | 6662 | 754 | 754 | 9.85% | 11.32% | 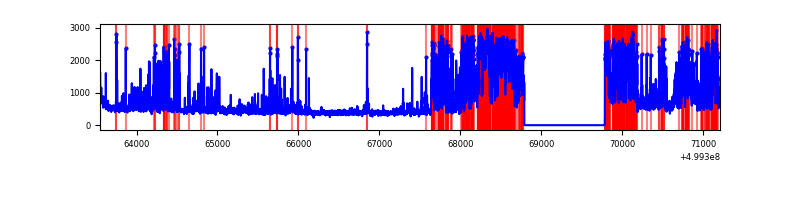 |
| D | 7655 | 6661 | 46 | 46 | 0.60% | 0.69% | 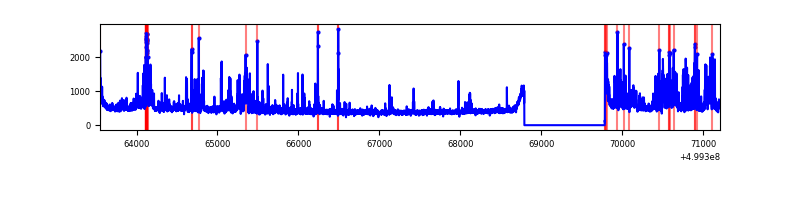 |
Top three noisy pixels from each quadrant. If the there are fewer than three noisy pixels in the level2.evt file, extra rows are filled as -1
| Pixel properties | Quadrant properties | ||||||
|---|---|---|---|---|---|---|---|
| Quadrant | DetID | PixID | Counts | Sigma | Mean | Median | Sigma |
| A | 3 | 14 | 3656552 | 20601.74 | 713 | 692 | 177.5 |
| A | 11 | 3 | 305629 | 1718.4 | 713 | 692 | 177.5 |
| A | 4 | 3 | 93527 | 523.15 | 713 | 692 | 177.5 |
| B | 8 | 234 | 2028734 | 13951.27 | 671 | 647 | 145.4 |
| B | 10 | 14 | 255975 | 1756.41 | 671 | 647 | 145.4 |
| B | 2 | 249 | 235937 | 1618.57 | 671 | 647 | 145.4 |
| C | 12 | 254 | 2438534 | 12710.73 | 698 | 691 | 191.8 |
| C | 1 | 45 | 153697 | 797.76 | 698 | 691 | 191.8 |
| C | 6 | 223 | 140631 | 729.63 | 698 | 691 | 191.8 |
| D | 1 | 3 | 563055 | 2725.88 | 728 | 694 | 206.3 |
| D | 5 | 173 | 60737 | 291.04 | 728 | 694 | 206.3 |
| D | 2 | 172 | 53311 | 255.04 | 728 | 694 | 206.3 |
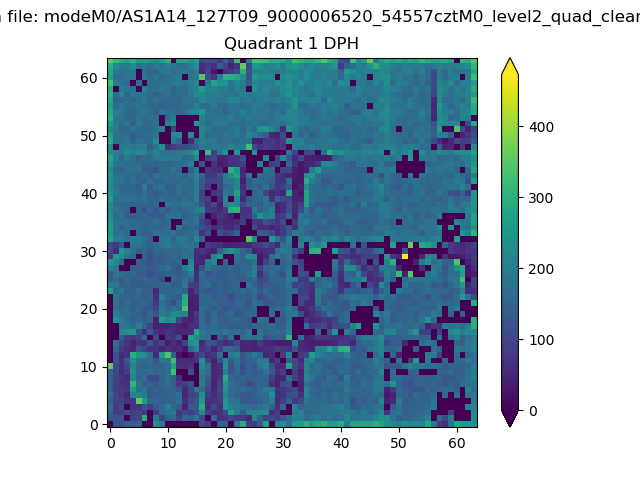
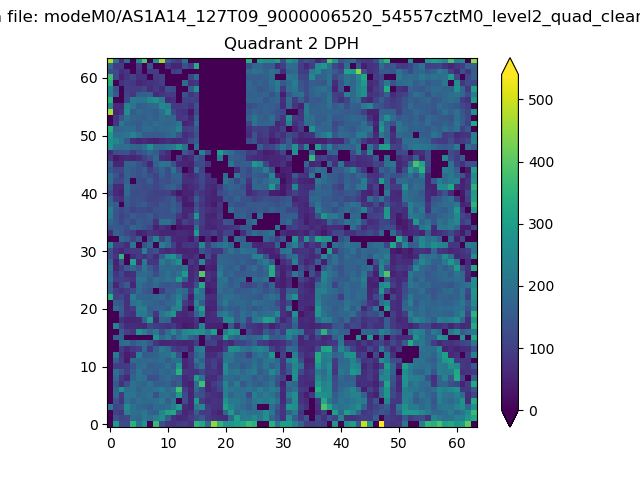
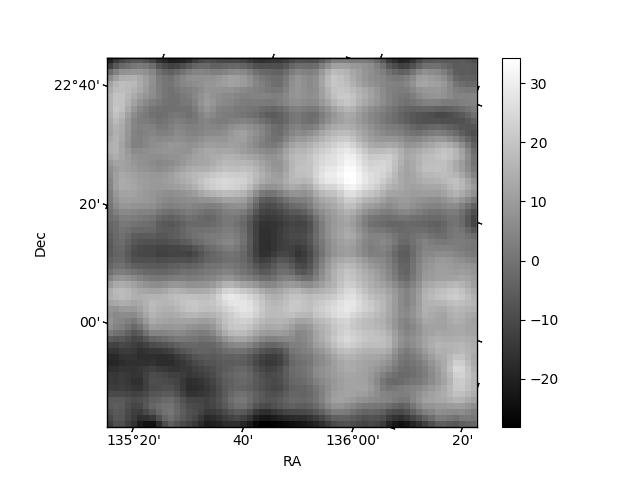
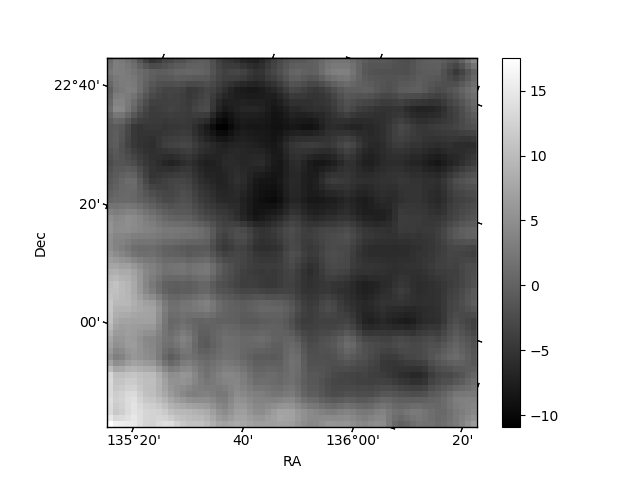
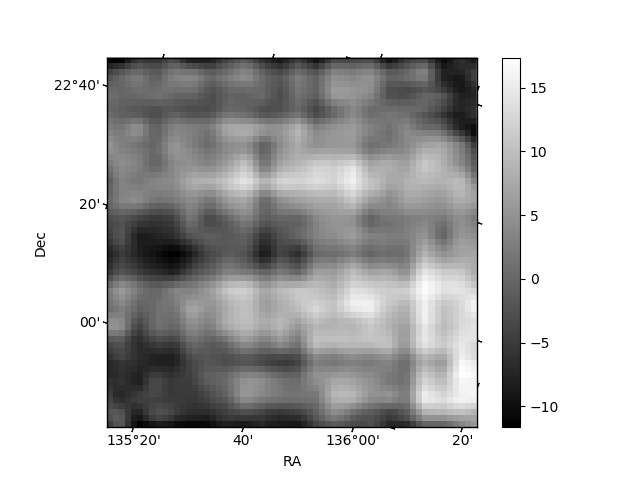
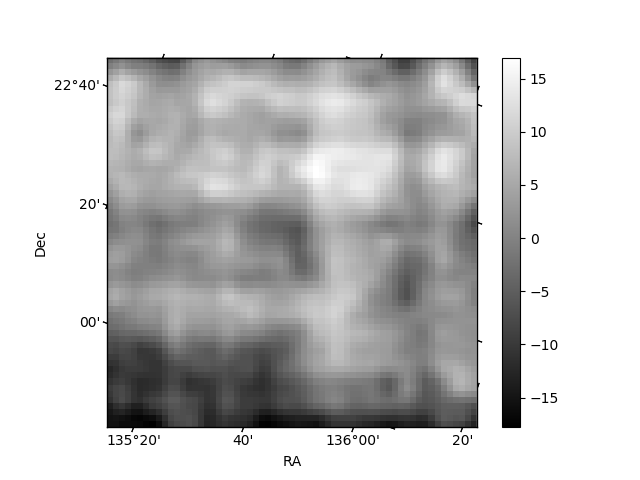
Histogram calculated using DETX and DETY for each event in the final _common_clean file
| Quadrant A |  |
 |
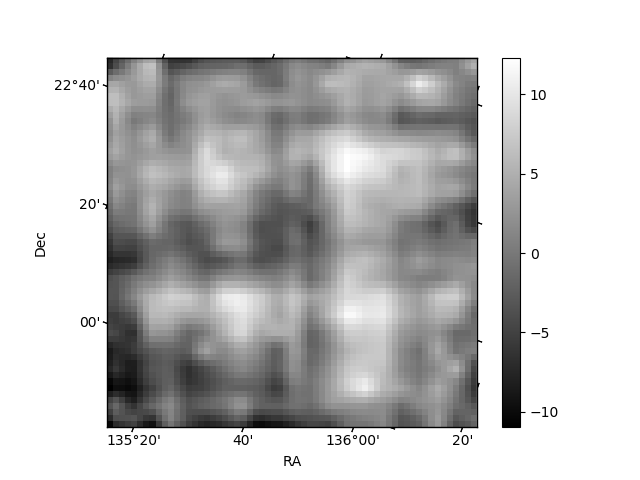
Quadrant B |
|---|---|---|---|
| Quadrant D | 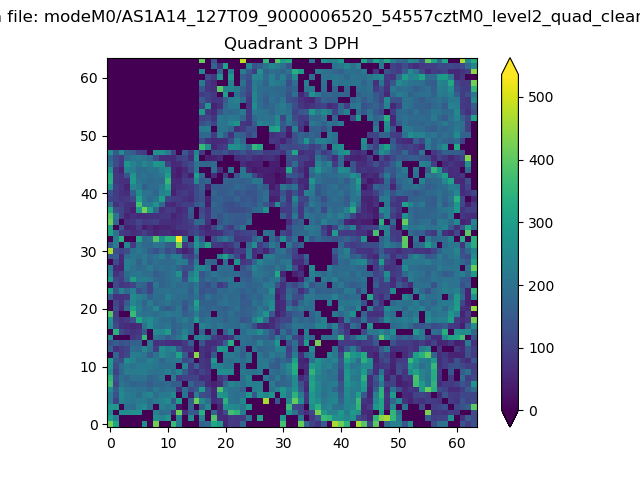 |
 |
Quadrant C |
| Plot type | Count rate plots | Images |
|---|---|---|
| Comparison with Poisson distribution Blue bars denote a histogram of data divided into 1 sec bins. Red curve is a Poisson curve with rate = median count rate of data. |
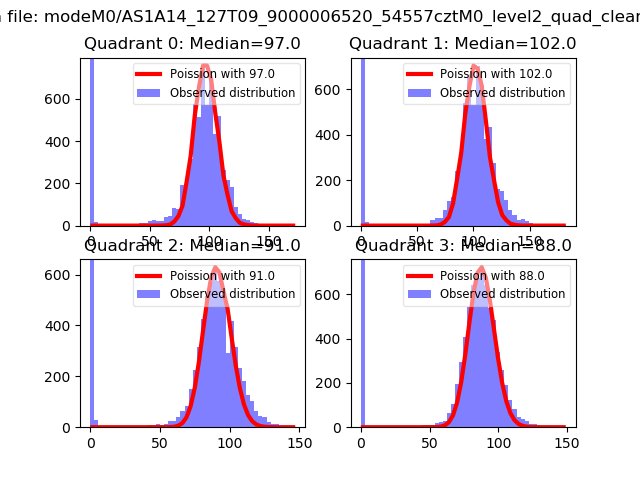 |
 |
| Quadrant-wise count rates Data is divided into 100 sec bins |
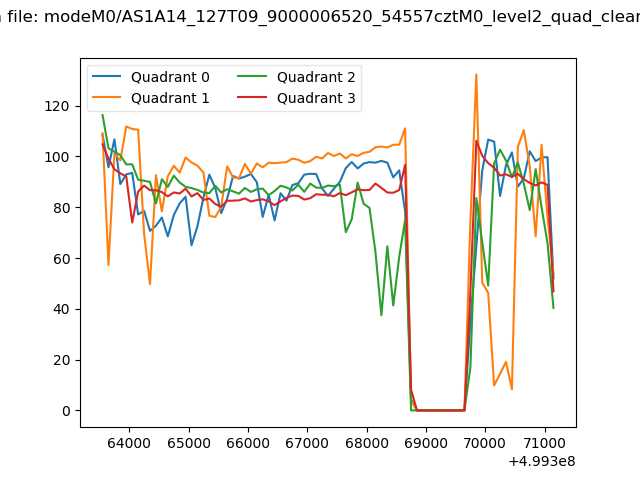 |
|
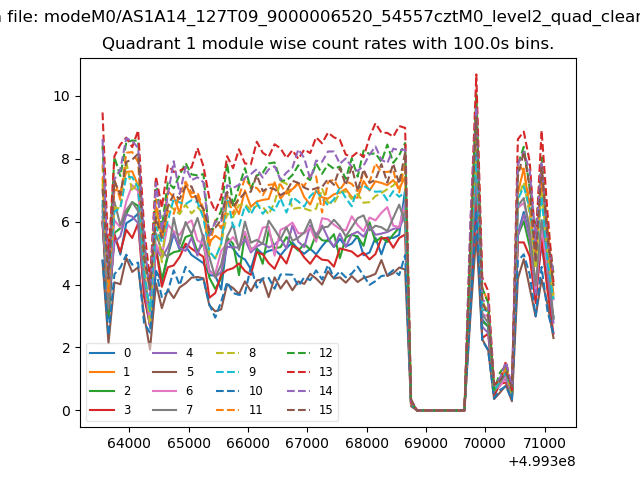
| Module-wise count rates for Quadrant A Data is divided into 100 sec bins |
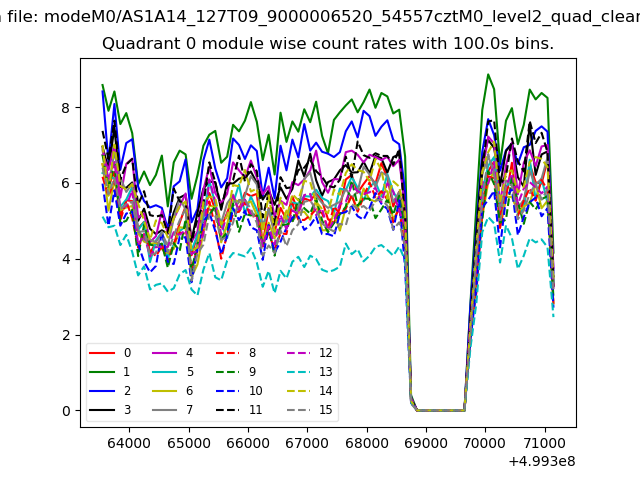 |
 |
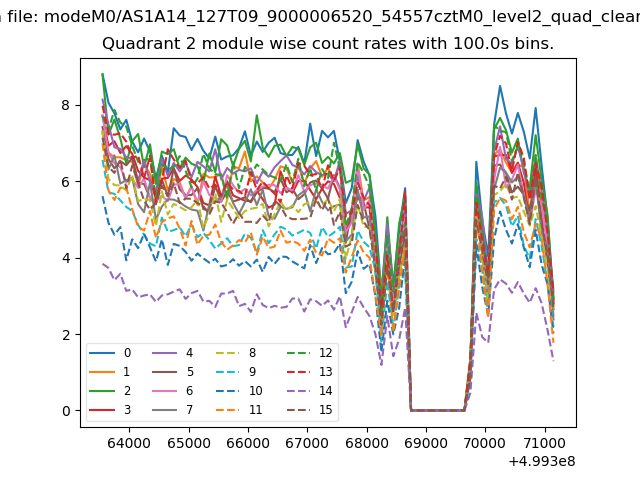
| Module-wise count rates for Quadrant B Data is divided into 100 sec bins |
 |
 |
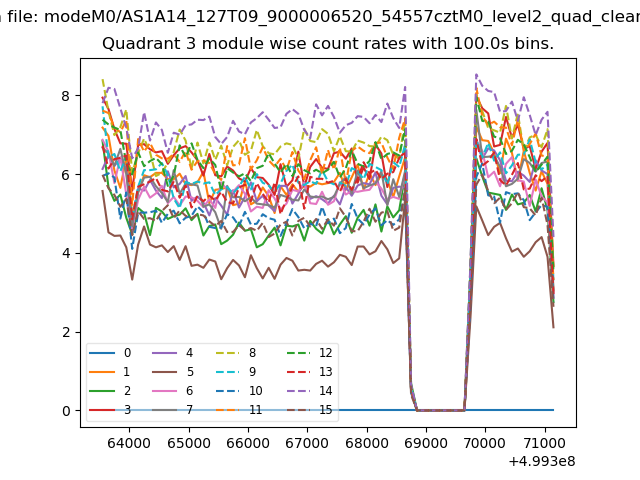
| Module-wise count rates for Quadrant C Data is divided into 100 sec bins |
 |
 |
| Module-wise count rates for Quadrant D Data is divided into 100 sec bins |
 |
 |
| Parameter | Plot |
|---|---|
| CZT HV Monitor | 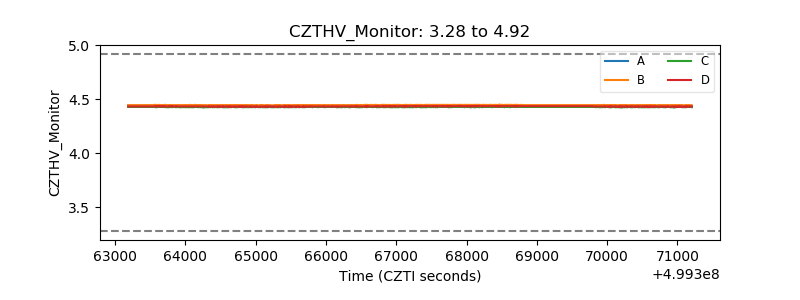 |
| D_VDD | 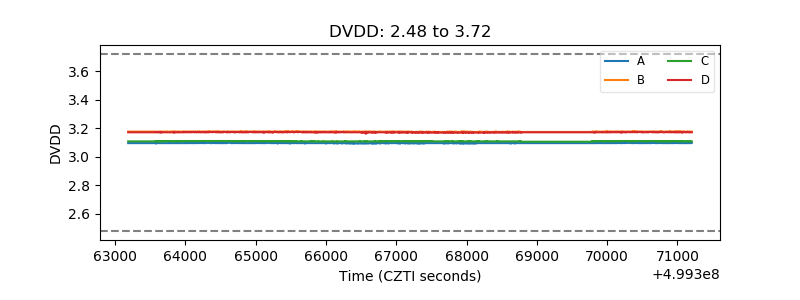 |
| Temperature 1 | 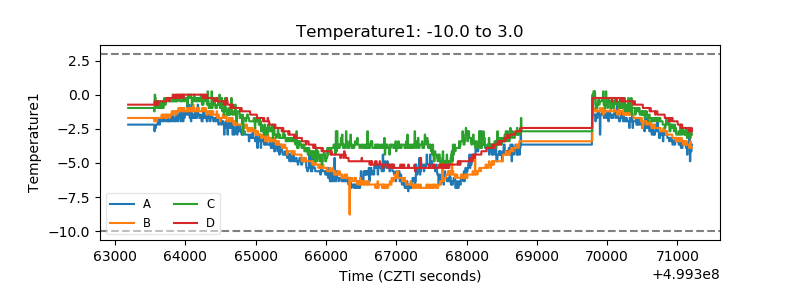 |
| Veto HV Monitor | 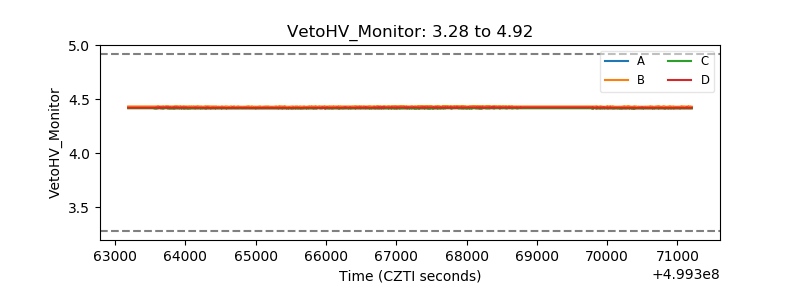 |
| Veto LLD | 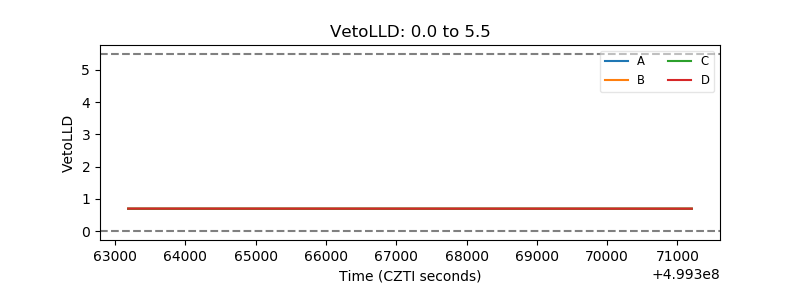 |
| Alpha Counter | 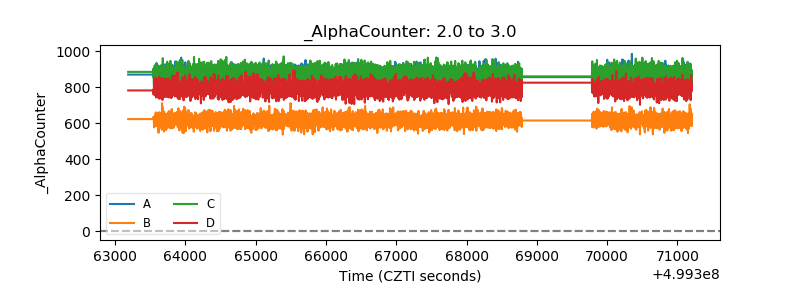 |
| _CPM_Rate | 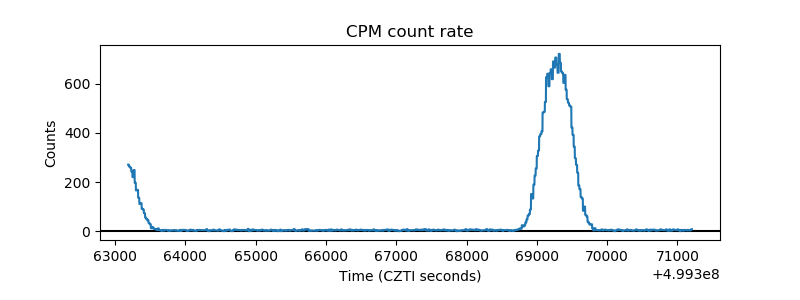 |
| CZT Counter | 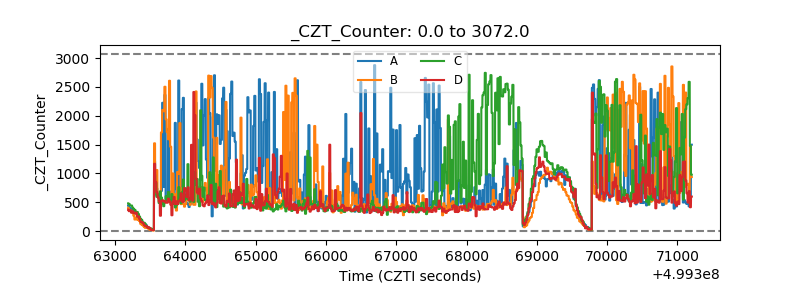 |
| +2.5 Volts monitor | 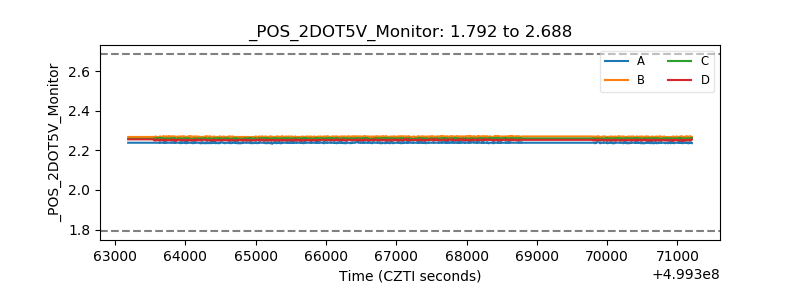 |
| +5 Volts monitor | 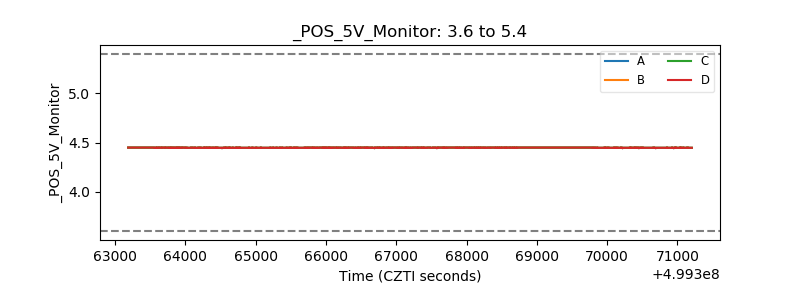 |
| _ROLL_ROT | 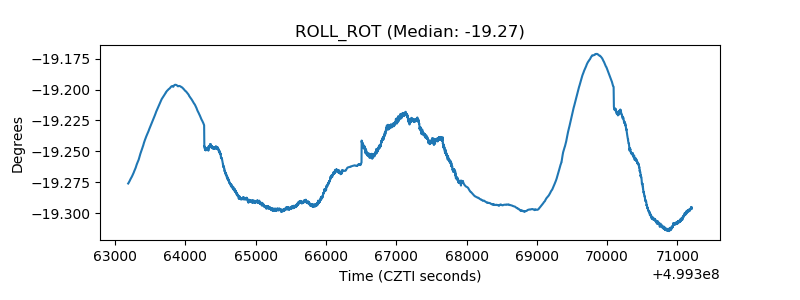 |
| _Roll_DEC | 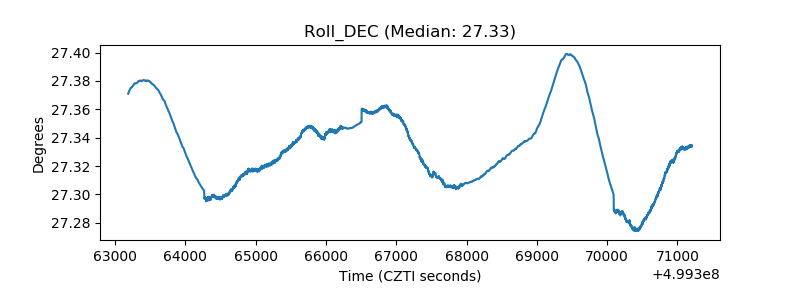 |
| _Roll_RA | 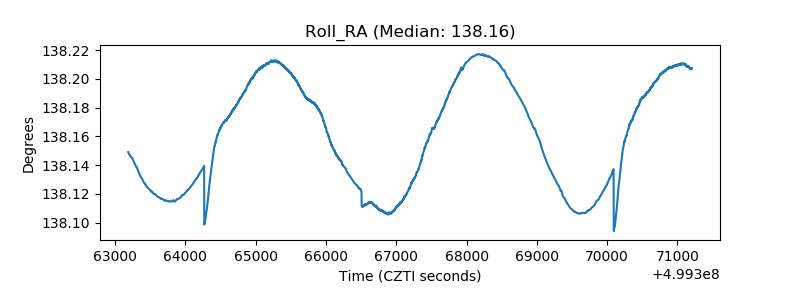 |
| Veto Counter | 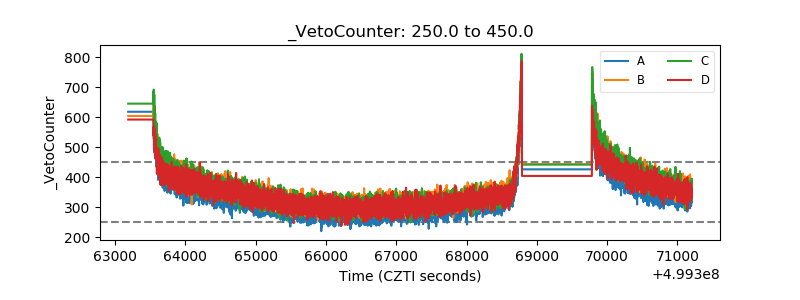 |