| Param | Original file | Final file |
|---|---|---|
| Filename | modeM0/AS1A14_127T09_9000006520_54558cztM0_level2.fits | modeM0/AS1A14_127T09_9000006520_54558cztM0_level2_quad_clean.evt |
| Size (bytes) | 636,330,240 | 90,875,520 |
| Size | 606.9 MB | 86.7 MB |
| Events in quadrant A | 5,794,847 | 603,228 |
| Events in quadrant B | 7,223,870 | 559,999 |
| Events in quadrant C | 6,425,718 | 545,486 |
| Events in quadrant D | 3,601,589 | 585,084 |
| Mode M0 | |||
|---|---|---|---|
| Quadrant | BADHDUFLAG | Total packets | Discarded packets |
| A | 0 | 21785 | 2 |
| B | 0 | 25880 | 2 |
| C | 0 | 23710 | 2 |
| D | 0 | 15515 | 2 |
| Mode SS | |||
|---|---|---|---|
| Quadrant | BADHDUFLAG | Total packets | Discarded packets |
| A | 0 | 134 | 0 |
| B | 0 | 134 | 0 |
| C | 0 | 134 | 0 |
| D | 0 | 134 | 0 |
| Mode M9 | |||
|---|---|---|---|
| Quadrant | BADHDUFLAG | Total packets | Discarded packets |
| A | 0 | 16 | 0 |
| B | 0 | 16 | 0 |
| C | 0 | 17 | 0 |
| D | 0 | 17 | 0 |
| Quadrant | Total seconds | Saturated seconds | Saturation percentage |
|---|---|---|---|
| A | 6558 | 767 | 11.695639% |
| B | 6558 | 1593 | 24.290942% |
| C | 6558 | 1096 | 16.712412% |
| D | 6558 | 149 | 2.272034% |
Noise dominated data is calculated using 1-second bins in cleaned event files. If a bin has >2000 counts, and if more than 50% of those come from <1% of pixels, then it is considered to be noise-dominated and hence unusable.
| Quadrant | # 1 sec bins | Bins with >0 counts | Bins with >2000 counts | High rate bins dominated by noise | Noise dominated (total time) | Noise dominated (detector-on time) | Marked lightcurve |
|---|---|---|---|---|---|---|---|
| A | 7643 | 6559 | 542 | 542 | 7.09% | 8.26% | 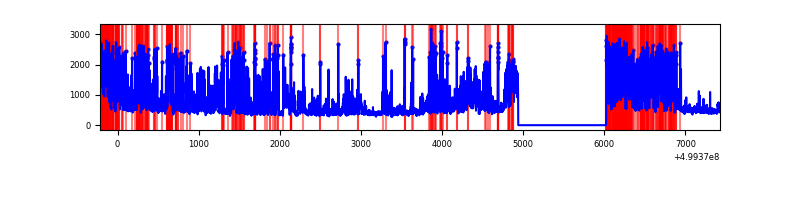 |
| B | 7643 | 6559 | 1306 | 1306 | 17.09% | 19.91% | 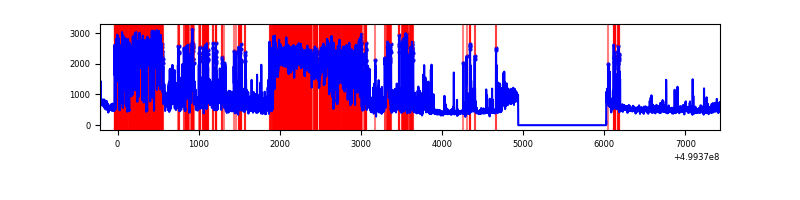 |
| C | 7643 | 6559 | 901 | 901 | 11.79% | 13.74% | 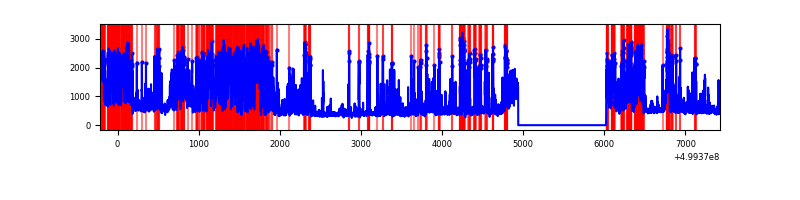 |
| D | 7643 | 6559 | 51 | 51 | 0.67% | 0.78% | 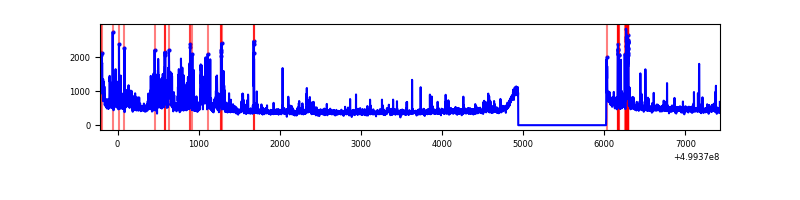 |
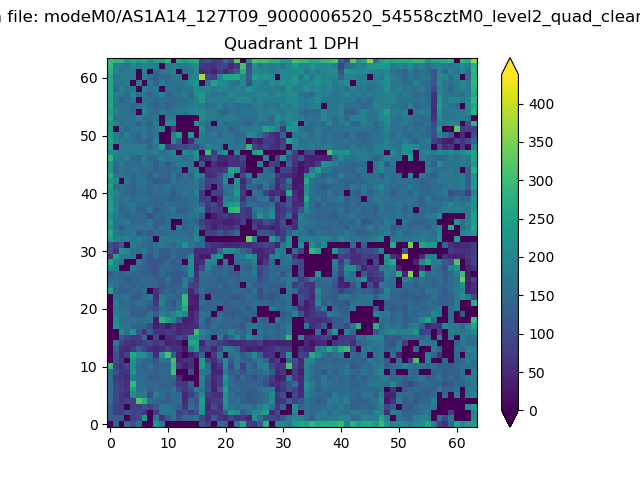
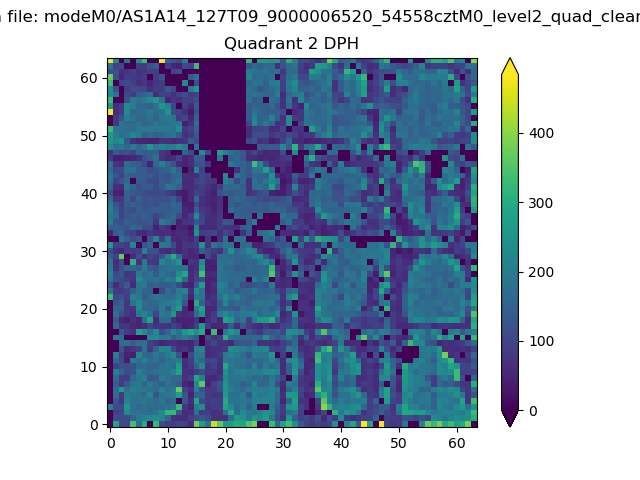
Top three noisy pixels from each quadrant. If the there are fewer than three noisy pixels in the level2.evt file, extra rows are filled as -1
| Pixel properties | Quadrant properties | ||||||
|---|---|---|---|---|---|---|---|
| Quadrant | DetID | PixID | Counts | Sigma | Mean | Median | Sigma |
| A | 3 | 14 | 2482941 | 14043.51 | 715 | 695 | 176.8 |
| A | 11 | 3 | 372270 | 2102.22 | 715 | 695 | 176.8 |
| A | 4 | 3 | 95631 | 537.11 | 715 | 695 | 176.8 |
| B | 5 | 185 | 2140188 | 15085.51 | 664 | 641 | 141.8 |
| B | 8 | 234 | 1716474 | 12097.99 | 664 | 641 | 141.8 |
| B | 1 | 207 | 325359 | 2289.52 | 664 | 641 | 141.8 |
| C | 12 | 254 | 3050708 | 16067.19 | 687 | 682 | 189.8 |
| C | 1 | 45 | 217211 | 1140.65 | 687 | 682 | 189.8 |
| C | 12 | 249 | 129377 | 677.95 | 687 | 682 | 189.8 |
| D | 1 | 3 | 390160 | 1881.5 | 728 | 695 | 207.0 |
| D | 15 | 122 | 72675 | 347.73 | 728 | 695 | 207.0 |
| D | 5 | 173 | 56932 | 271.68 | 728 | 695 | 207.0 |
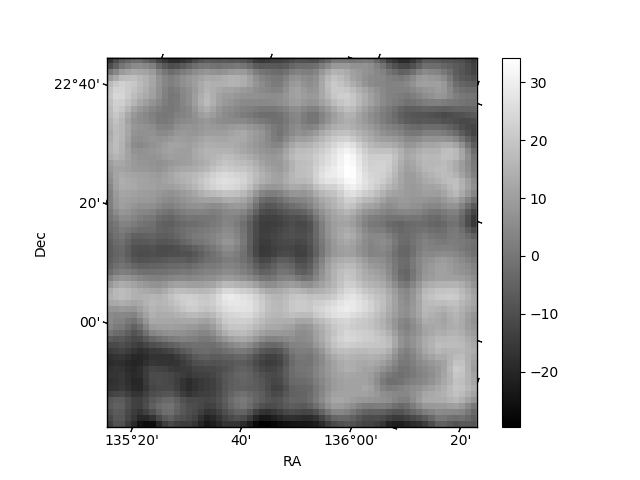
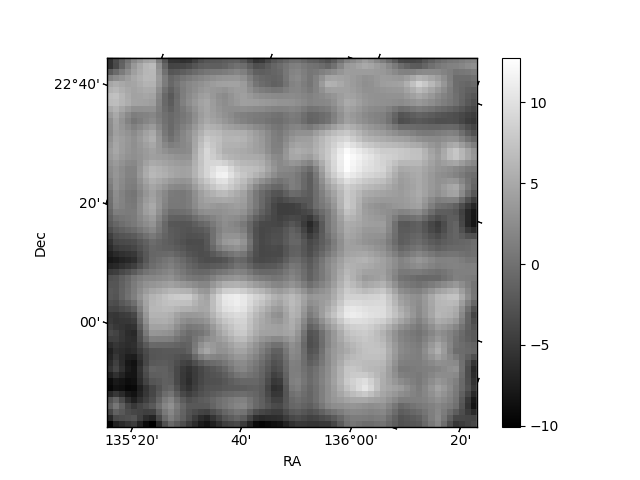
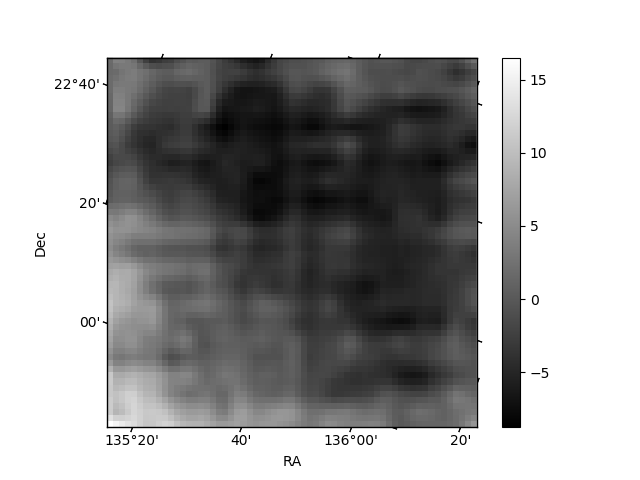
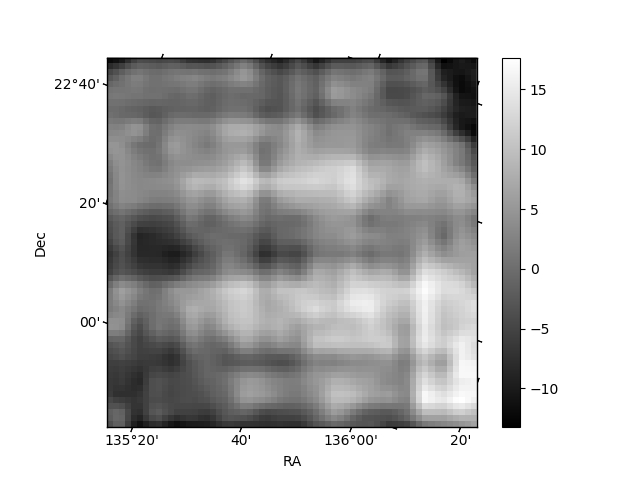
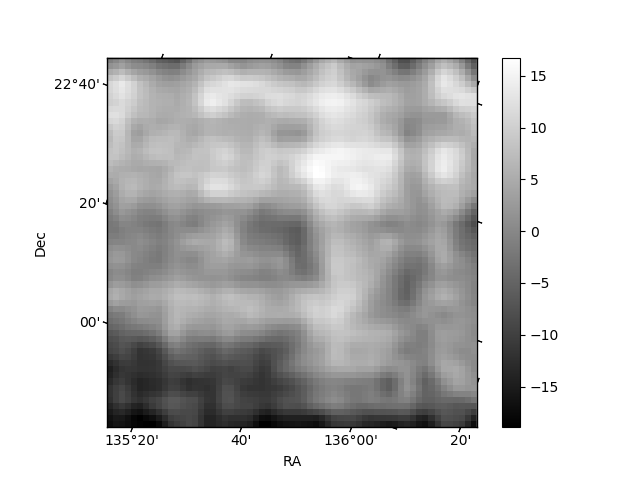
Histogram calculated using DETX and DETY for each event in the final _common_clean file
| Quadrant A | 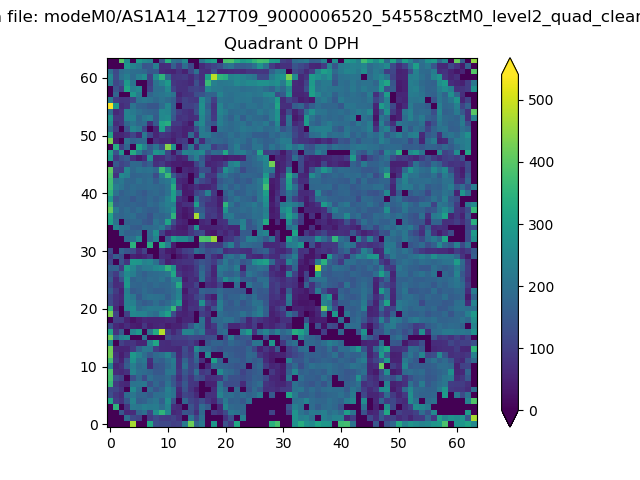 |
 |
Quadrant B |
|---|---|---|---|
| Quadrant D | 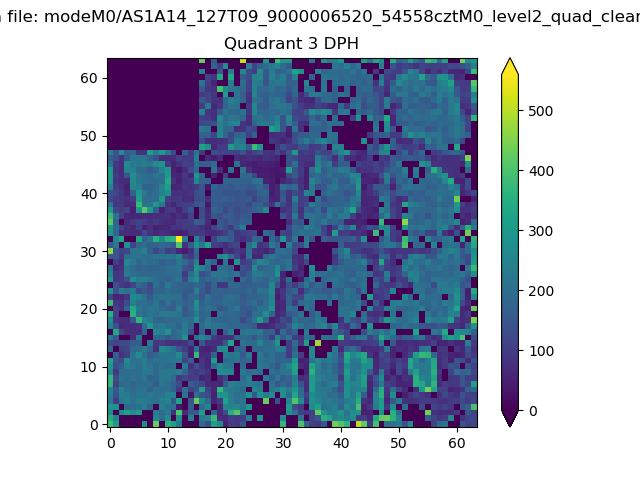 |
 |
Quadrant C |
| Plot type | Count rate plots | Images |
|---|---|---|
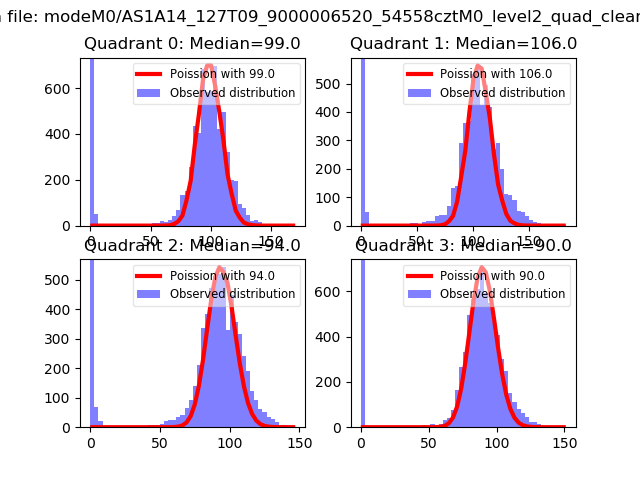
| Comparison with Poisson distribution Blue bars denote a histogram of data divided into 1 sec bins. Red curve is a Poisson curve with rate = median count rate of data. |
 |
 |
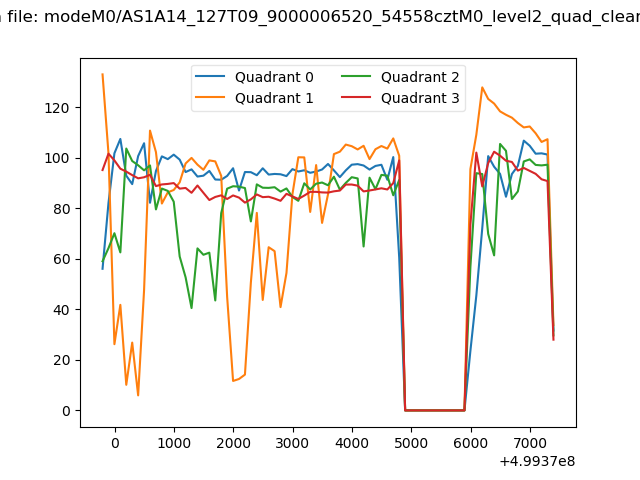
| Quadrant-wise count rates Data is divided into 100 sec bins |
 |
|
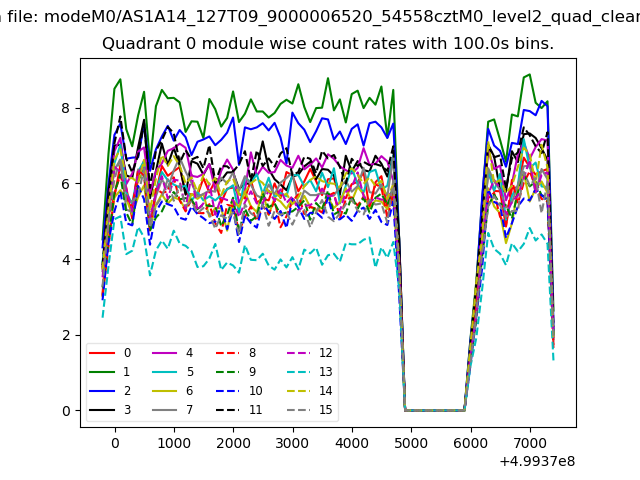
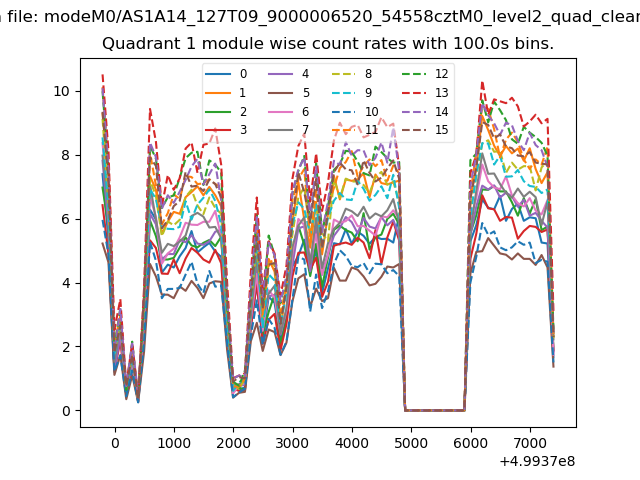
| Module-wise count rates for Quadrant A Data is divided into 100 sec bins |
 |
 |
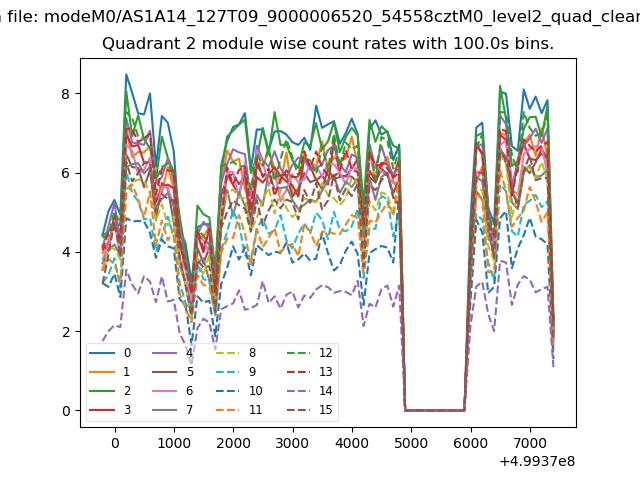
| Module-wise count rates for Quadrant B Data is divided into 100 sec bins |
 |
 |
| Module-wise count rates for Quadrant C Data is divided into 100 sec bins |
 |
 |
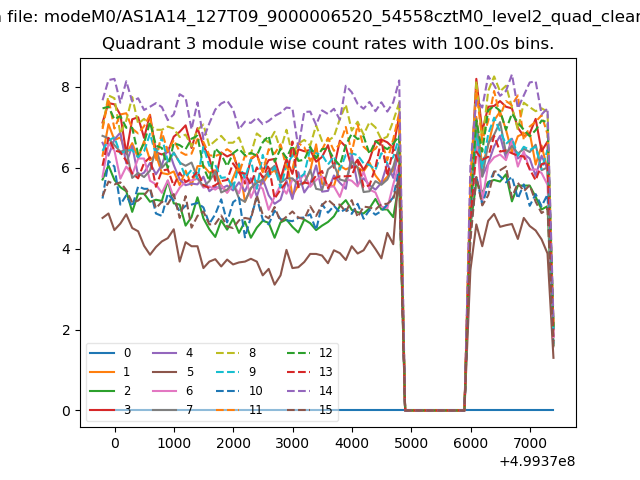
| Module-wise count rates for Quadrant D Data is divided into 100 sec bins |
 |
 |
| Parameter | Plot |
|---|---|
| CZT HV Monitor | 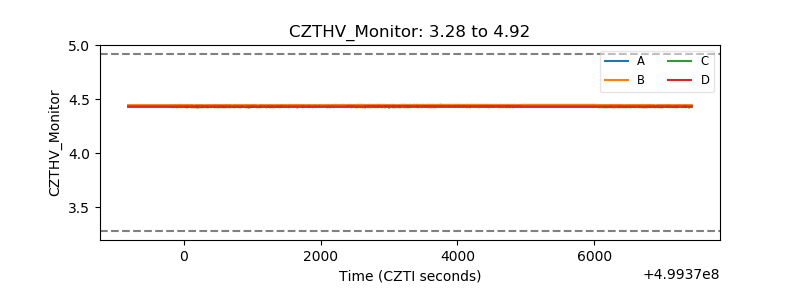 |
| D_VDD | 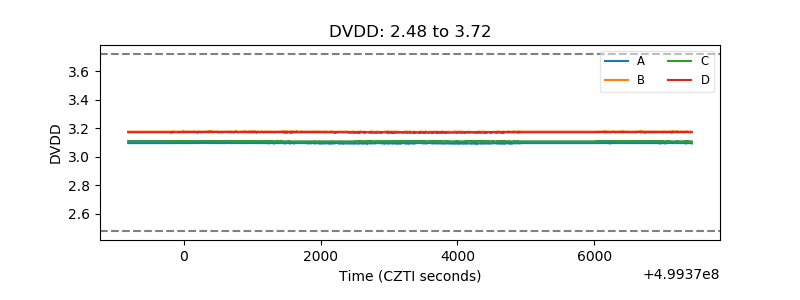 |
| Temperature 1 | 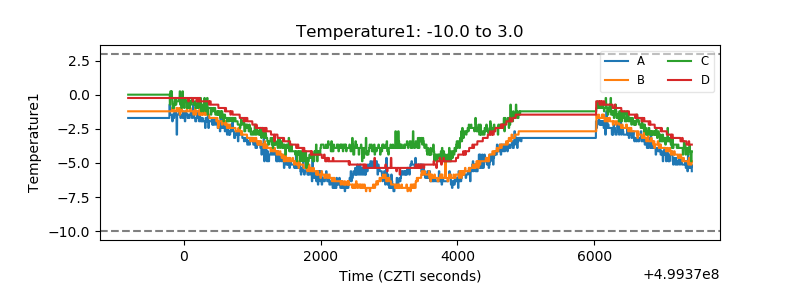 |
| Veto HV Monitor | 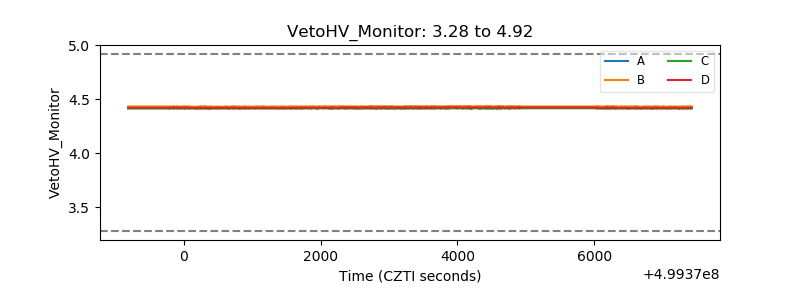 |
| Veto LLD | 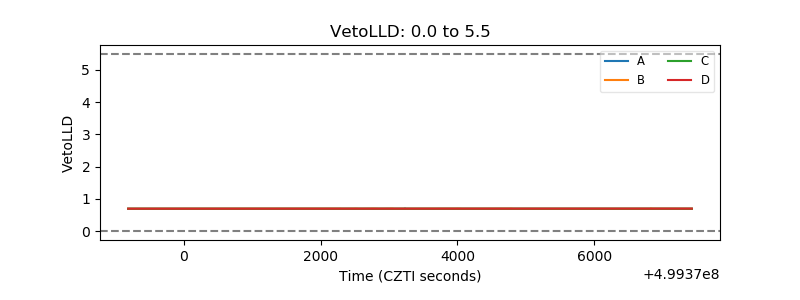 |
| Alpha Counter | 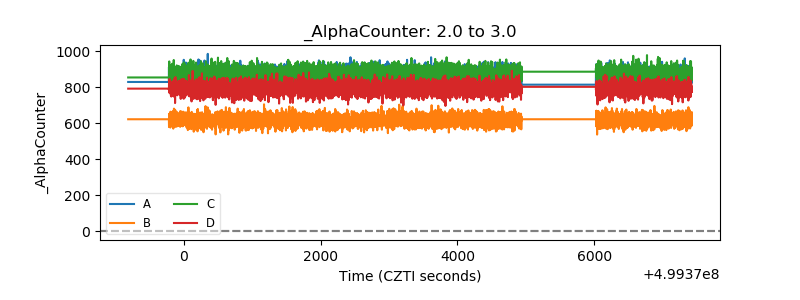 |
| _CPM_Rate | 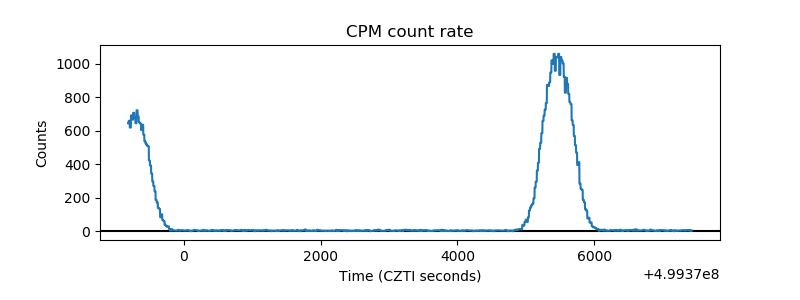 |
| CZT Counter | 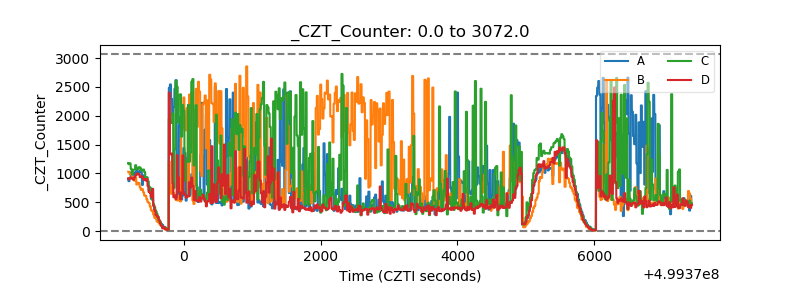 |
| +2.5 Volts monitor |  |
| +5 Volts monitor |  |
| _ROLL_ROT | 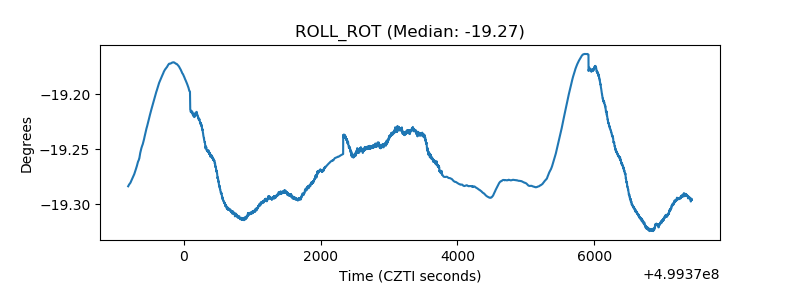 |
| _Roll_DEC | 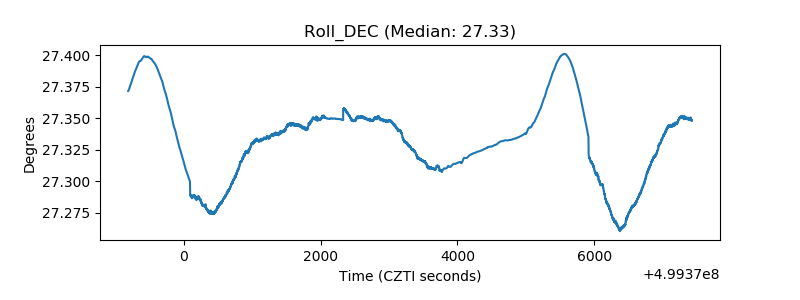 |
| _Roll_RA | 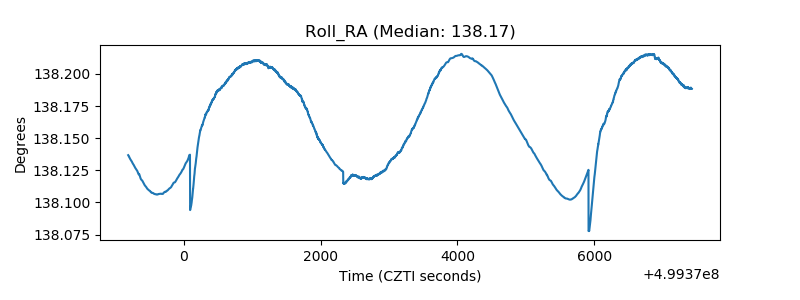 |
| Veto Counter | 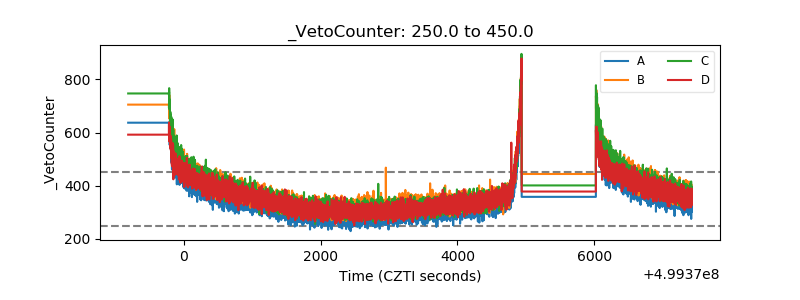 |