| Param | Original file | Final file |
|---|---|---|
| Filename | modeM0/AS1A14_127T09_9000006520_54559cztM0_level2.fits | modeM0/AS1A14_127T09_9000006520_54559cztM0_level2_quad_clean.evt |
| Size (bytes) | 479,134,080 | 98,553,600 |
| Size | 456.9 MB | 94.0 MB |
| Events in quadrant A | 4,744,325 | 639,162 |
| Events in quadrant B | 4,351,702 | 673,991 |
| Events in quadrant C | 4,023,604 | 619,761 |
| Events in quadrant D | 4,099,444 | 588,287 |
| Mode M0 | |||
|---|---|---|---|
| Quadrant | BADHDUFLAG | Total packets | Discarded packets |
| A | 0 | 18463 | 2 |
| B | 0 | 17548 | 2 |
| C | 0 | 16772 | 2 |
| D | 0 | 17152 | 3 |
| Mode SS | |||
|---|---|---|---|
| Quadrant | BADHDUFLAG | Total packets | Discarded packets |
| A | 0 | 136 | 0 |
| B | 0 | 136 | 0 |
| C | 0 | 136 | 0 |
| D | 0 | 136 | 0 |
| Mode M9 | |||
|---|---|---|---|
| Quadrant | BADHDUFLAG | Total packets | Discarded packets |
| A | 0 | 22 | 0 |
| B | 0 | 22 | 0 |
| C | 0 | 22 | 0 |
| D | 0 | 22 | 0 |
| Quadrant | Total seconds | Saturated seconds | Saturation percentage |
|---|---|---|---|
| A | 6643 | 561 | 8.444980% |
| B | 6644 | 552 | 8.308248% |
| C | 6644 | 370 | 5.568934% |
| D | 6643 | 319 | 4.802047% |
Noise dominated data is calculated using 1-second bins in cleaned event files. If a bin has >2000 counts, and if more than 50% of those come from <1% of pixels, then it is considered to be noise-dominated and hence unusable.
| Quadrant | # 1 sec bins | Bins with >0 counts | Bins with >2000 counts | High rate bins dominated by noise | Noise dominated (total time) | Noise dominated (detector-on time) | Marked lightcurve |
|---|---|---|---|---|---|---|---|
| A | 8878 | 6645 | 343 | 343 | 3.86% | 5.16% | 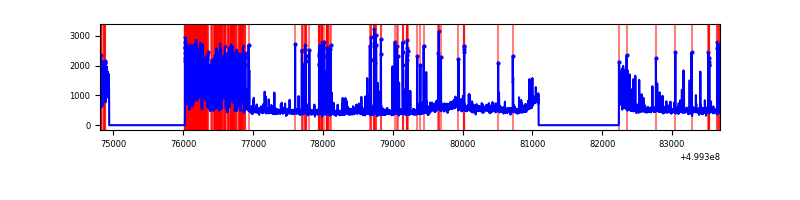 |
| B | 8879 | 6646 | 287 | 287 | 3.23% | 4.32% | 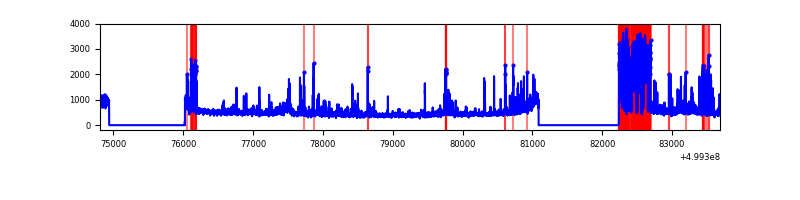 |
| C | 8879 | 6646 | 213 | 213 | 2.40% | 3.20% | 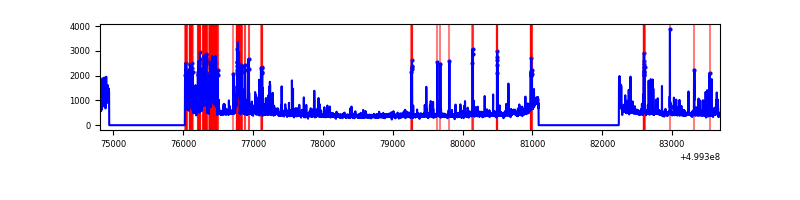 |
| D | 8878 | 6645 | 190 | 190 | 2.14% | 2.86% | 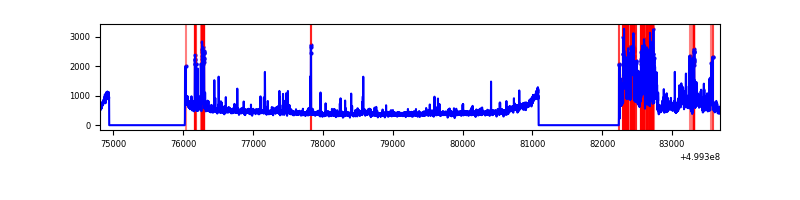 |
Top three noisy pixels from each quadrant. If the there are fewer than three noisy pixels in the level2.evt file, extra rows are filled as -1
| Pixel properties | Quadrant properties | ||||||
|---|---|---|---|---|---|---|---|
| Quadrant | DetID | PixID | Counts | Sigma | Mean | Median | Sigma |
| A | 3 | 14 | 1137604 | 6139.53 | 749 | 730 | 185.2 |
| A | 11 | 3 | 351722 | 1895.48 | 749 | 730 | 185.2 |
| A | 14 | 235 | 230355 | 1240.06 | 749 | 730 | 185.2 |
| B | 8 | 234 | 827540 | 5380.98 | 725 | 700 | 153.7 |
| B | 0 | 213 | 200336 | 1299.21 | 725 | 700 | 153.7 |
| B | 10 | 14 | 168366 | 1091.15 | 725 | 700 | 153.7 |
| C | 12 | 254 | 506245 | 2493.45 | 739 | 733 | 202.7 |
| C | 12 | 249 | 138489 | 679.48 | 739 | 733 | 202.7 |
| C | 13 | 3 | 131709 | 646.04 | 739 | 733 | 202.7 |
| D | 15 | 94 | 610041 | 2886.92 | 741 | 708 | 211.1 |
| D | 2 | 172 | 240974 | 1138.34 | 741 | 708 | 211.1 |
| D | 1 | 3 | 87703 | 412.17 | 741 | 708 | 211.1 |
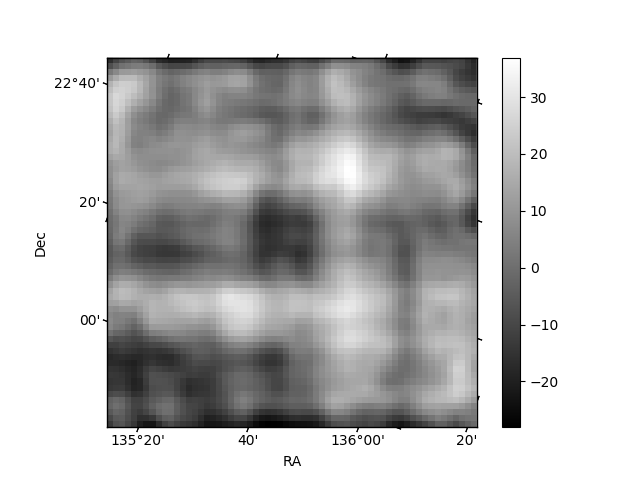
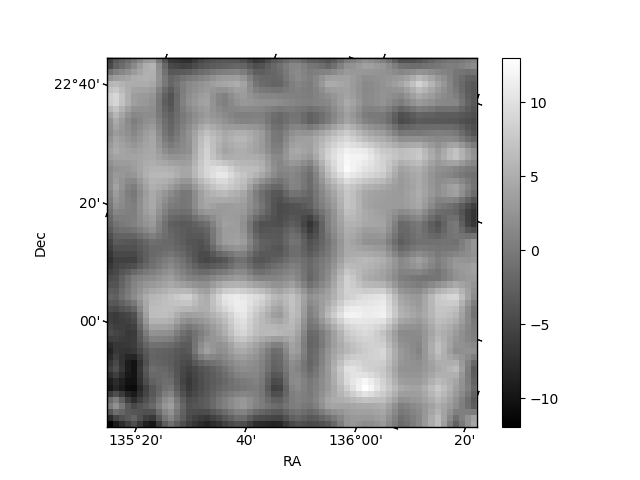
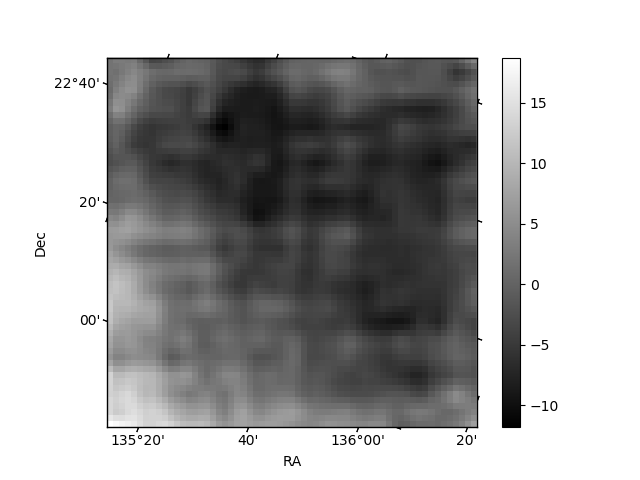
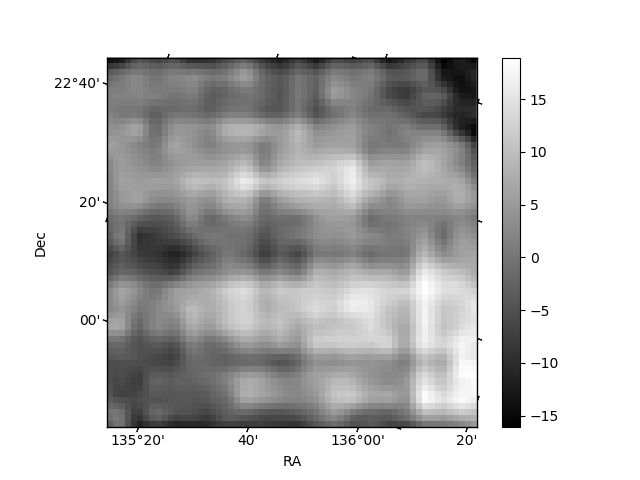
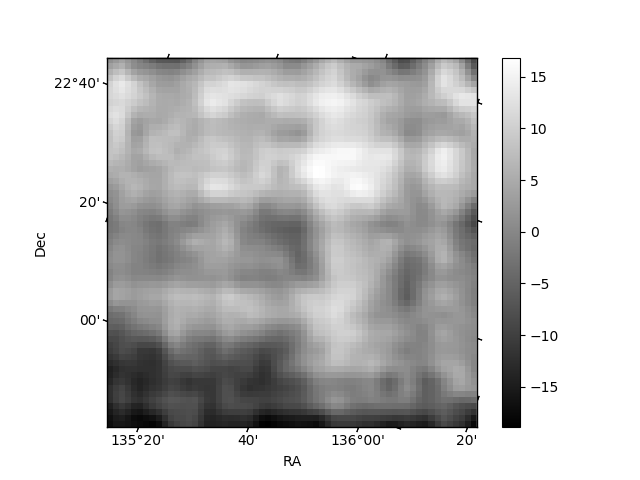
Histogram calculated using DETX and DETY for each event in the final _common_clean file
| Quadrant A | 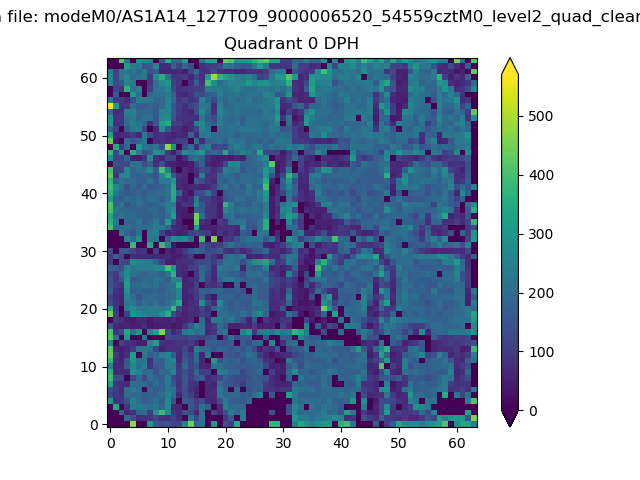 |
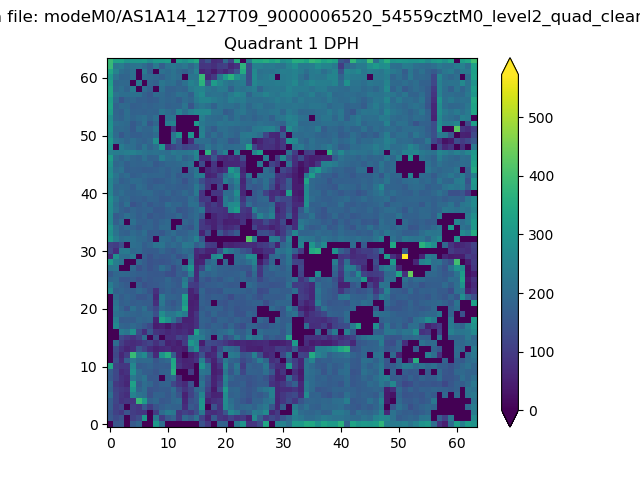 |
Quadrant B |
|---|---|---|---|
| Quadrant D | 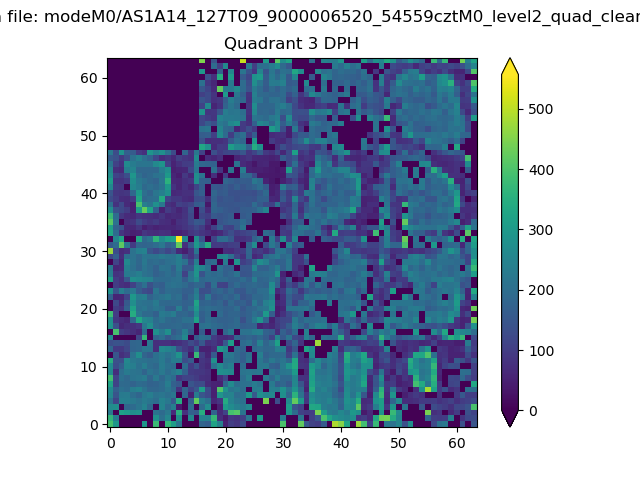 |
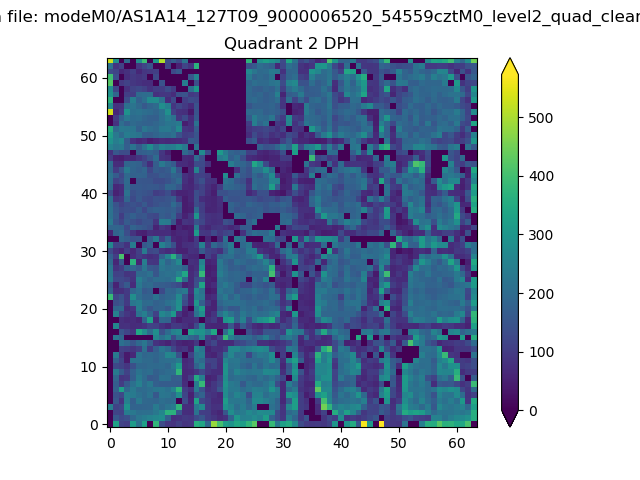 |
Quadrant C |
| Plot type | Count rate plots | Images |
|---|---|---|
| Comparison with Poisson distribution Blue bars denote a histogram of data divided into 1 sec bins. Red curve is a Poisson curve with rate = median count rate of data. |
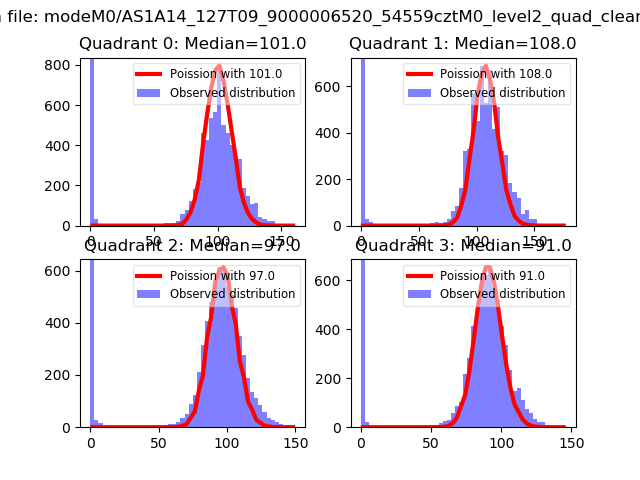 |
 |
| Quadrant-wise count rates Data is divided into 100 sec bins |
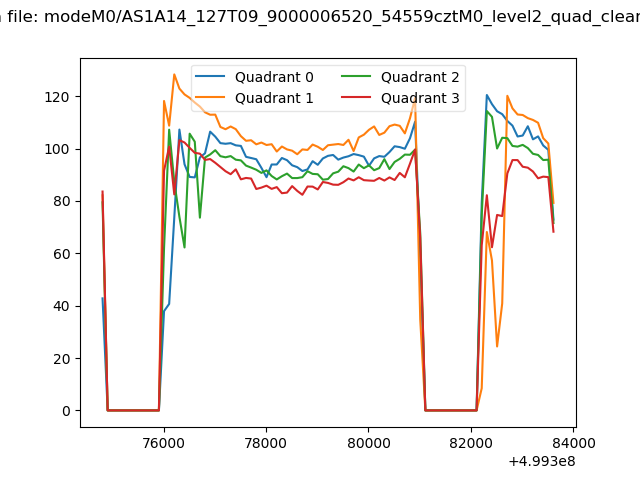 |
|
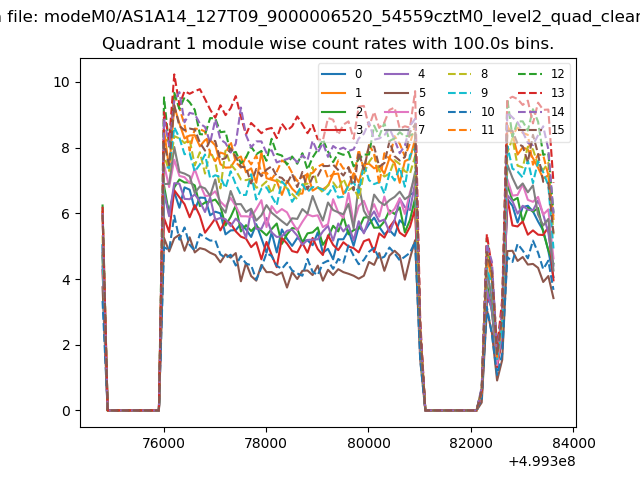
| Module-wise count rates for Quadrant A Data is divided into 100 sec bins |
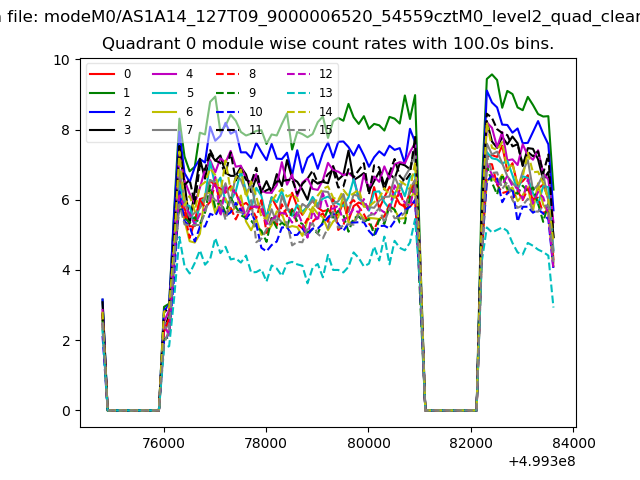 |
 |
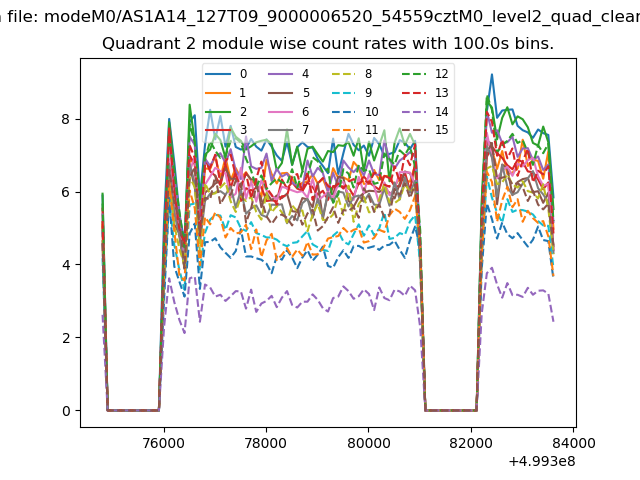
| Module-wise count rates for Quadrant B Data is divided into 100 sec bins |
 |
 |
| Module-wise count rates for Quadrant C Data is divided into 100 sec bins |
 |
 |
| Module-wise count rates for Quadrant D Data is divided into 100 sec bins |
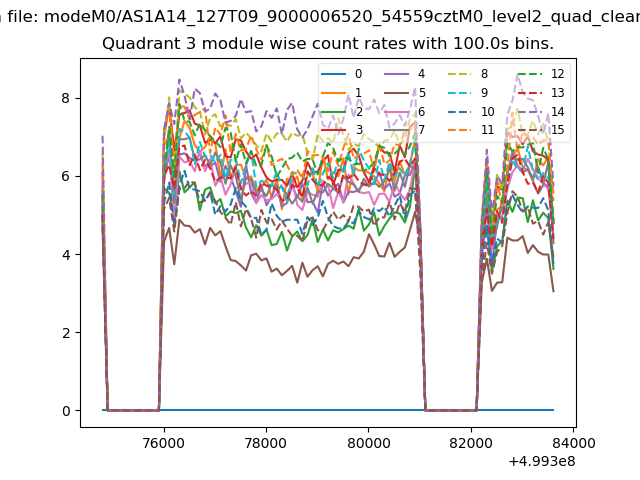 |
 |
| Parameter | Plot |
|---|---|
| CZT HV Monitor | 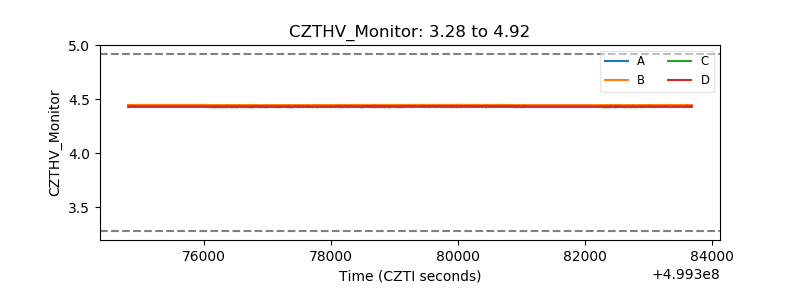 |
| D_VDD | 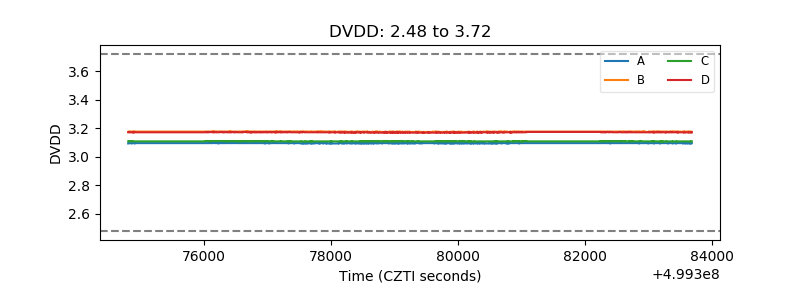 |
| Temperature 1 | 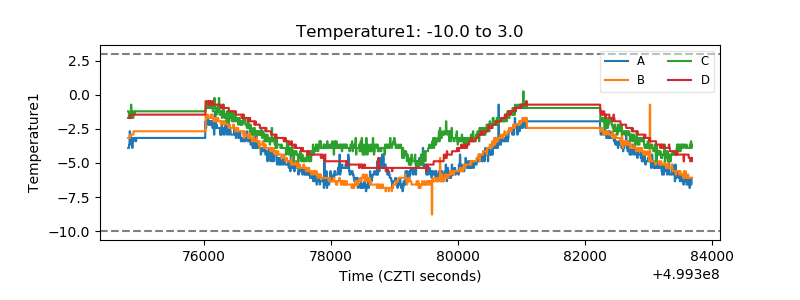 |
| Veto HV Monitor |  |
| Veto LLD | 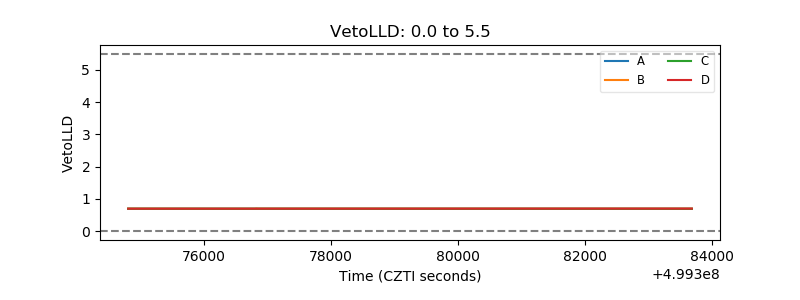 |
| Alpha Counter | 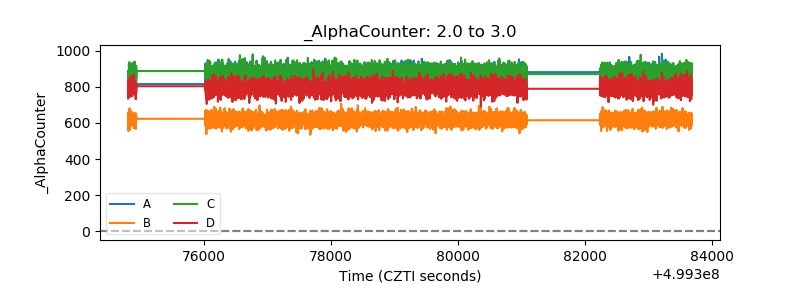 |
| _CPM_Rate | 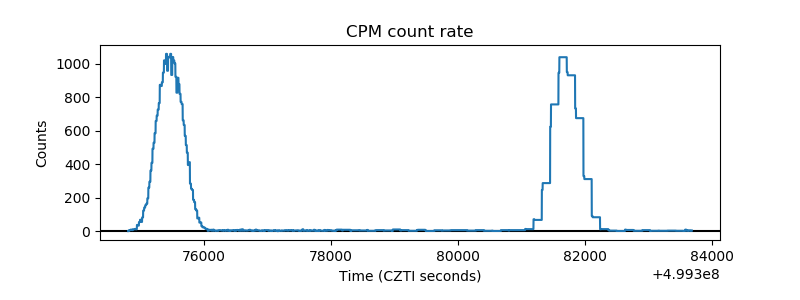 |
| CZT Counter | 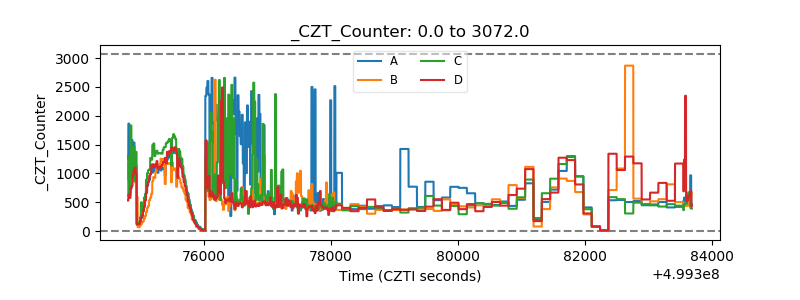 |
| +2.5 Volts monitor | 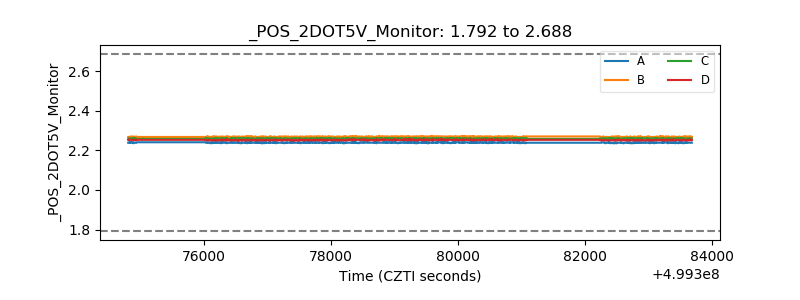 |
| +5 Volts monitor | 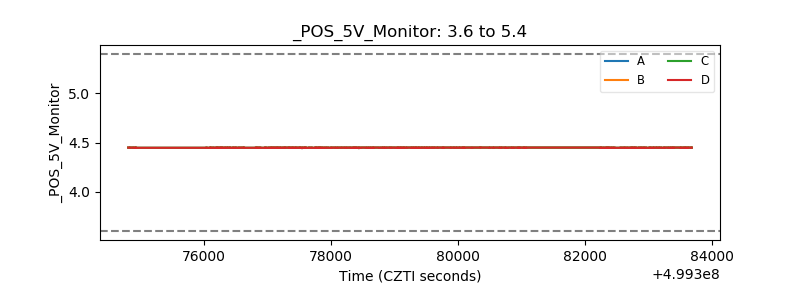 |
| _ROLL_ROT | 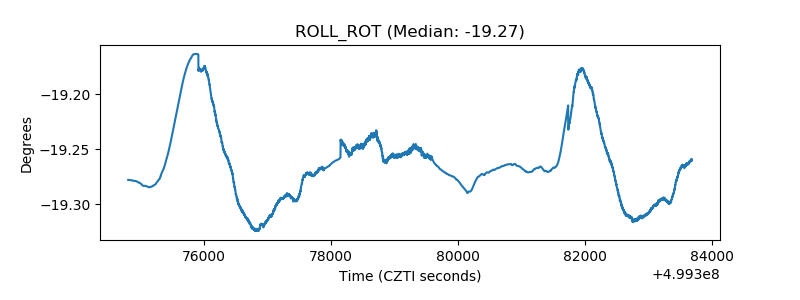 |
| _Roll_DEC | 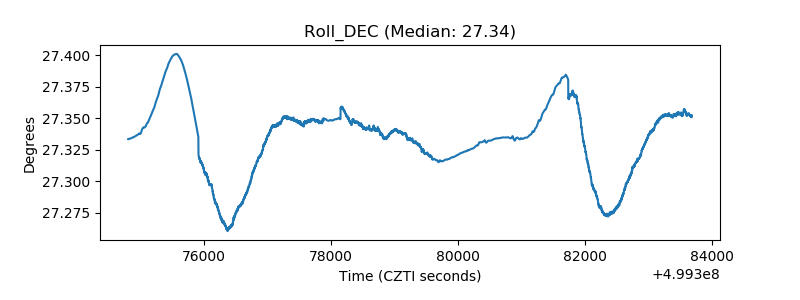 |
| _Roll_RA | 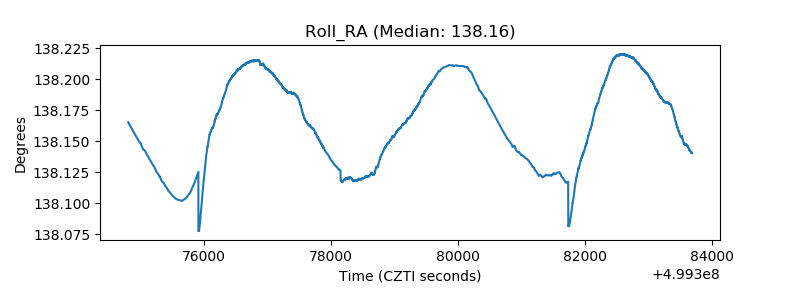 |
| Veto Counter | 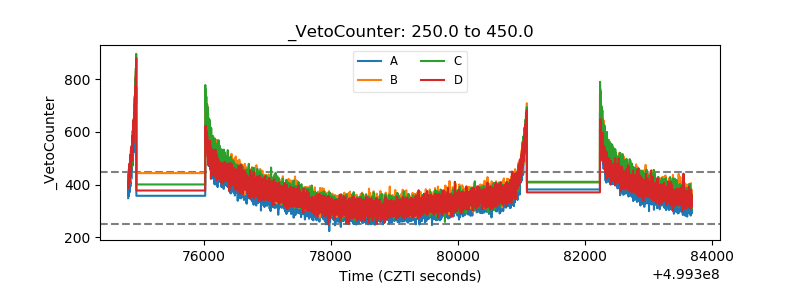 |