| Param | Original file | Final file |
|---|---|---|
| Filename | modeM0/AS1A14_127T09_9000006520_54560cztM0_level2.fits | modeM0/AS1A14_127T09_9000006520_54560cztM0_level2_quad_clean.evt |
| Size (bytes) | 434,620,800 | 93,873,600 |
| Size | 414.5 MB | 89.5 MB |
| Events in quadrant A | 3,602,106 | 626,831 |
| Events in quadrant B | 4,164,103 | 634,699 |
| Events in quadrant C | 3,185,754 | 605,794 |
| Events in quadrant D | 4,646,076 | 535,312 |
| Mode M0 | |||
|---|---|---|---|
| Quadrant | BADHDUFLAG | Total packets | Discarded packets |
| A | 0 | 14992 | 2 |
| B | 0 | 16985 | 3 |
| C | 0 | 14023 | 2 |
| D | 0 | 18255 | 2 |
| Mode SS | |||
|---|---|---|---|
| Quadrant | BADHDUFLAG | Total packets | Discarded packets |
| A | 0 | 128 | 0 |
| B | 0 | 128 | 0 |
| C | 0 | 128 | 0 |
| D | 0 | 128 | 0 |
| Mode M9 | |||
|---|---|---|---|
| Quadrant | BADHDUFLAG | Total packets | Discarded packets |
| A | 0 | 16 | 0 |
| B | 0 | 17 | 0 |
| C | 0 | 17 | 0 |
| D | 0 | 17 | 0 |
| Quadrant | Total seconds | Saturated seconds | Saturation percentage |
|---|---|---|---|
| A | 6303 | 222 | 3.522132% |
| B | 6302 | 516 | 8.187877% |
| C | 6302 | 102 | 1.618534% |
| D | 6302 | 466 | 7.394478% |
Noise dominated data is calculated using 1-second bins in cleaned event files. If a bin has >2000 counts, and if more than 50% of those come from <1% of pixels, then it is considered to be noise-dominated and hence unusable.
| Quadrant | # 1 sec bins | Bins with >0 counts | Bins with >2000 counts | High rate bins dominated by noise | Noise dominated (total time) | Noise dominated (detector-on time) | Marked lightcurve |
|---|---|---|---|---|---|---|---|
| A | 7488 | 6304 | 133 | 133 | 1.78% | 2.11% | 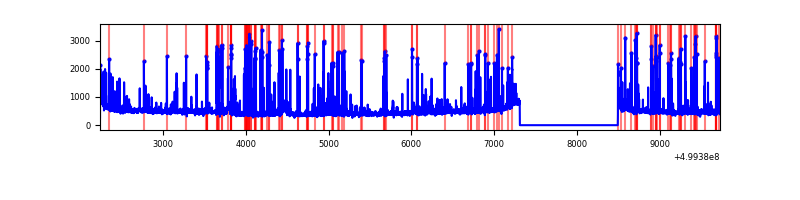 |
| B | 7487 | 6303 | 284 | 284 | 3.79% | 4.51% | 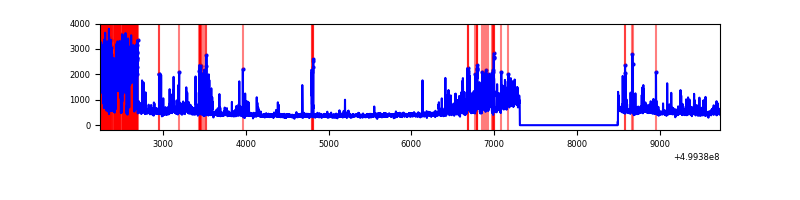 |
| C | 7487 | 6303 | 39 | 39 | 0.52% | 0.62% | 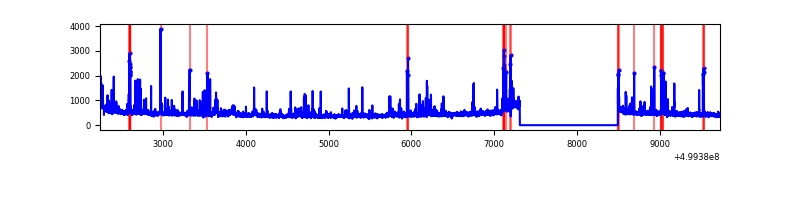 |
| D | 7487 | 6303 | 370 | 370 | 4.94% | 5.87% | 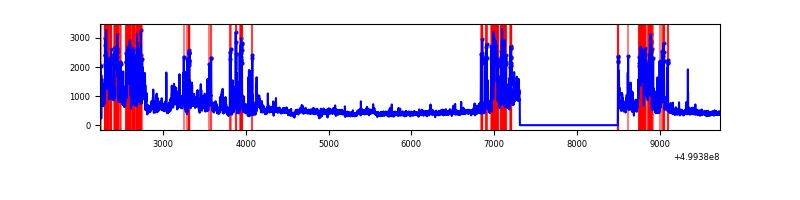 |
Top three noisy pixels from each quadrant. If the there are fewer than three noisy pixels in the level2.evt file, extra rows are filled as -1
| Pixel properties | Quadrant properties | ||||||
|---|---|---|---|---|---|---|---|
| Quadrant | DetID | PixID | Counts | Sigma | Mean | Median | Sigma |
| A | 11 | 3 | 523975 | 3027.4 | 703 | 688 | 172.9 |
| A | 3 | 14 | 155824 | 897.52 | 703 | 688 | 172.9 |
| A | 14 | 235 | 80336 | 460.79 | 703 | 688 | 172.9 |
| B | 8 | 234 | 768065 | 5416.88 | 665 | 642 | 141.7 |
| B | 10 | 14 | 306734 | 2160.56 | 665 | 642 | 141.7 |
| B | 0 | 213 | 177698 | 1249.76 | 665 | 642 | 141.7 |
| C | 1 | 45 | 110154 | 573.01 | 690 | 682 | 191.0 |
| C | 13 | 3 | 106709 | 554.97 | 690 | 682 | 191.0 |
| C | 6 | 223 | 79165 | 410.8 | 690 | 682 | 191.0 |
| D | 15 | 94 | 1464367 | 7727.52 | 664 | 632 | 189.4 |
| D | 2 | 172 | 349990 | 1844.37 | 664 | 632 | 189.4 |
| D | 1 | 3 | 129378 | 679.69 | 664 | 632 | 189.4 |
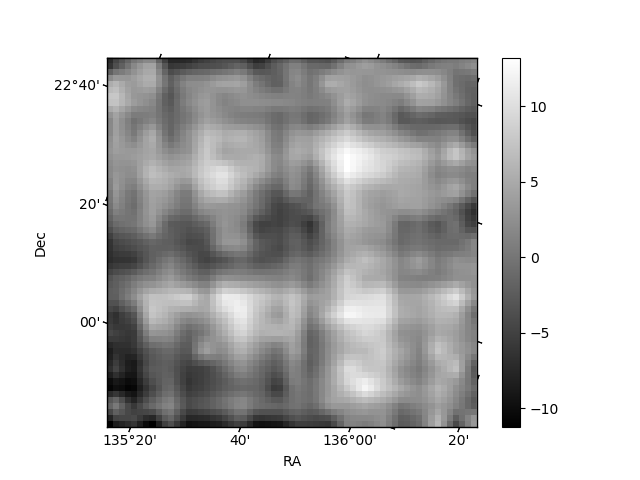
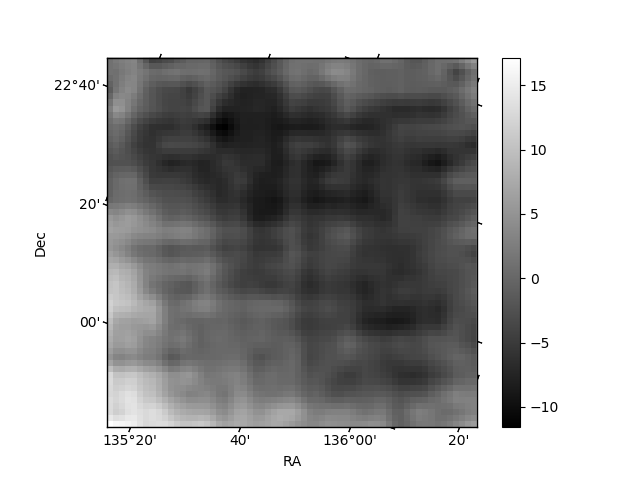
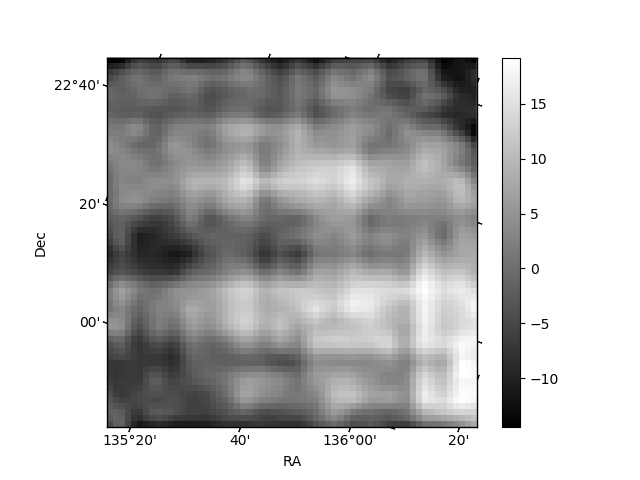
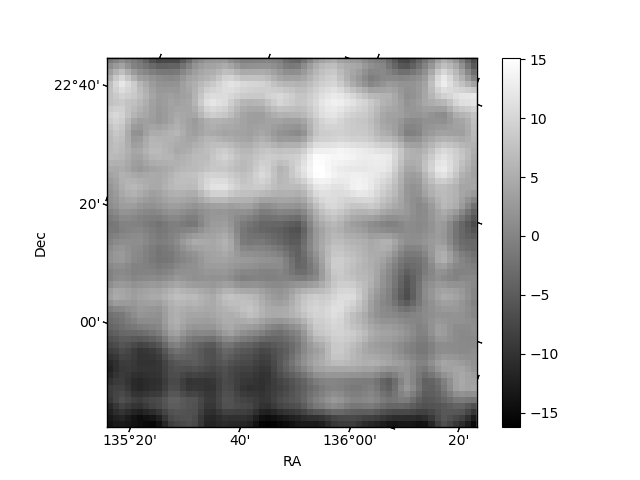
Histogram calculated using DETX and DETY for each event in the final _common_clean file
| Quadrant A | 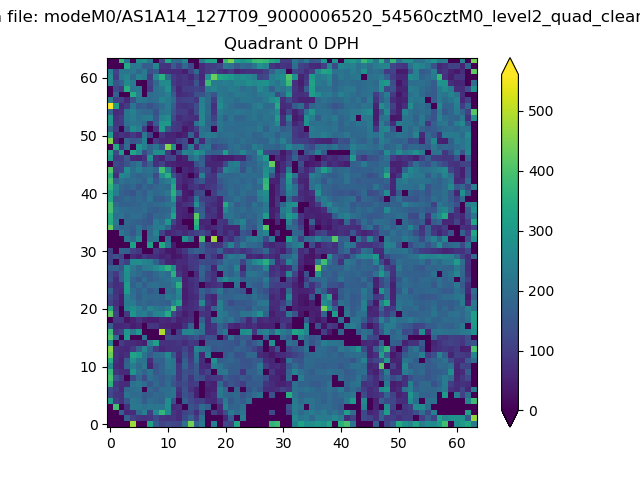 |
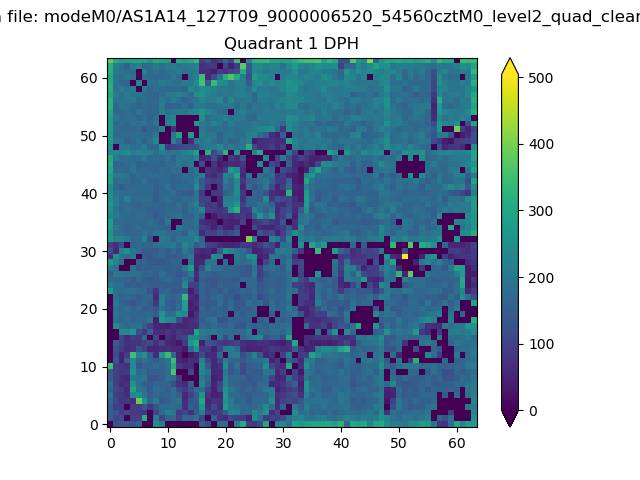 |
Quadrant B |
|---|---|---|---|
| Quadrant D | 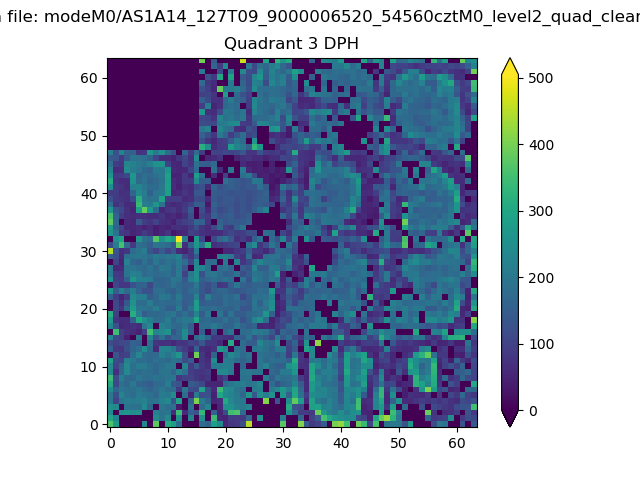 |
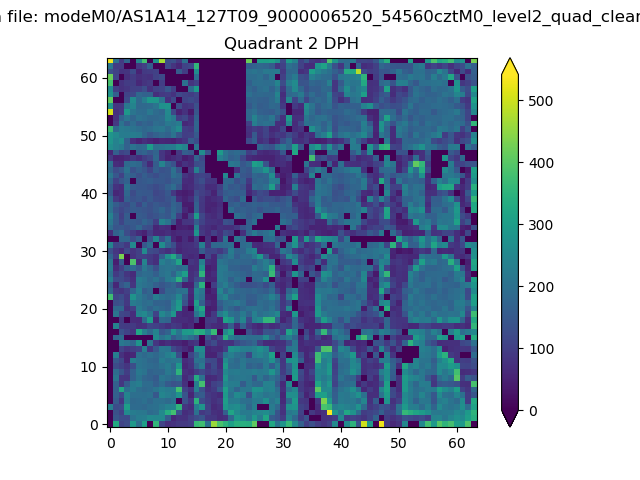 |
Quadrant C |
| Plot type | Count rate plots | Images |
|---|---|---|
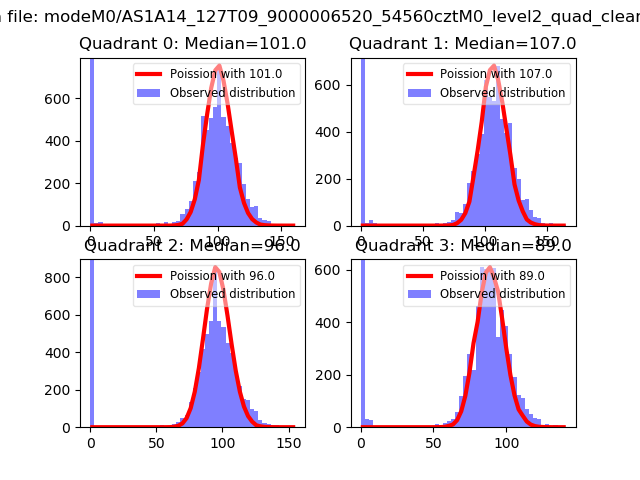
| Comparison with Poisson distribution Blue bars denote a histogram of data divided into 1 sec bins. Red curve is a Poisson curve with rate = median count rate of data. |
 |
 |
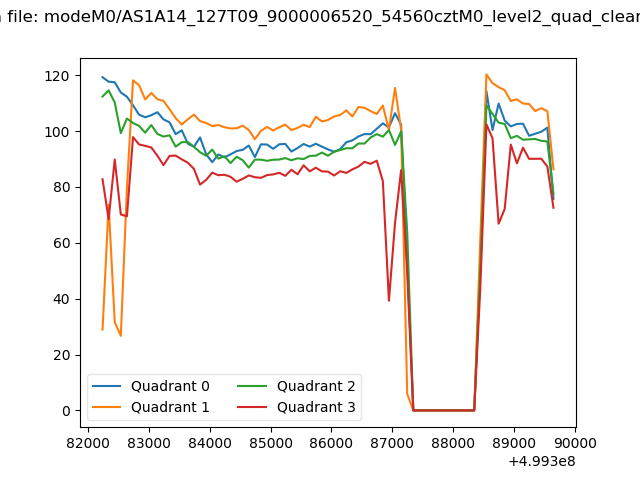
| Quadrant-wise count rates Data is divided into 100 sec bins |
 |
|
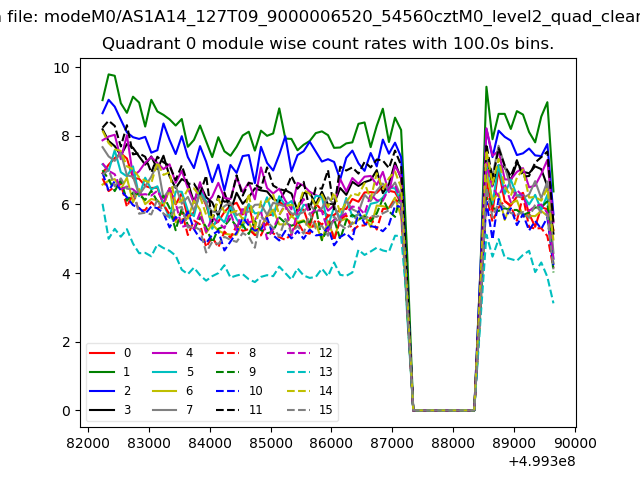
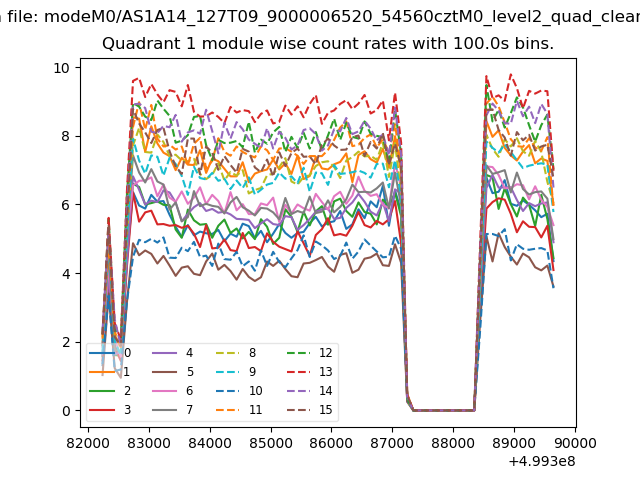
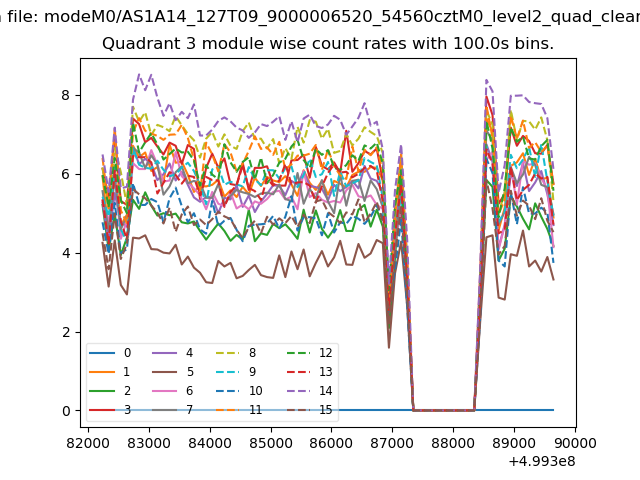
| Module-wise count rates for Quadrant A Data is divided into 100 sec bins |
 |
 |
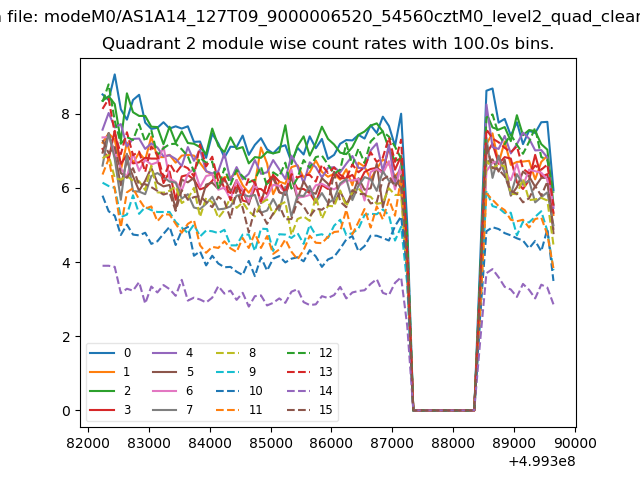
| Module-wise count rates for Quadrant B Data is divided into 100 sec bins |
 |
 |
| Module-wise count rates for Quadrant C Data is divided into 100 sec bins |
 |
 |
| Module-wise count rates for Quadrant D Data is divided into 100 sec bins |
 |
 |
| Parameter | Plot |
|---|---|
| CZT HV Monitor | 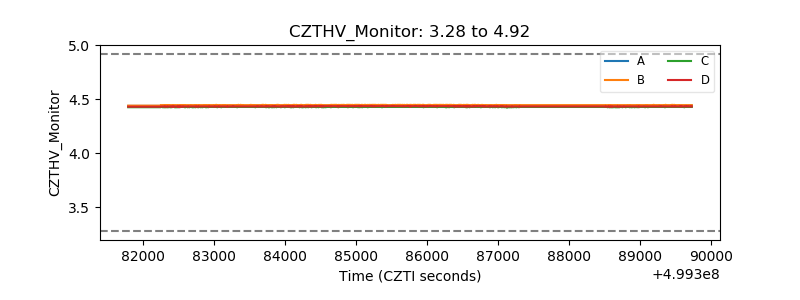 |
| D_VDD | 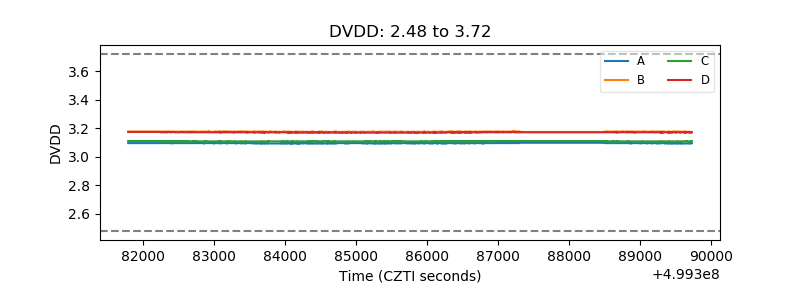 |
| Temperature 1 | 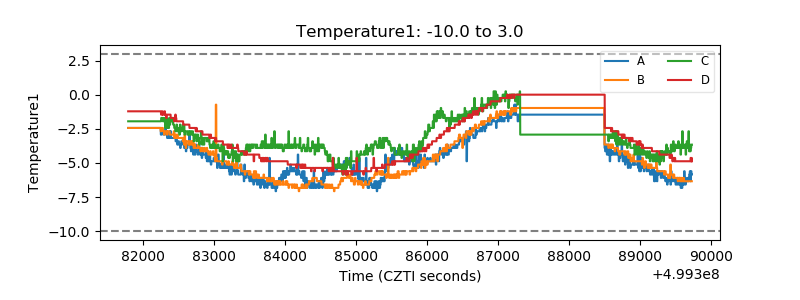 |
| Veto HV Monitor | 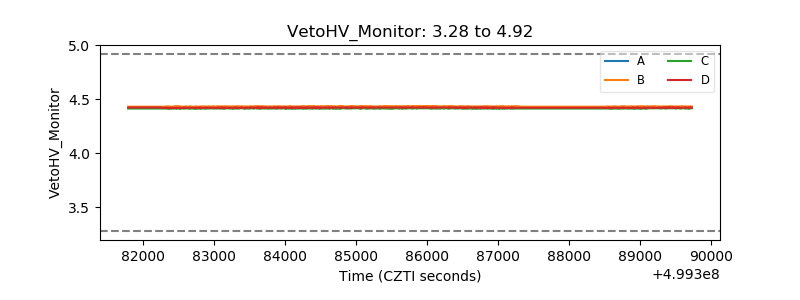 |
| Veto LLD | 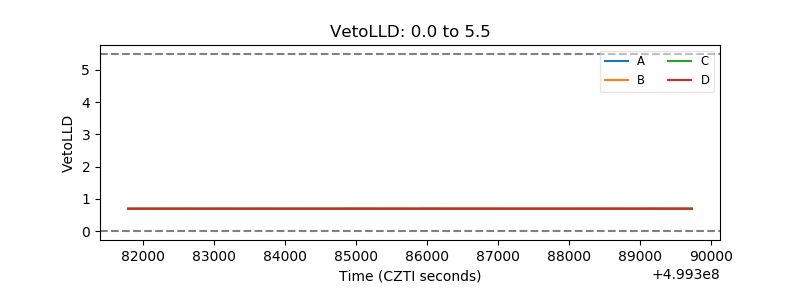 |
| Alpha Counter | 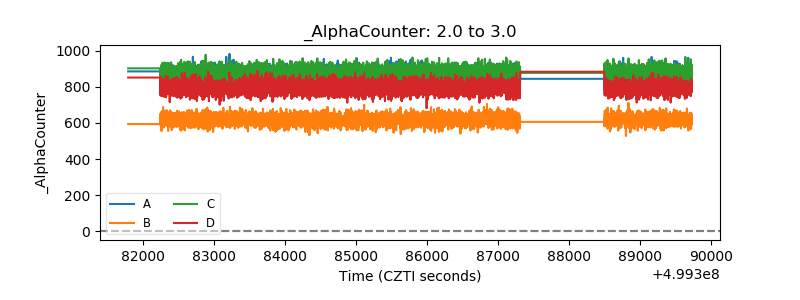 |
| _CPM_Rate | 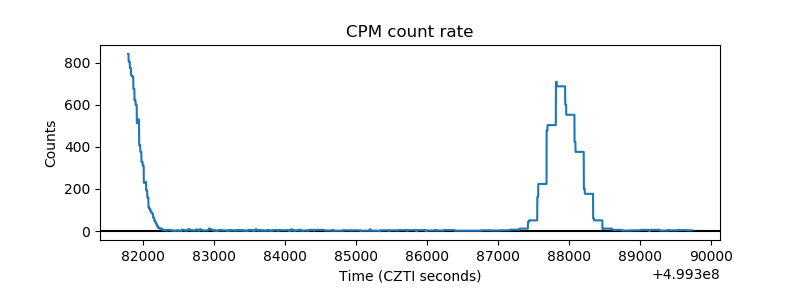 |
| CZT Counter | 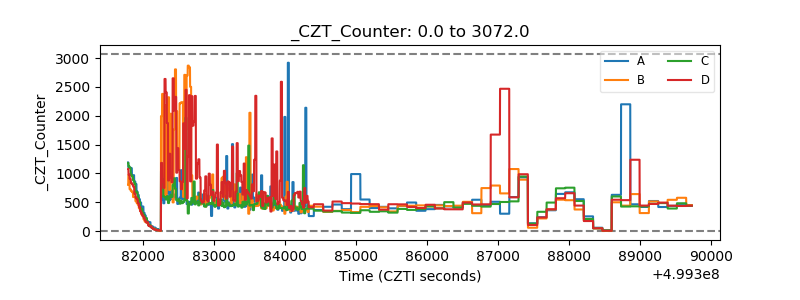 |
| +2.5 Volts monitor |  |
| +5 Volts monitor |  |
| _ROLL_ROT | 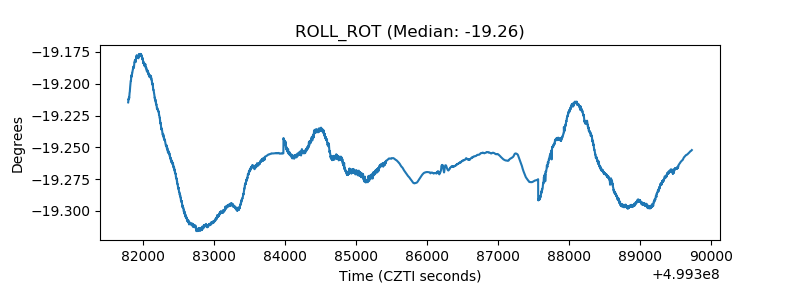 |
| _Roll_DEC | 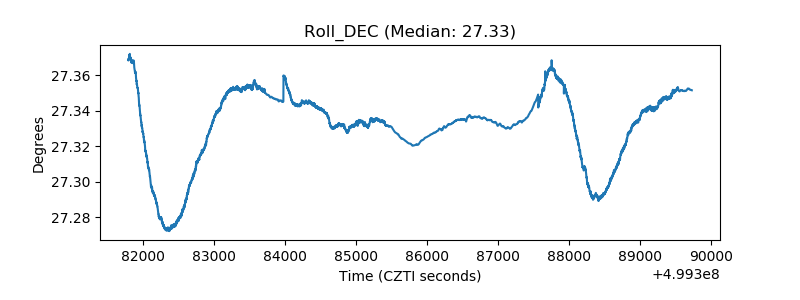 |
| _Roll_RA | 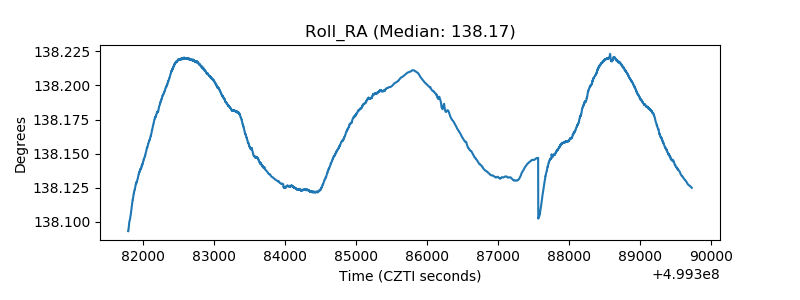 |
| Veto Counter | 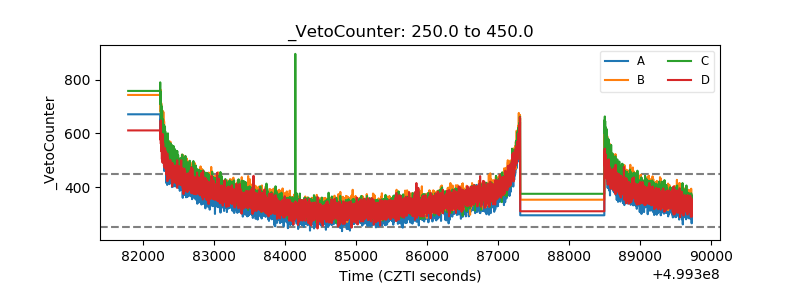 |