| Param | Original file | Final file |
|---|---|---|
| Filename | modeM0/AS1A14_127T09_9000006520_54561cztM0_level2.fits | modeM0/AS1A14_127T09_9000006520_54561cztM0_level2_quad_clean.evt |
| Size (bytes) | 454,870,080 | 108,604,800 |
| Size | 433.8 MB | 103.6 MB |
| Events in quadrant A | 3,892,062 | 711,459 |
| Events in quadrant B | 4,255,734 | 758,693 |
| Events in quadrant C | 3,645,571 | 688,163 |
| Events in quadrant D | 4,476,581 | 622,194 |
| Mode M0 | |||
|---|---|---|---|
| Quadrant | BADHDUFLAG | Total packets | Discarded packets |
| A | 0 | 16808 | 2 |
| B | 0 | 17933 | 2 |
| C | 0 | 16088 | 2 |
| D | 0 | 18749 | 2 |
| Mode SS | |||
|---|---|---|---|
| Quadrant | BADHDUFLAG | Total packets | Discarded packets |
| A | 0 | 148 | 0 |
| B | 0 | 150 | 0 |
| C | 0 | 150 | 0 |
| D | 0 | 150 | 0 |
| Mode M9 | |||
|---|---|---|---|
| Quadrant | BADHDUFLAG | Total packets | Discarded packets |
| A | 0 | 23 | 0 |
| B | 0 | 23 | 0 |
| C | 0 | 23 | 0 |
| D | 0 | 23 | 0 |
| Quadrant | Total seconds | Saturated seconds | Saturation percentage |
|---|---|---|---|
| A | 7300 | 223 | 3.054795% |
| B | 7301 | 292 | 3.999452% |
| C | 7300 | 87 | 1.191781% |
| D | 7300 | 324 | 4.438356% |
Noise dominated data is calculated using 1-second bins in cleaned event files. If a bin has >2000 counts, and if more than 50% of those come from <1% of pixels, then it is considered to be noise-dominated and hence unusable.
| Quadrant | # 1 sec bins | Bins with >0 counts | Bins with >2000 counts | High rate bins dominated by noise | Noise dominated (total time) | Noise dominated (detector-on time) | Marked lightcurve |
|---|---|---|---|---|---|---|---|
| A | 9571 | 7302 | 120 | 120 | 1.25% | 1.64% | 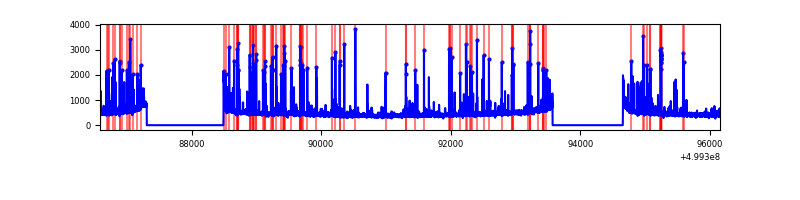 |
| B | 9571 | 7302 | 89 | 89 | 0.93% | 1.22% | 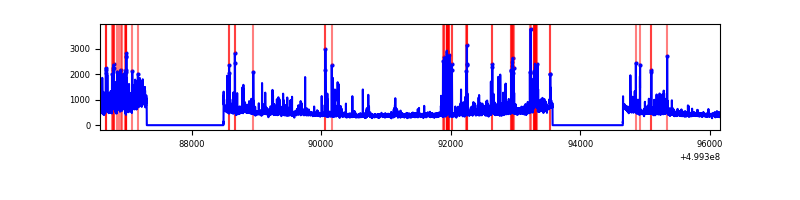 |
| C | 9570 | 7301 | 32 | 32 | 0.33% | 0.44% | 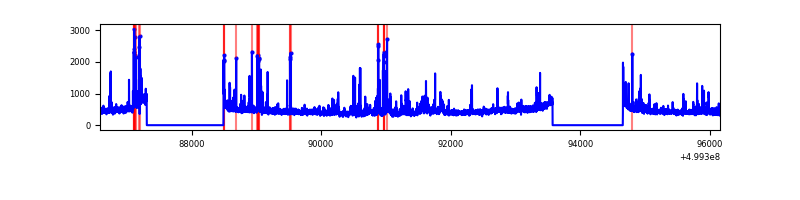 |
| D | 9570 | 7301 | 238 | 238 | 2.49% | 3.26% | 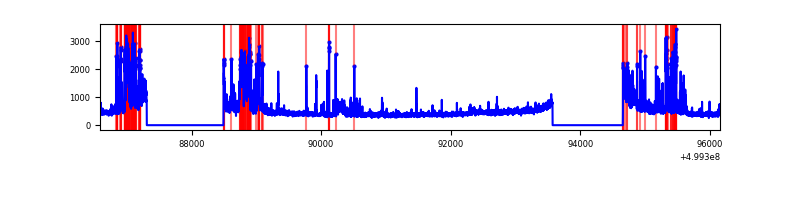 |
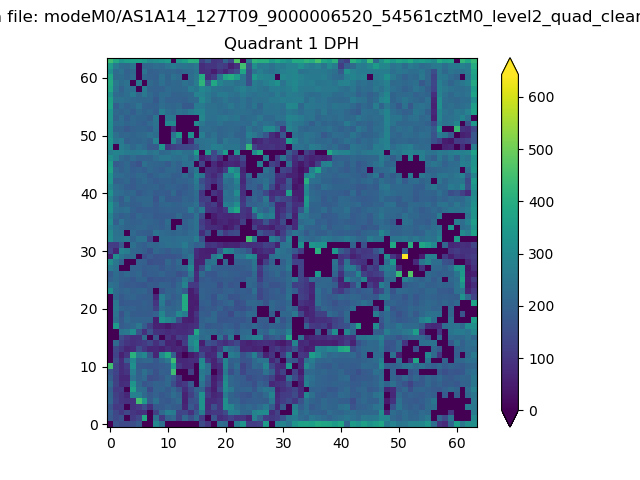
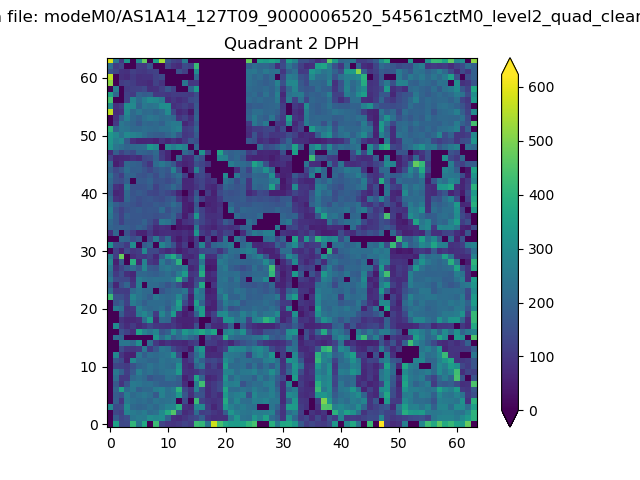
Top three noisy pixels from each quadrant. If the there are fewer than three noisy pixels in the level2.evt file, extra rows are filled as -1
| Pixel properties | Quadrant properties | ||||||
|---|---|---|---|---|---|---|---|
| Quadrant | DetID | PixID | Counts | Sigma | Mean | Median | Sigma |
| A | 11 | 3 | 476087 | 2376.09 | 810 | 791 | 200.0 |
| A | 3 | 14 | 133045 | 661.16 | 810 | 791 | 200.0 |
| A | 4 | 3 | 57409 | 283.04 | 810 | 791 | 200.0 |
| B | 10 | 14 | 310320 | 1795.07 | 803 | 774 | 172.4 |
| B | 0 | 213 | 180723 | 1043.53 | 803 | 774 | 172.4 |
| B | 1 | 207 | 172937 | 998.38 | 803 | 774 | 172.4 |
| C | 13 | 3 | 163161 | 732.92 | 798 | 788 | 221.5 |
| C | 12 | 252 | 109066 | 488.74 | 798 | 788 | 221.5 |
| C | 1 | 45 | 67733 | 302.18 | 798 | 788 | 221.5 |
| D | 15 | 94 | 912081 | 4126.69 | 776 | 741 | 220.8 |
| D | 1 | 3 | 188535 | 850.36 | 776 | 741 | 220.8 |
| D | 7 | 70 | 73132 | 327.8 | 776 | 741 | 220.8 |
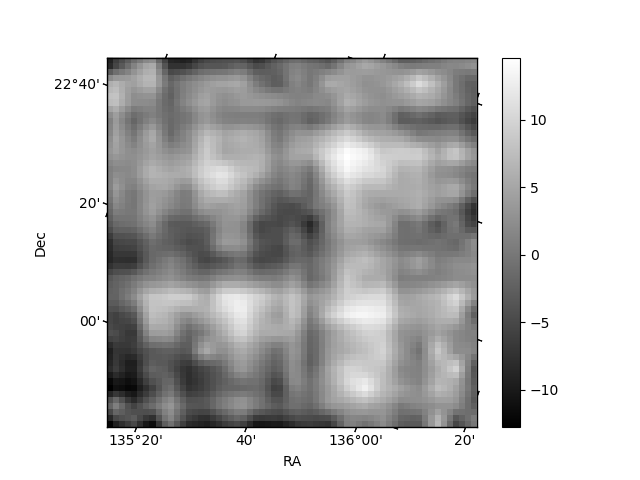
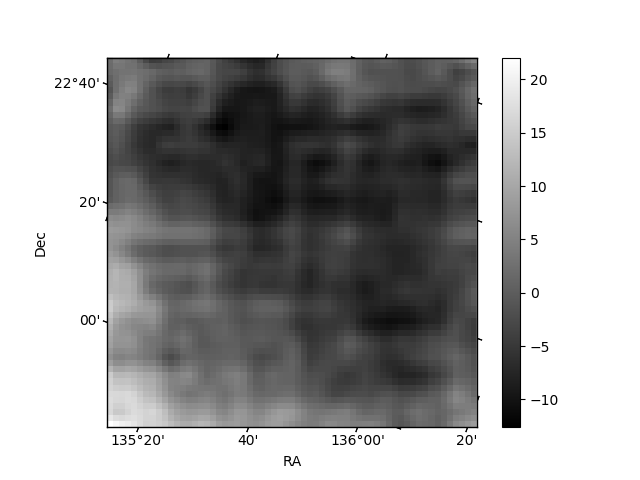
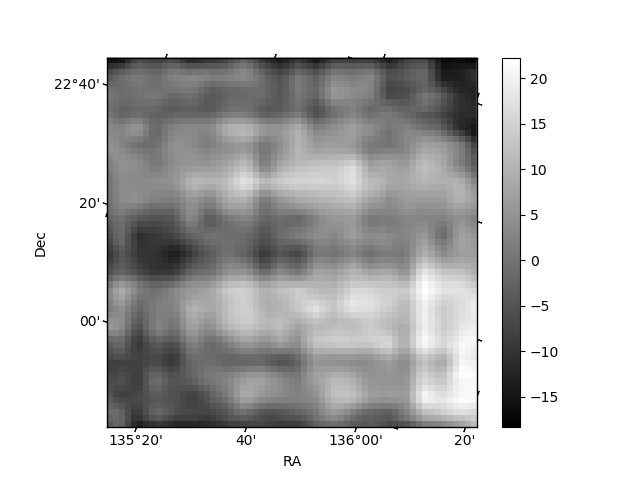
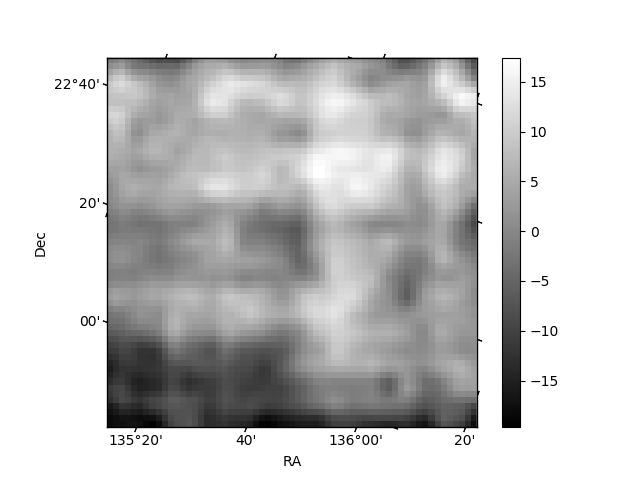
Histogram calculated using DETX and DETY for each event in the final _common_clean file
| Quadrant A | 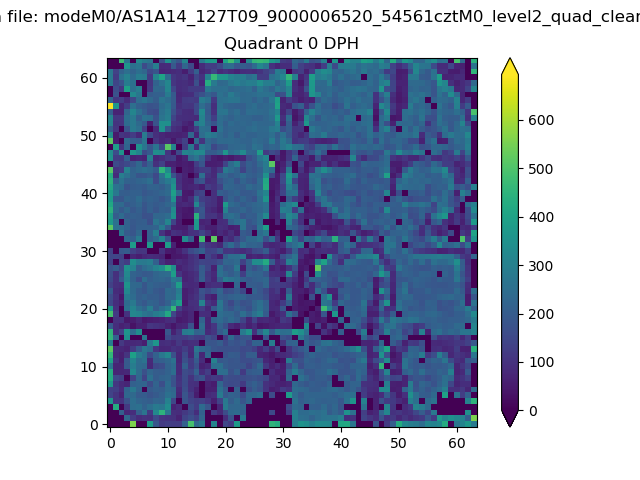 |
 |
Quadrant B |
|---|---|---|---|
| Quadrant D | 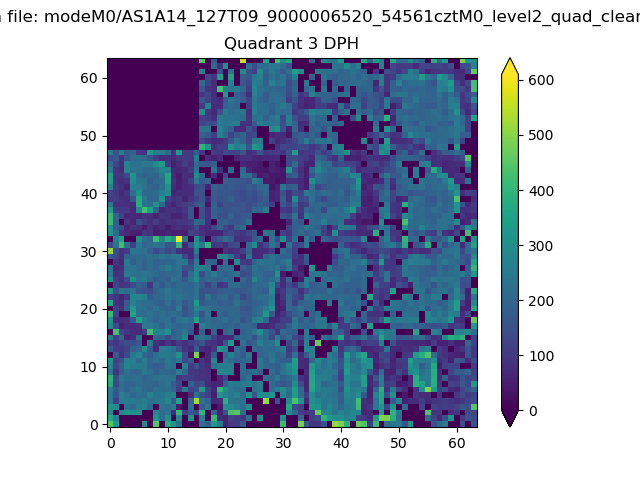 |
 |
Quadrant C |
| Plot type | Count rate plots | Images |
|---|---|---|
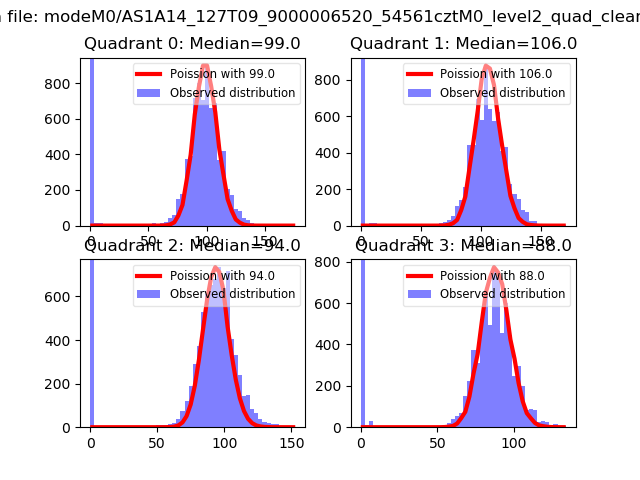
| Comparison with Poisson distribution Blue bars denote a histogram of data divided into 1 sec bins. Red curve is a Poisson curve with rate = median count rate of data. |
 |
 |
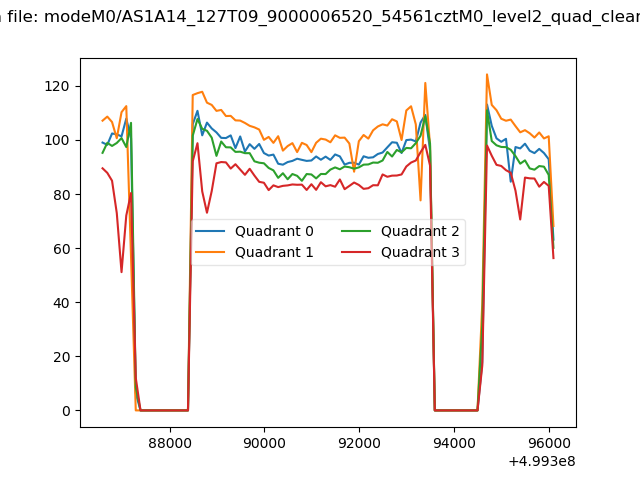
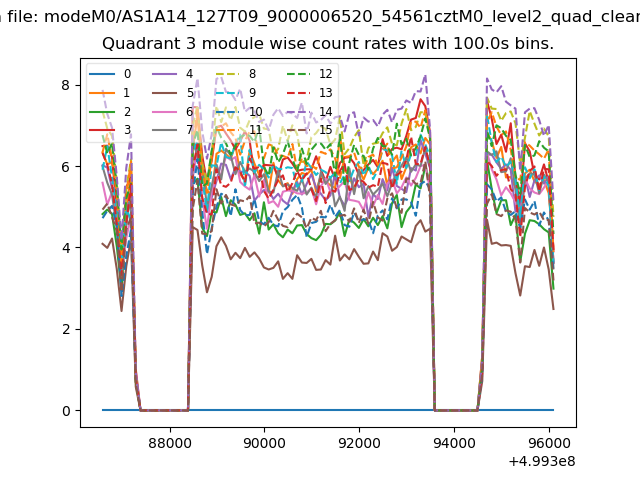
| Quadrant-wise count rates Data is divided into 100 sec bins |
 |
|
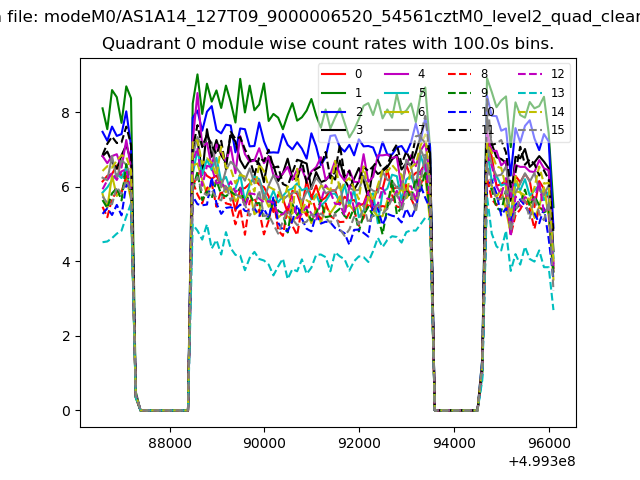
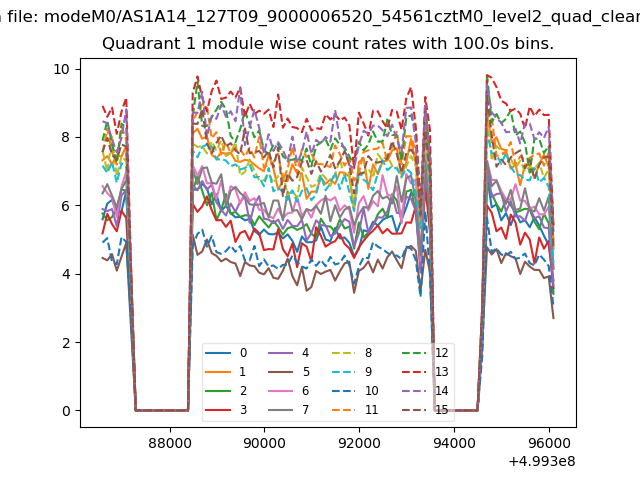
| Module-wise count rates for Quadrant A Data is divided into 100 sec bins |
 |
 |
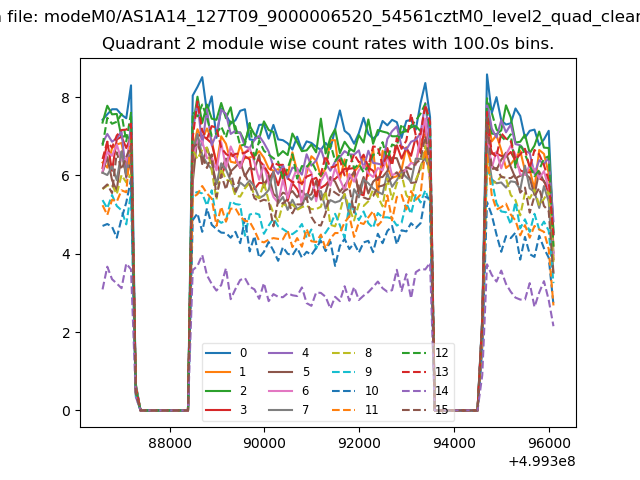
| Module-wise count rates for Quadrant B Data is divided into 100 sec bins |
 |
 |
| Module-wise count rates for Quadrant C Data is divided into 100 sec bins |
 |
 |
| Module-wise count rates for Quadrant D Data is divided into 100 sec bins |
 |
 |
| Parameter | Plot |
|---|---|
| CZT HV Monitor | 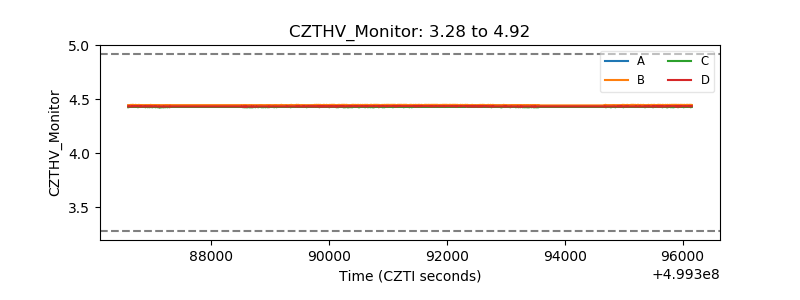 |
| D_VDD | 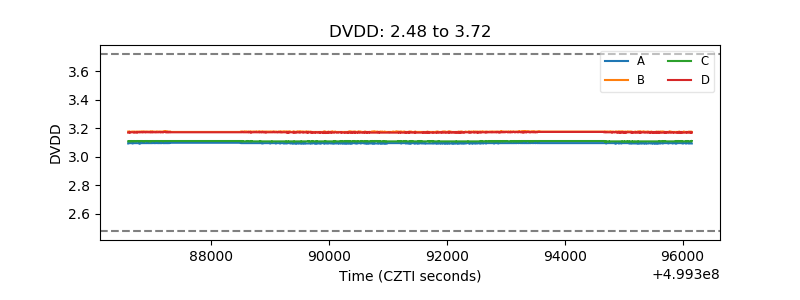 |
| Temperature 1 | 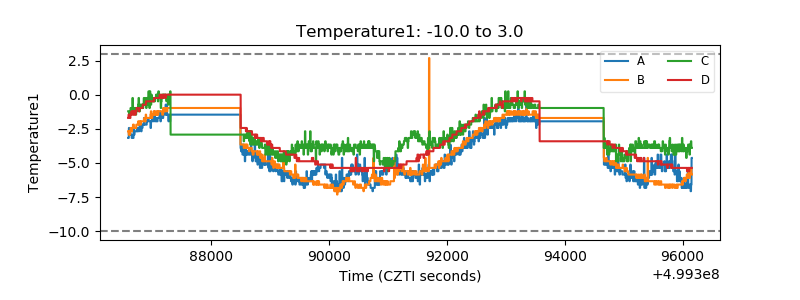 |
| Veto HV Monitor | 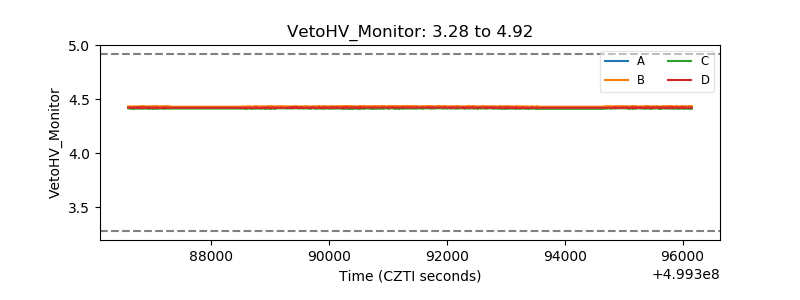 |
| Veto LLD | 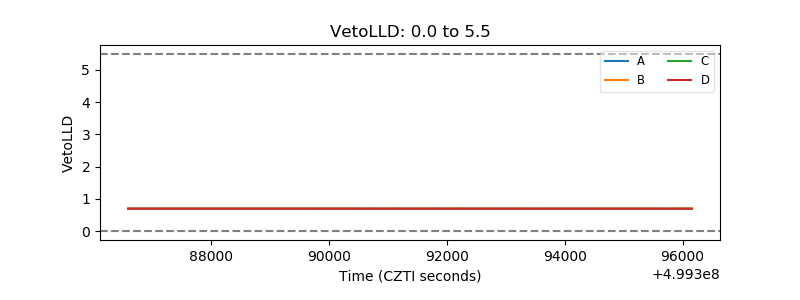 |
| Alpha Counter | 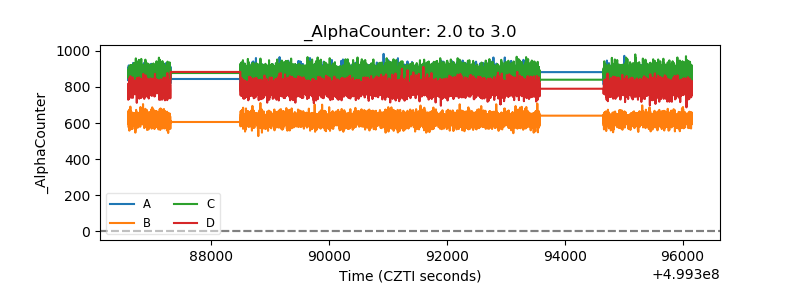 |
| _CPM_Rate | 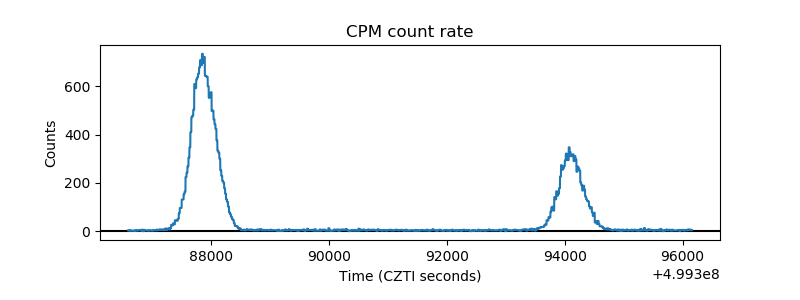 |
| CZT Counter | 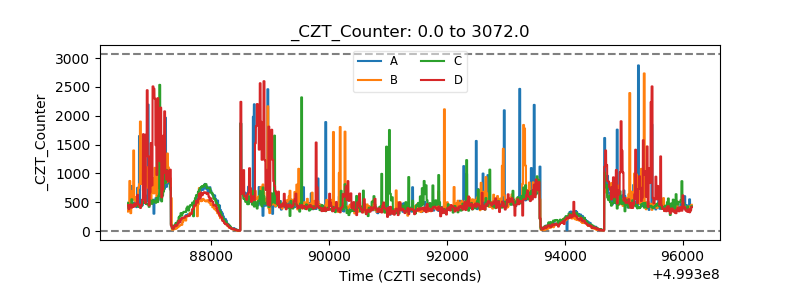 |
| +2.5 Volts monitor | 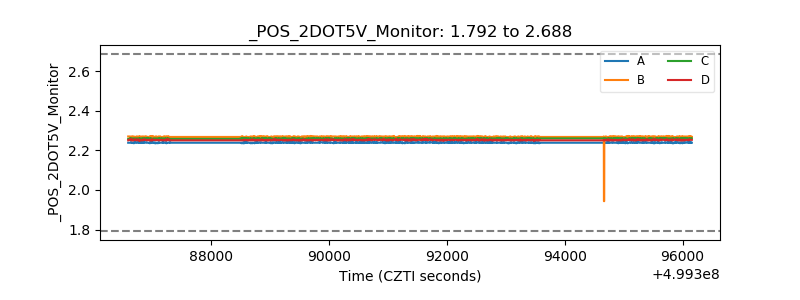 |
| +5 Volts monitor |  |
| _ROLL_ROT | 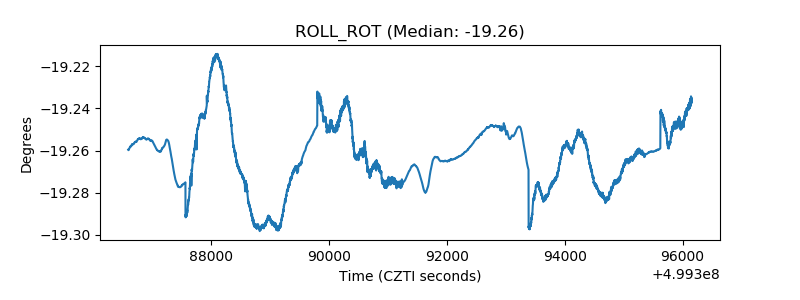 |
| _Roll_DEC | 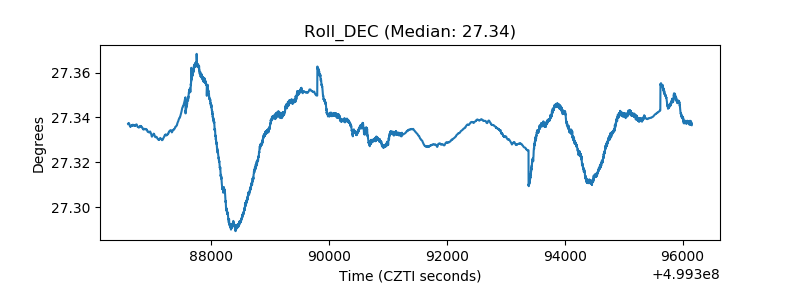 |
| _Roll_RA | 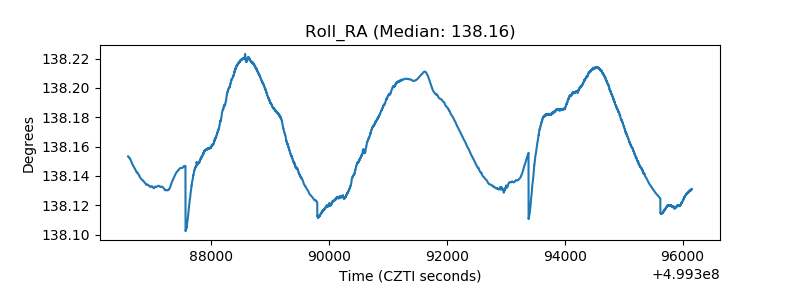 |
| Veto Counter | 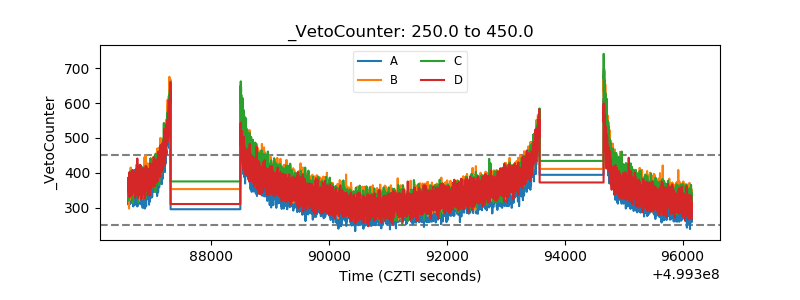 |