| Param | Original file | Final file |
|---|---|---|
| Filename | modeM0/AS1A14_127T09_9000006520_54562cztM0_level2.fits | modeM0/AS1A14_127T09_9000006520_54562cztM0_level2_quad_clean.evt |
| Size (bytes) | 597,735,360 | 102,545,280 |
| Size | 570.0 MB | 97.8 MB |
| Events in quadrant A | 4,004,121 | 713,760 |
| Events in quadrant B | 3,837,681 | 771,606 |
| Events in quadrant C | 9,576,499 | 459,096 |
| Events in quadrant D | 4,125,385 | 639,114 |
| Mode M0 | |||
|---|---|---|---|
| Quadrant | BADHDUFLAG | Total packets | Discarded packets |
| A | 0 | 17355 | 2 |
| B | 0 | 17150 | 2 |
| C | 0 | 33860 | 2 |
| D | 0 | 17912 | 2 |
| Mode SS | |||
|---|---|---|---|
| Quadrant | BADHDUFLAG | Total packets | Discarded packets |
| A | 0 | 154 | 0 |
| B | 0 | 154 | 0 |
| C | 0 | 154 | 0 |
| D | 0 | 154 | 0 |
| Mode M9 | |||
|---|---|---|---|
| Quadrant | BADHDUFLAG | Total packets | Discarded packets |
| A | 0 | 19 | 0 |
| B | 0 | 19 | 0 |
| C | 0 | 19 | 0 |
| D | 0 | 19 | 0 |
| Quadrant | Total seconds | Saturated seconds | Saturation percentage |
|---|---|---|---|
| A | 7492 | 173 | 2.309130% |
| B | 7491 | 111 | 1.481778% |
| C | 7491 | 2628 | 35.082099% |
| D | 7492 | 133 | 1.775227% |
Noise dominated data is calculated using 1-second bins in cleaned event files. If a bin has >2000 counts, and if more than 50% of those come from <1% of pixels, then it is considered to be noise-dominated and hence unusable.
| Quadrant | # 1 sec bins | Bins with >0 counts | Bins with >2000 counts | High rate bins dominated by noise | Noise dominated (total time) | Noise dominated (detector-on time) | Marked lightcurve |
|---|---|---|---|---|---|---|---|
| A | 9413 | 7494 | 104 | 104 | 1.10% | 1.39% | 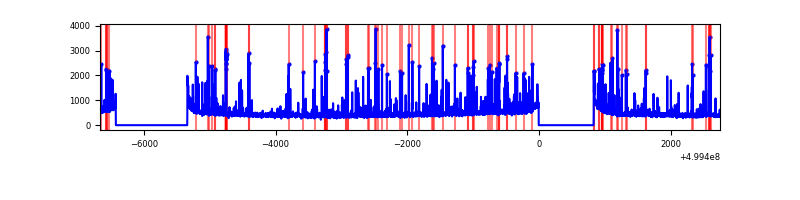 |
| B | 9412 | 7493 | 24 | 24 | 0.25% | 0.32% | 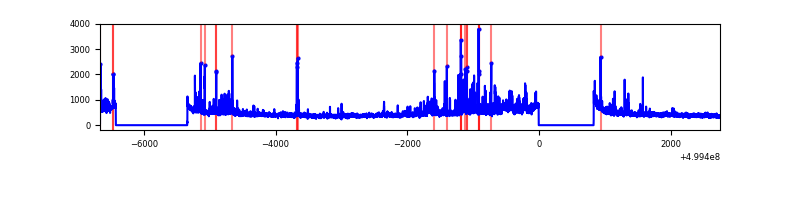 |
| C | 9412 | 7493 | 2687 | 2687 | 28.55% | 35.86% | 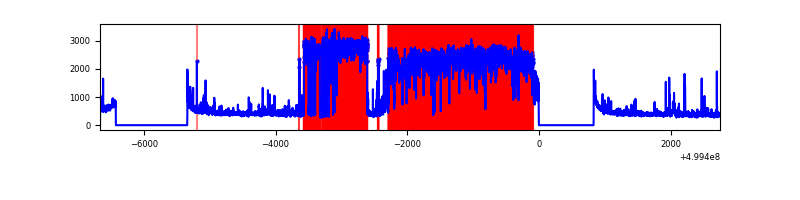 |
| D | 9413 | 7494 | 93 | 93 | 0.99% | 1.24% | 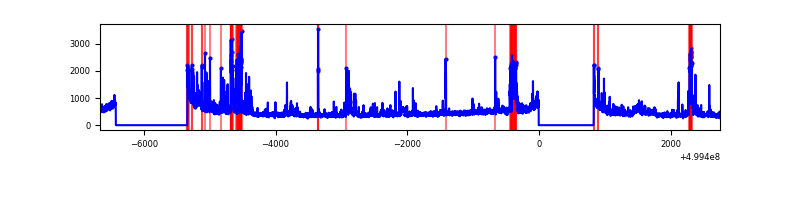 |
Top three noisy pixels from each quadrant. If the there are fewer than three noisy pixels in the level2.evt file, extra rows are filled as -1
| Pixel properties | Quadrant properties | ||||||
|---|---|---|---|---|---|---|---|
| Quadrant | DetID | PixID | Counts | Sigma | Mean | Median | Sigma |
| A | 11 | 3 | 433219 | 2152.49 | 811 | 789 | 200.9 |
| A | 3 | 14 | 299176 | 1485.27 | 811 | 789 | 200.9 |
| A | 4 | 3 | 42932 | 209.77 | 811 | 789 | 200.9 |
| B | 0 | 213 | 224014 | 1274.25 | 811 | 783 | 175.2 |
| B | 5 | 172 | 87443 | 494.67 | 811 | 783 | 175.2 |
| B | 2 | 249 | 81093 | 458.43 | 811 | 783 | 175.2 |
| C | 9 | 38 | 6230194 | 32358.45 | 695 | 690 | 192.5 |
| C | 3 | 248 | 214494 | 1110.58 | 695 | 690 | 192.5 |
| C | 12 | 254 | 132371 | 684.0 | 695 | 690 | 192.5 |
| D | 15 | 94 | 207201 | 918.44 | 784 | 749 | 224.8 |
| D | 3 | 12 | 158674 | 702.56 | 784 | 749 | 224.8 |
| D | 9 | 102 | 133757 | 591.71 | 784 | 749 | 224.8 |
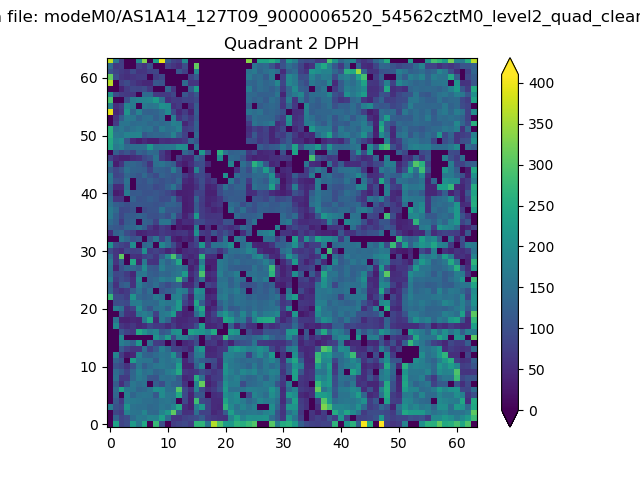
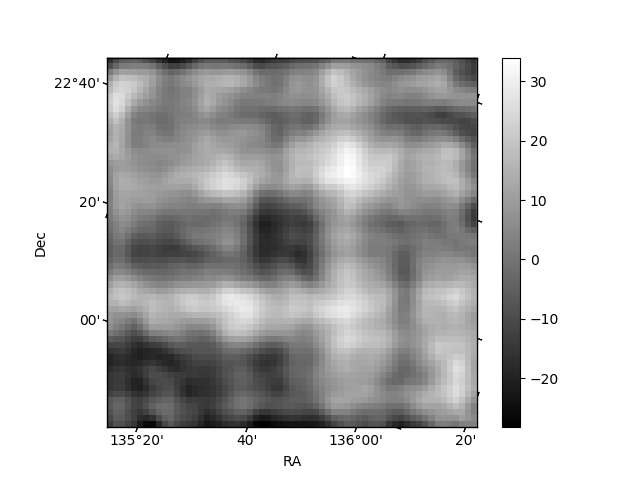
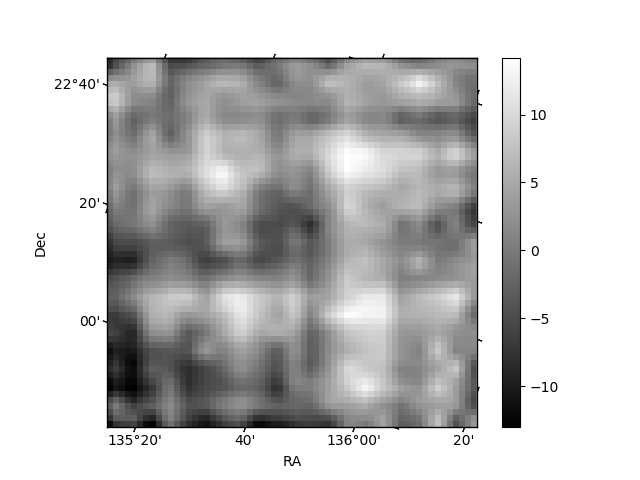
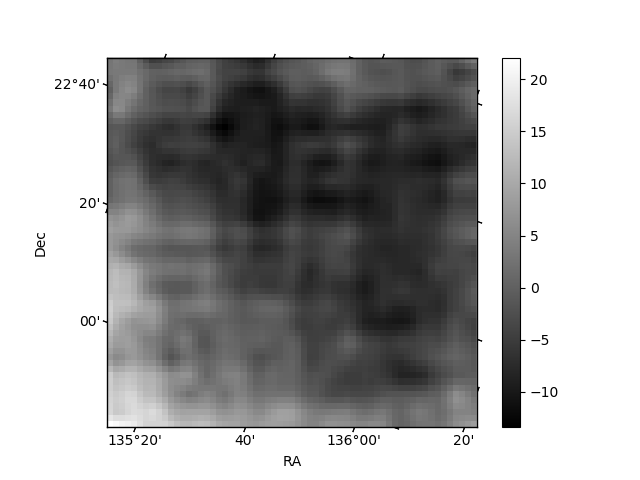
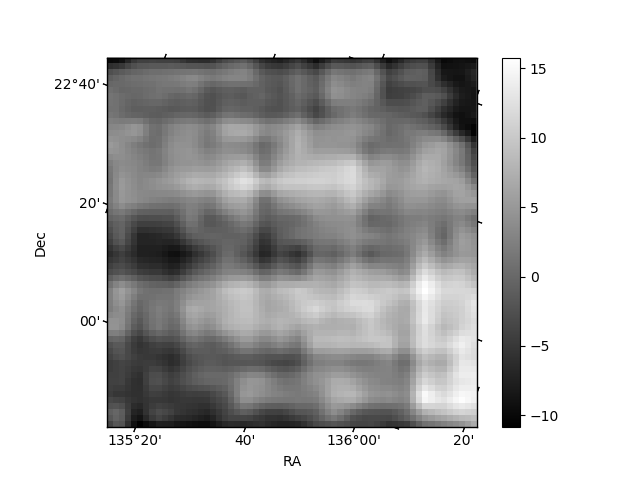
Histogram calculated using DETX and DETY for each event in the final _common_clean file
| Quadrant A | 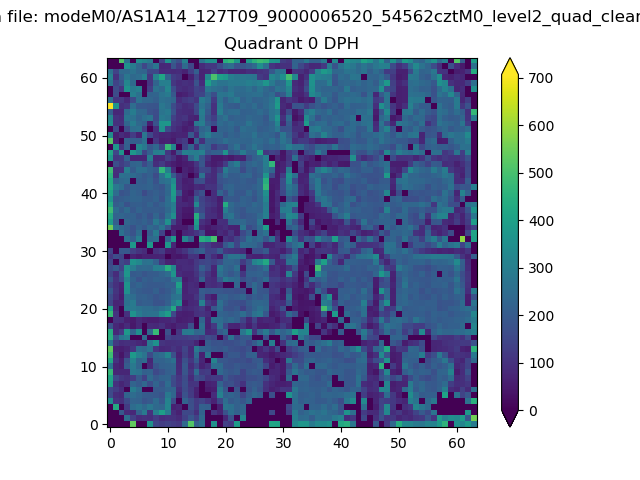 |
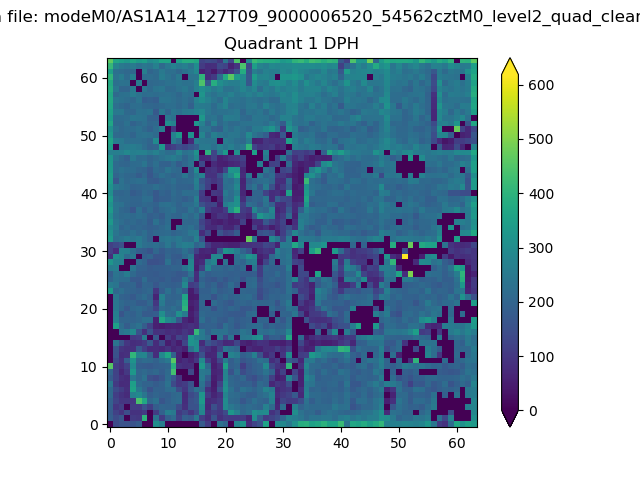 |
Quadrant B |
|---|---|---|---|
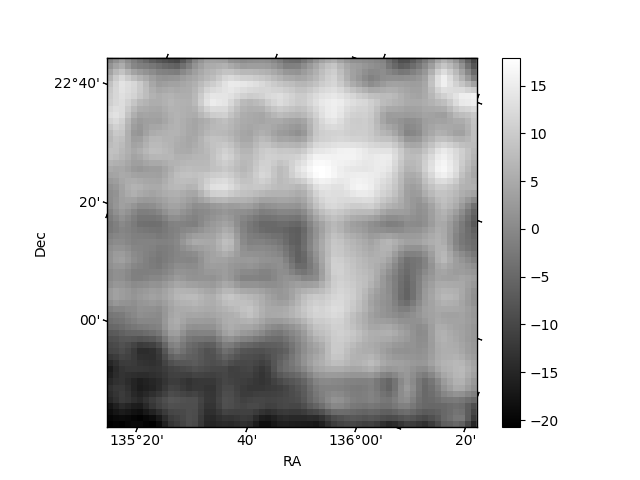
| Quadrant D | 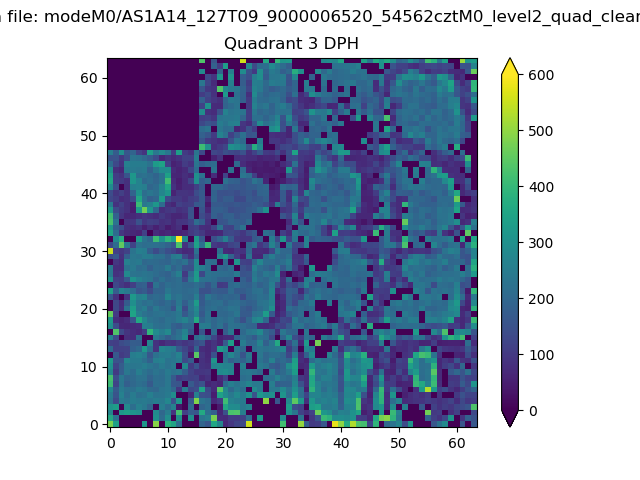 |
 |
Quadrant C |
| Plot type | Count rate plots | Images |
|---|---|---|
| Comparison with Poisson distribution Blue bars denote a histogram of data divided into 1 sec bins. Red curve is a Poisson curve with rate = median count rate of data. |
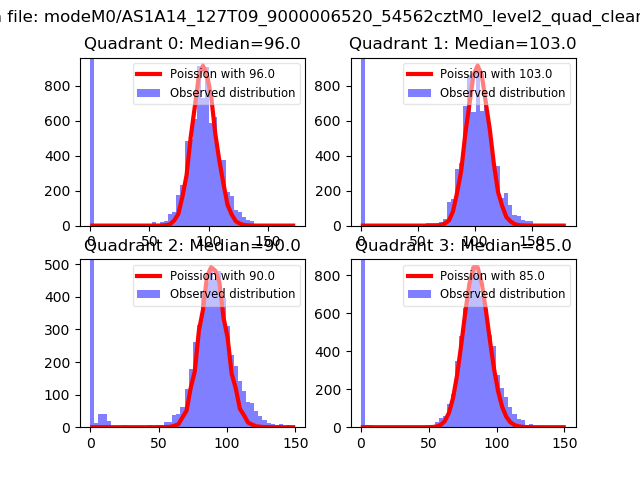 |
 |
| Quadrant-wise count rates Data is divided into 100 sec bins |
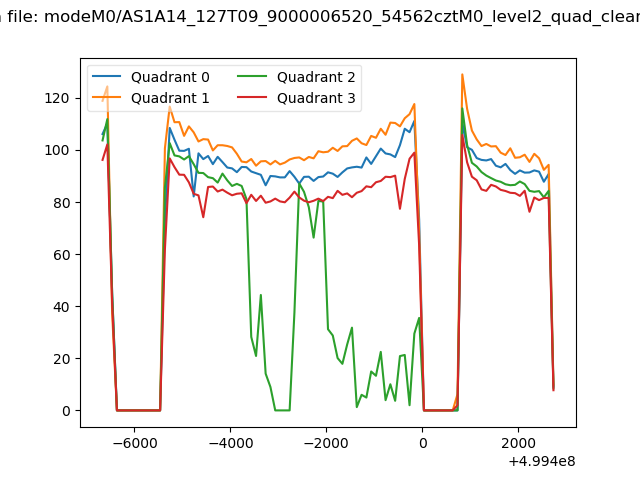 |
|
| Module-wise count rates for Quadrant A Data is divided into 100 sec bins |
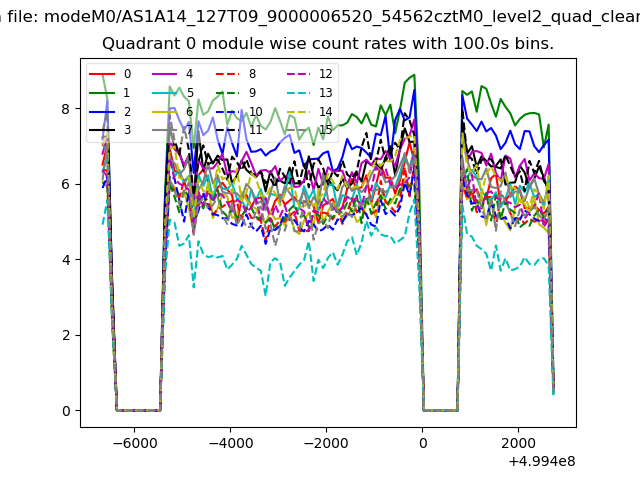 |
 |
| Module-wise count rates for Quadrant B Data is divided into 100 sec bins |
 |
 |
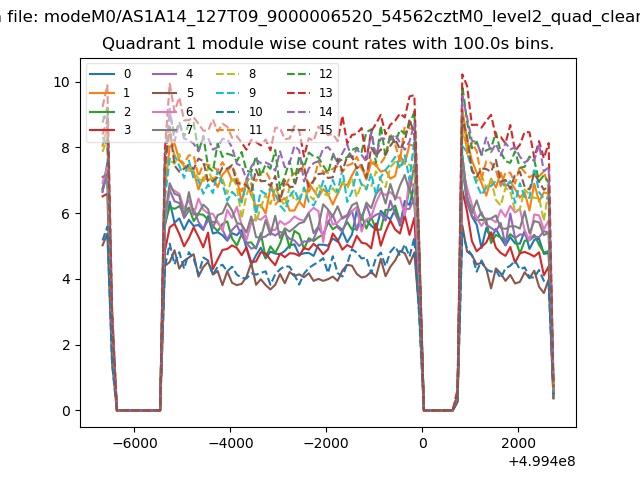
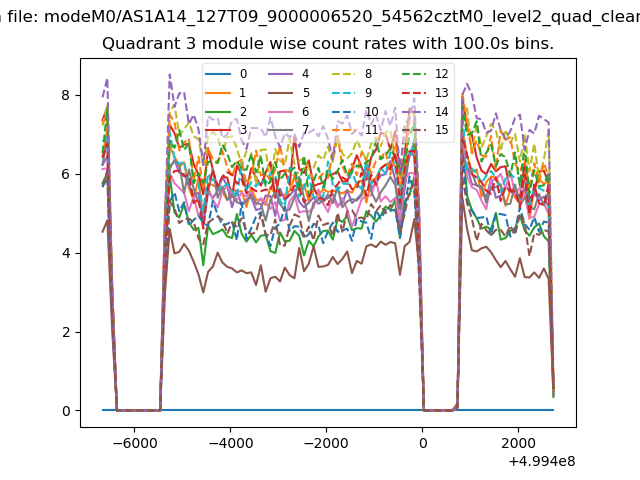
| Module-wise count rates for Quadrant C Data is divided into 100 sec bins |
 |
 |
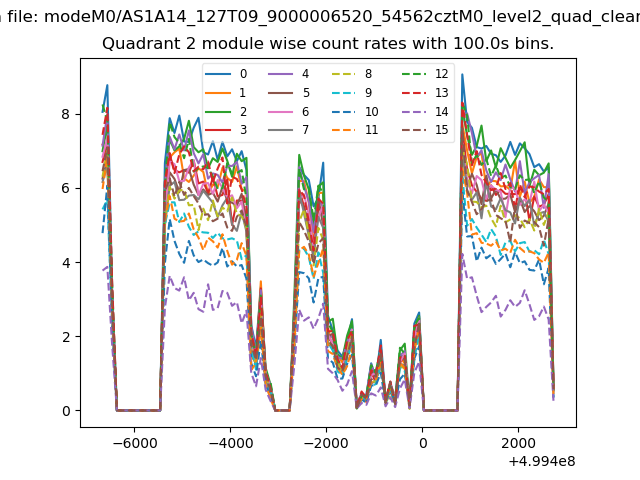
| Module-wise count rates for Quadrant D Data is divided into 100 sec bins |
 |
 |
| Parameter | Plot |
|---|---|
| CZT HV Monitor | 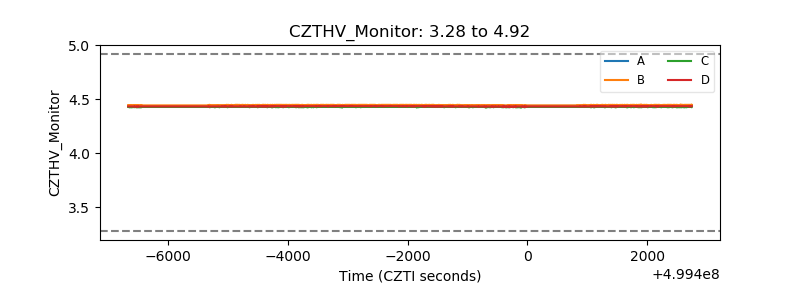 |
| D_VDD | 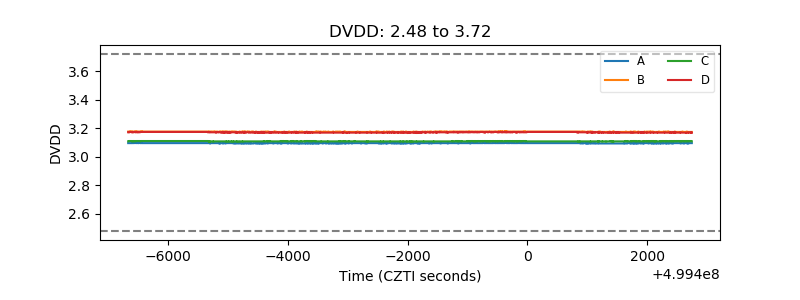 |
| Temperature 1 | 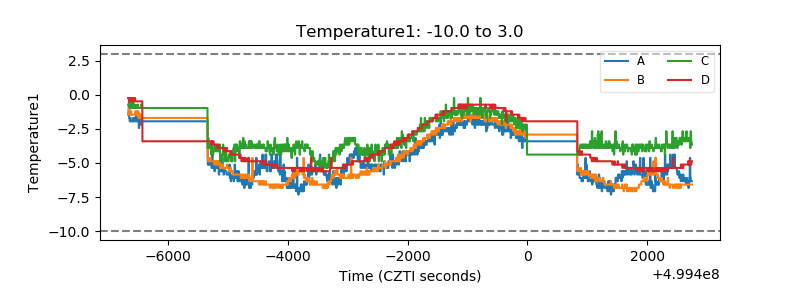 |
| Veto HV Monitor | 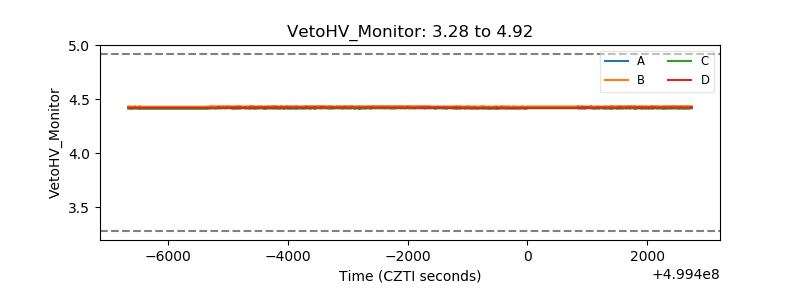 |
| Veto LLD | 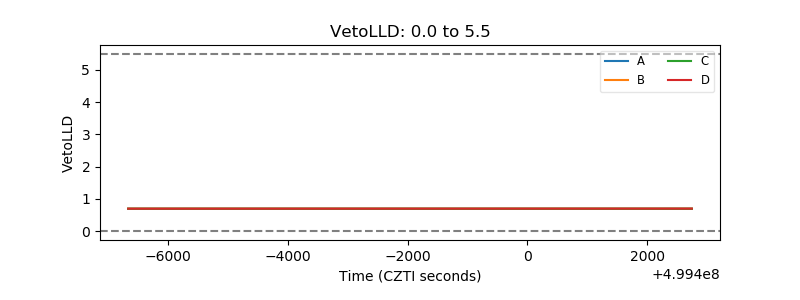 |
| Alpha Counter | 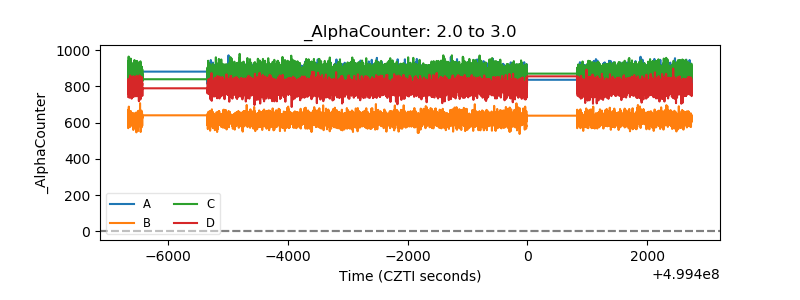 |
| _CPM_Rate | 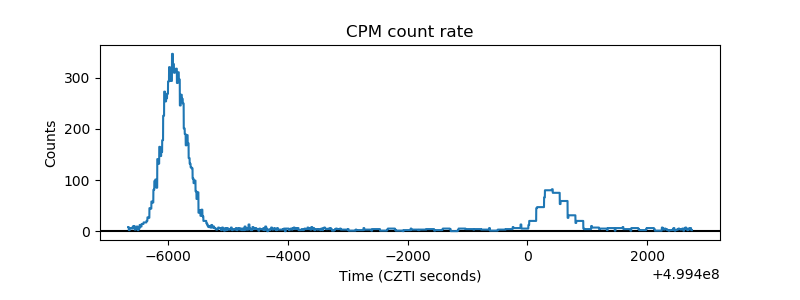 |
| CZT Counter | 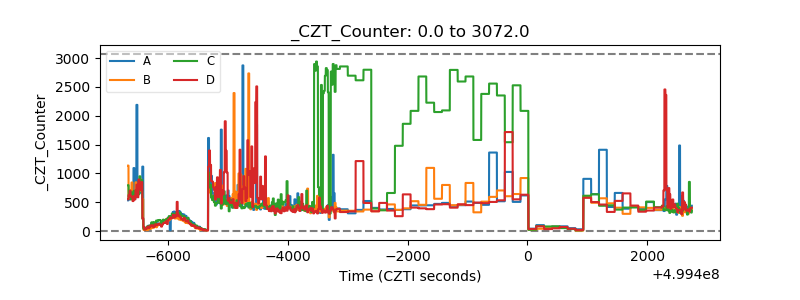 |
| +2.5 Volts monitor |  |
| +5 Volts monitor | 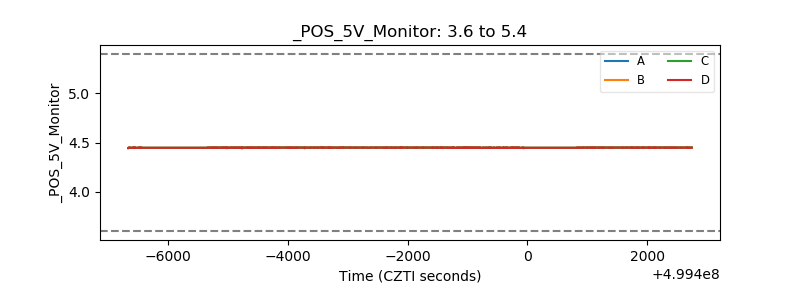 |
| _ROLL_ROT | 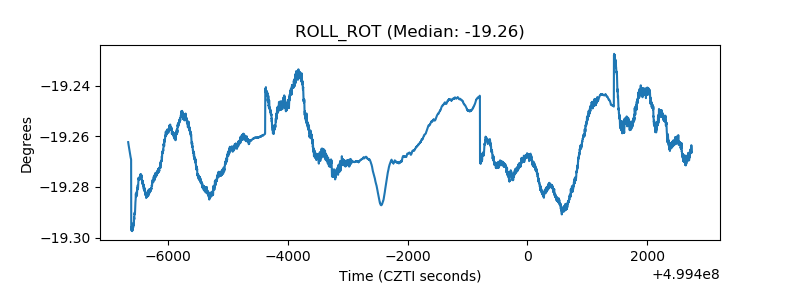 |
| _Roll_DEC | 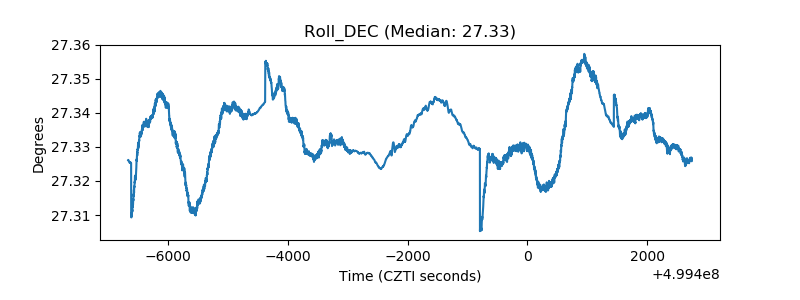 |
| _Roll_RA | 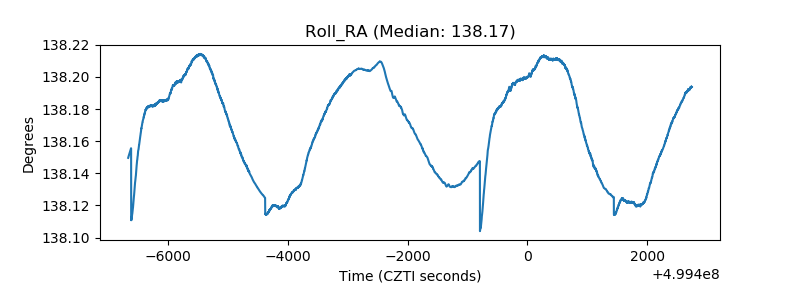 |
| Veto Counter | 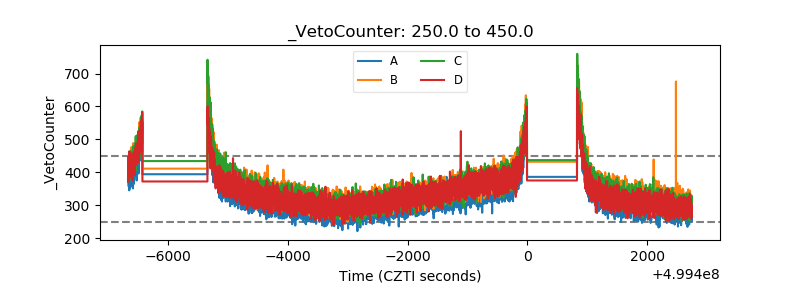 |