| Param | Original file | Final file |
|---|---|---|
| Filename | modeM0/AS1A14_127T09_9000006520_54563cztM0_level2.fits | modeM0/AS1A14_127T09_9000006520_54563cztM0_level2_quad_clean.evt |
| Size (bytes) | 521,524,800 | 110,168,640 |
| Size | 497.4 MB | 105.1 MB |
| Events in quadrant A | 4,068,706 | 730,247 |
| Events in quadrant B | 4,291,464 | 761,315 |
| Events in quadrant C | 4,149,393 | 690,935 |
| Events in quadrant D | 6,191,005 | 612,310 |
| Mode M0 | |||
|---|---|---|---|
| Quadrant | BADHDUFLAG | Total packets | Discarded packets |
| A | 0 | 17467 | 3 |
| B | 0 | 18648 | 3 |
| C | 0 | 18243 | 3 |
| D | 0 | 24131 | 3 |
| Mode SS | |||
|---|---|---|---|
| Quadrant | BADHDUFLAG | Total packets | Discarded packets |
| A | 0 | 160 | 0 |
| B | 0 | 160 | 0 |
| C | 0 | 160 | 0 |
| D | 0 | 160 | 0 |
| Mode M9 | |||
|---|---|---|---|
| Quadrant | BADHDUFLAG | Total packets | Discarded packets |
| A | 0 | 3 | 0 |
| B | 0 | 3 | 0 |
| C | 0 | 3 | 0 |
| D | 0 | 4 | 0 |
| Quadrant | Total seconds | Saturated seconds | Saturation percentage |
|---|---|---|---|
| A | 7778 | 205 | 2.635639% |
| B | 7778 | 399 | 5.129853% |
| C | 7777 | 235 | 3.021731% |
| D | 7777 | 717 | 9.219493% |
Noise dominated data is calculated using 1-second bins in cleaned event files. If a bin has >2000 counts, and if more than 50% of those come from <1% of pixels, then it is considered to be noise-dominated and hence unusable.
| Quadrant | # 1 sec bins | Bins with >0 counts | Bins with >2000 counts | High rate bins dominated by noise | Noise dominated (total time) | Noise dominated (detector-on time) | Marked lightcurve |
|---|---|---|---|---|---|---|---|
| A | 8003 | 7781 | 76 | 76 | 0.95% | 0.98% | 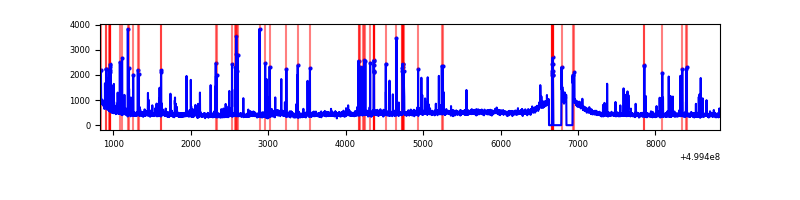 |
| B | 8003 | 7781 | 105 | 105 | 1.31% | 1.35% | 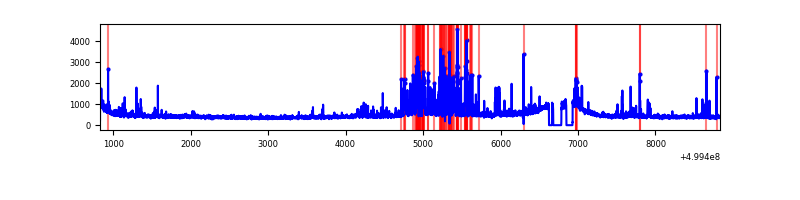 |
| C | 8002 | 7780 | 111 | 111 | 1.39% | 1.43% | 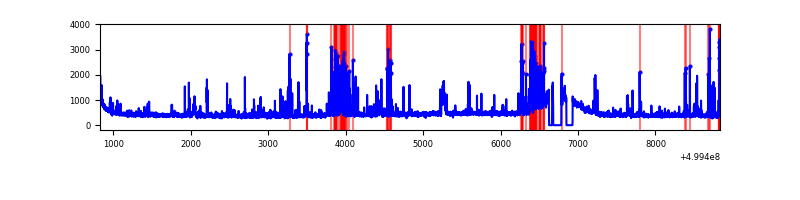 |
| D | 8002 | 7780 | 649 | 649 | 8.11% | 8.34% | 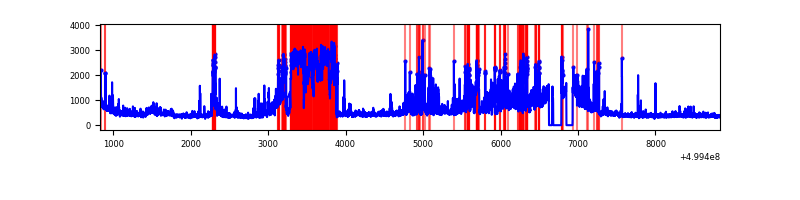 |
Top three noisy pixels from each quadrant. If the there are fewer than three noisy pixels in the level2.evt file, extra rows are filled as -1
| Pixel properties | Quadrant properties | ||||||
|---|---|---|---|---|---|---|---|
| Quadrant | DetID | PixID | Counts | Sigma | Mean | Median | Sigma |
| A | 3 | 14 | 325496 | 1510.3 | 861 | 838 | 215.0 |
| A | 11 | 3 | 294967 | 1368.28 | 861 | 838 | 215.0 |
| A | 4 | 3 | 44808 | 204.55 | 861 | 838 | 215.0 |
| B | 2 | 249 | 459766 | 2509.5 | 845 | 813 | 182.9 |
| B | 10 | 14 | 185332 | 1008.93 | 845 | 813 | 182.9 |
| B | 0 | 213 | 83578 | 452.55 | 845 | 813 | 182.9 |
| C | 13 | 3 | 546505 | 2372.25 | 835 | 829 | 230.0 |
| C | 14 | 254 | 89344 | 384.81 | 835 | 829 | 230.0 |
| C | 4 | 5 | 86952 | 374.41 | 835 | 829 | 230.0 |
| D | 3 | 12 | 2400789 | 10278.17 | 811 | 777 | 233.5 |
| D | 15 | 94 | 200585 | 855.69 | 811 | 777 | 233.5 |
| D | 8 | 160 | 123983 | 527.64 | 811 | 777 | 233.5 |
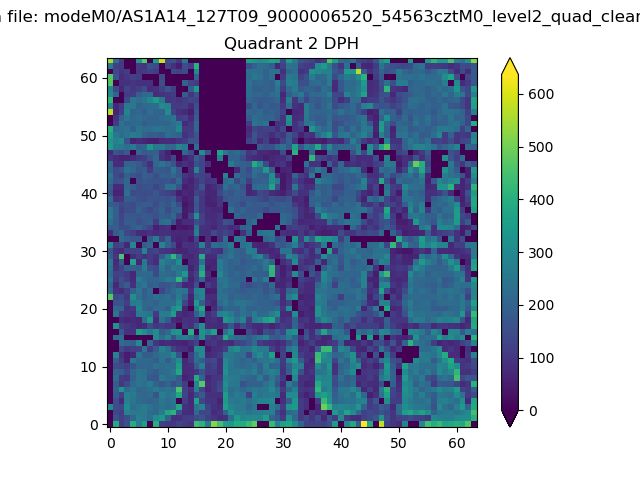
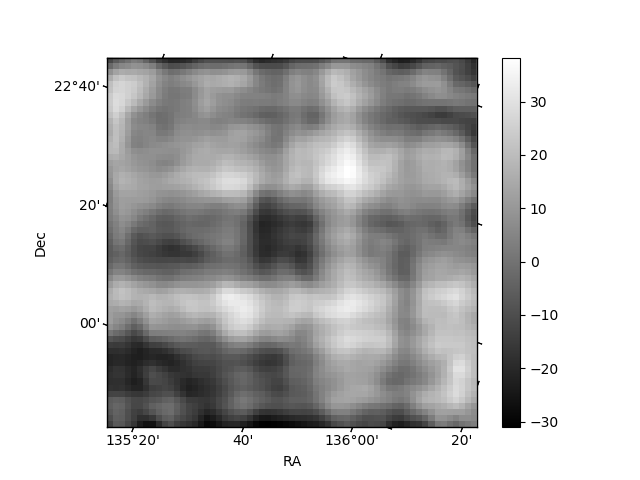
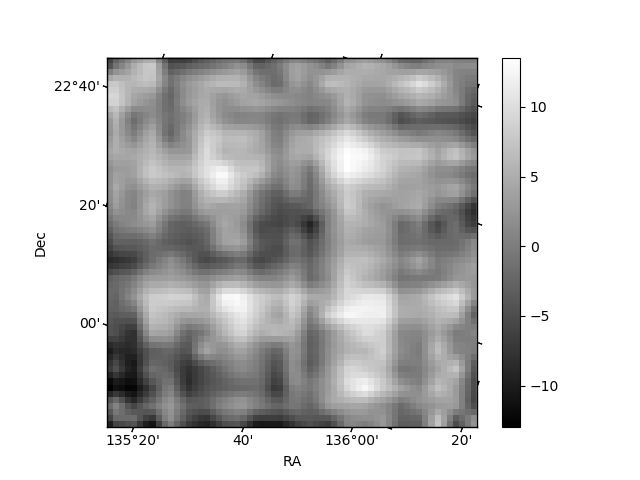
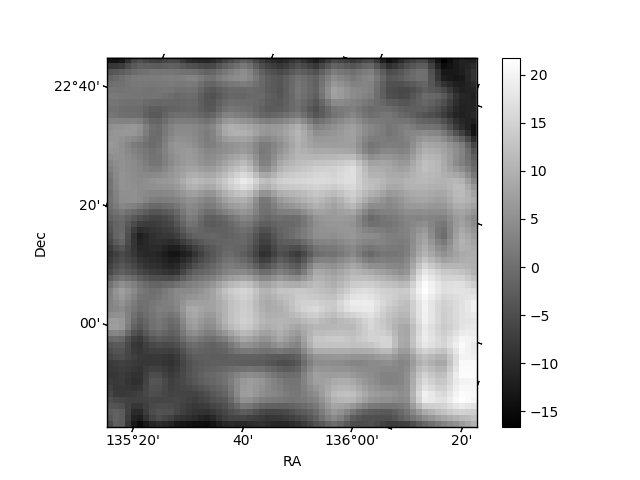
Histogram calculated using DETX and DETY for each event in the final _common_clean file
| Quadrant A | 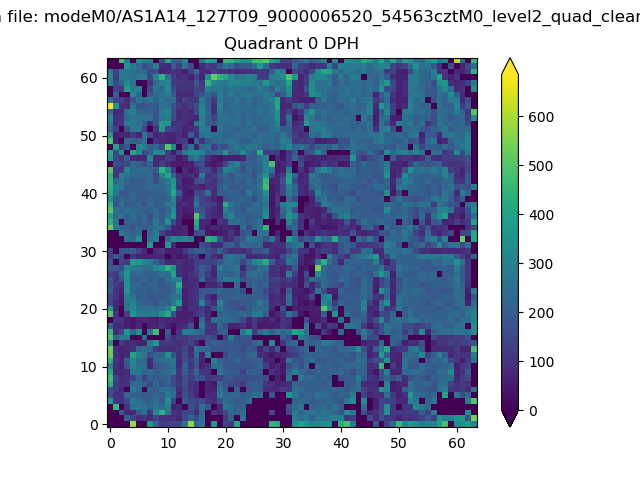 |
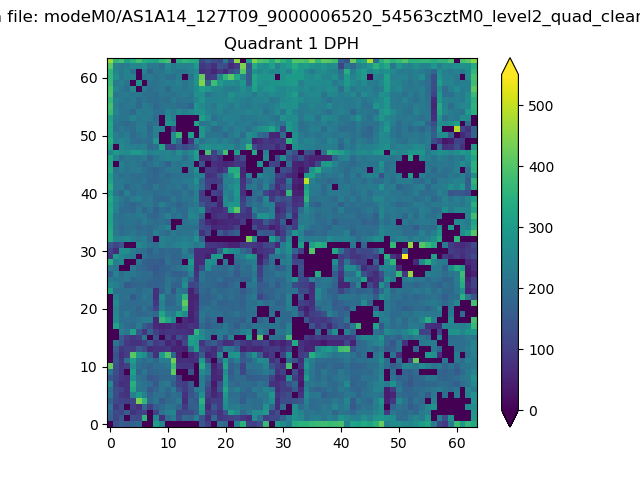 |
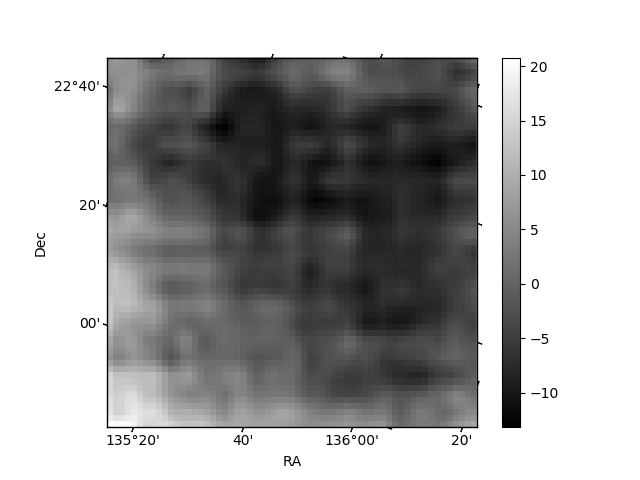
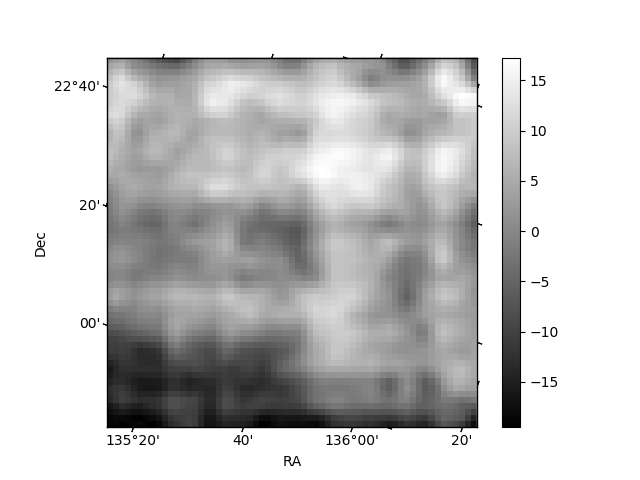
Quadrant B |
|---|---|---|---|
| Quadrant D | 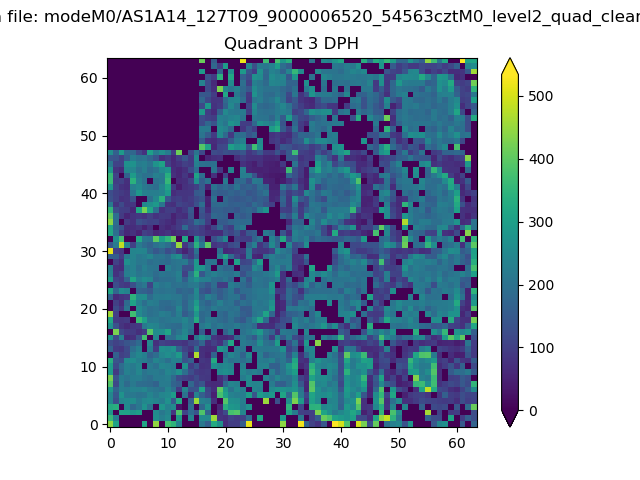 |
 |
Quadrant C |
| Plot type | Count rate plots | Images |
|---|---|---|
| Comparison with Poisson distribution Blue bars denote a histogram of data divided into 1 sec bins. Red curve is a Poisson curve with rate = median count rate of data. |
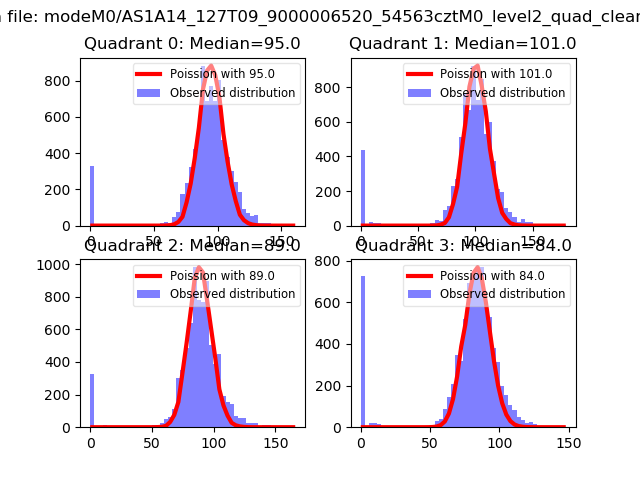 |
 |
| Quadrant-wise count rates Data is divided into 100 sec bins |
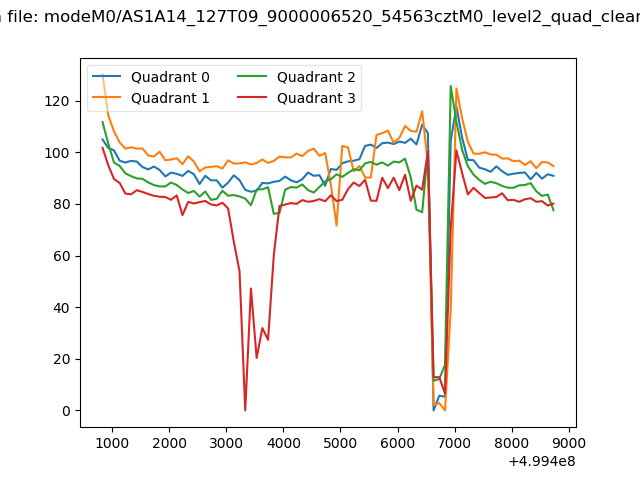 |
|
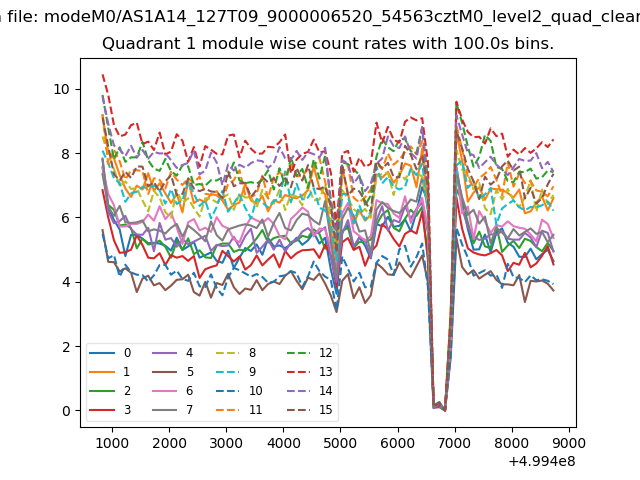
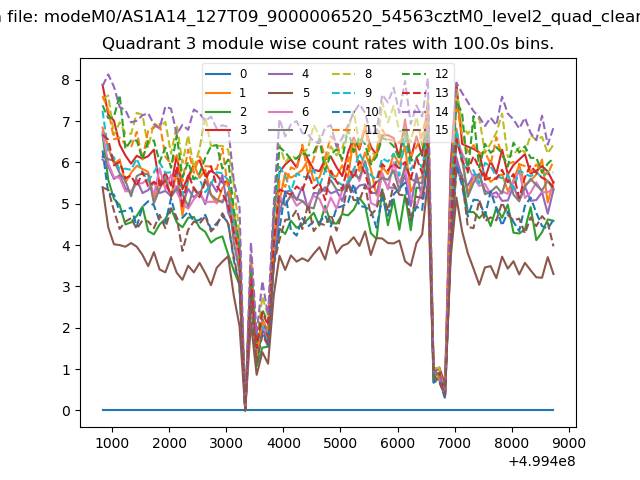
| Module-wise count rates for Quadrant A Data is divided into 100 sec bins |
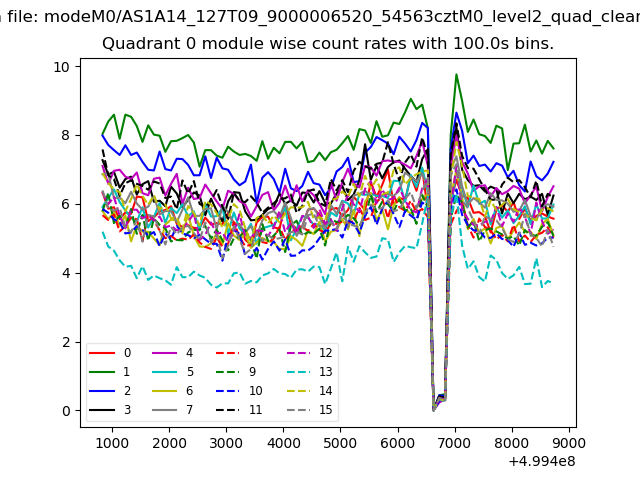 |
 |
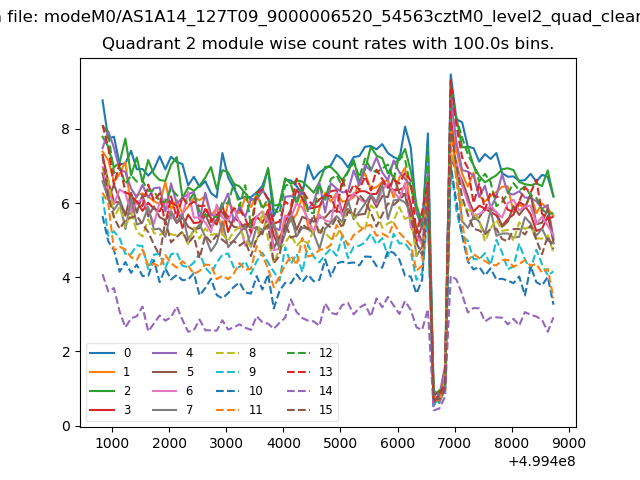
| Module-wise count rates for Quadrant B Data is divided into 100 sec bins |
 |
 |
| Module-wise count rates for Quadrant C Data is divided into 100 sec bins |
 |
 |
| Module-wise count rates for Quadrant D Data is divided into 100 sec bins |
 |
 |
| Parameter | Plot |
|---|---|
| CZT HV Monitor | 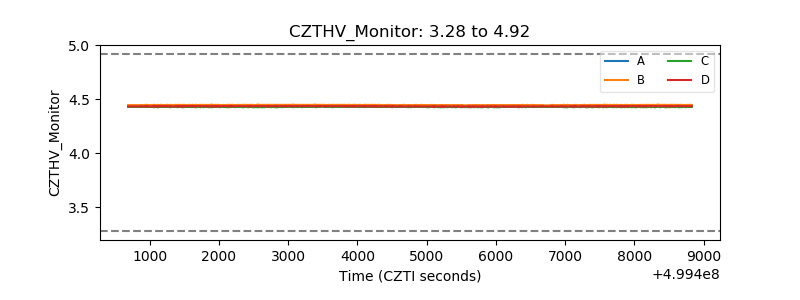 |
| D_VDD | 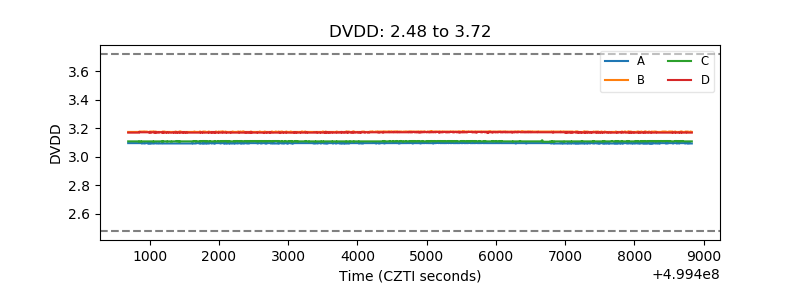 |
| Temperature 1 | 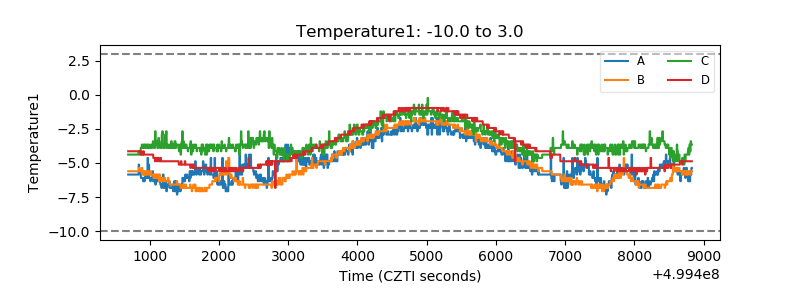 |
| Veto HV Monitor |  |
| Veto LLD | 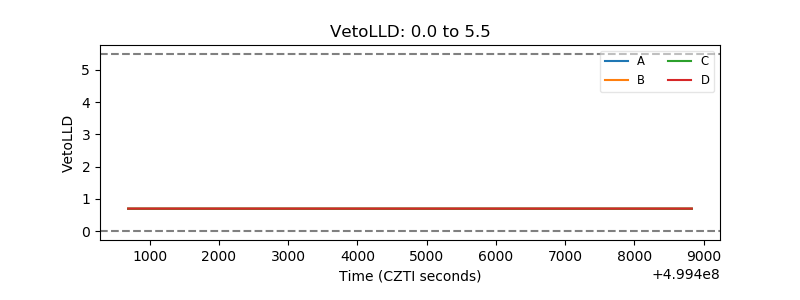 |
| Alpha Counter |  |
| _CPM_Rate | 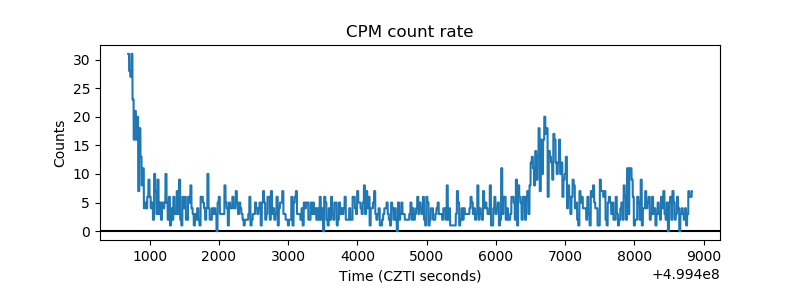 |
| CZT Counter | 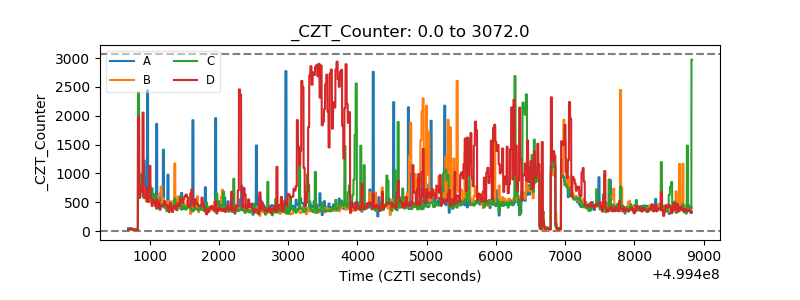 |
| +2.5 Volts monitor |  |
| +5 Volts monitor |  |
| _ROLL_ROT | 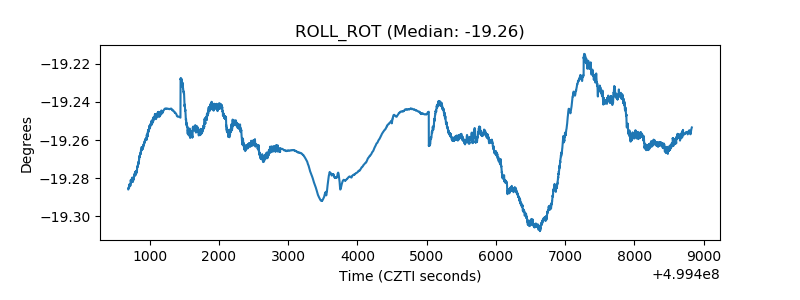 |
| _Roll_DEC | 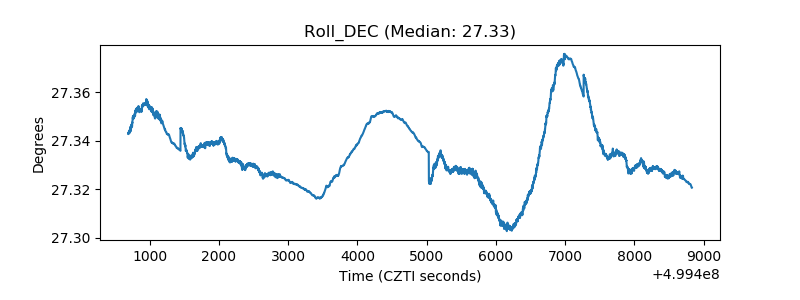 |
| _Roll_RA | 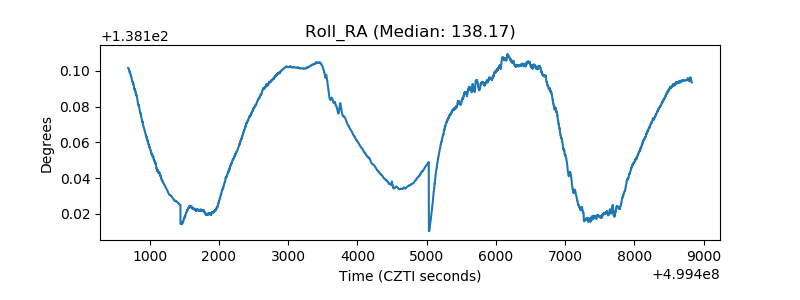 |
| Veto Counter | 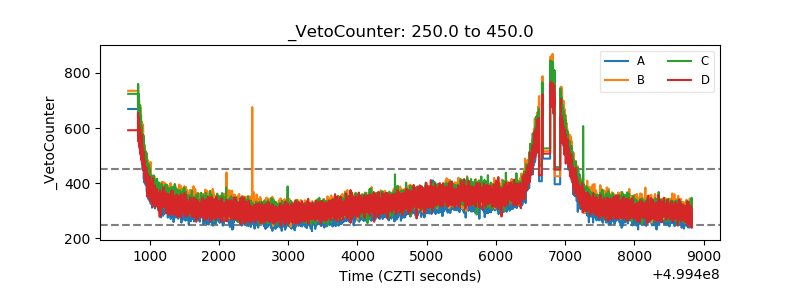 |