| Param | Original file | Final file |
|---|---|---|
| Filename | modeM0/AS1A14_127T09_9000006520_54564cztM0_level2.fits | modeM0/AS1A14_127T09_9000006520_54564cztM0_level2_quad_clean.evt |
| Size (bytes) | 527,595,840 | 114,485,760 |
| Size | 503.2 MB | 109.2 MB |
| Events in quadrant A | 3,742,493 | 761,711 |
| Events in quadrant B | 4,715,209 | 794,765 |
| Events in quadrant C | 4,304,390 | 711,277 |
| Events in quadrant D | 6,141,614 | 638,551 |
| Mode M0 | |||
|---|---|---|---|
| Quadrant | BADHDUFLAG | Total packets | Discarded packets |
| A | 0 | 17071 | 7 |
| B | 0 | 19875 | 11 |
| C | 0 | 18860 | 4 |
| D | 0 | 24211 | 1 |
| Mode SS | |||
|---|---|---|---|
| Quadrant | BADHDUFLAG | Total packets | Discarded packets |
| A | 0 | 162 | 0 |
| B | 0 | 162 | 0 |
| C | 0 | 161 | 0 |
| D | 0 | 162 | 0 |
| Quadrant | Total seconds | Saturated seconds | Saturation percentage |
|---|---|---|---|
| A | 8060 | 42 | 0.521092% |
| B | 8061 | 269 | 3.337055% |
| C | 8061 | 179 | 2.220568% |
| D | 8063 | 612 | 7.590227% |
Noise dominated data is calculated using 1-second bins in cleaned event files. If a bin has >2000 counts, and if more than 50% of those come from <1% of pixels, then it is considered to be noise-dominated and hence unusable.
| Quadrant | # 1 sec bins | Bins with >0 counts | Bins with >2000 counts | High rate bins dominated by noise | Noise dominated (total time) | Noise dominated (detector-on time) | Marked lightcurve |
|---|---|---|---|---|---|---|---|
| A | 8064 | 8064 | 19 | 19 | 0.24% | 0.24% | 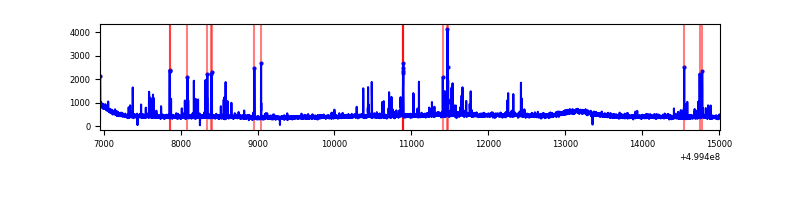 |
| B | 8064 | 8064 | 131 | 131 | 1.62% | 1.62% | 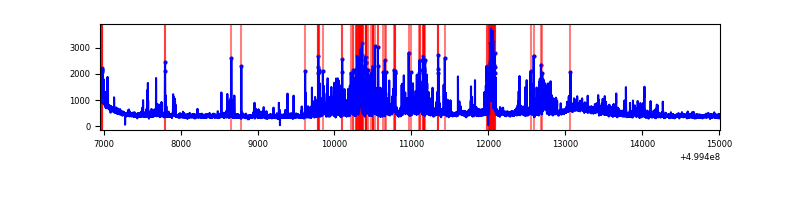 |
| C | 8063 | 8063 | 143 | 143 | 1.77% | 1.77% | 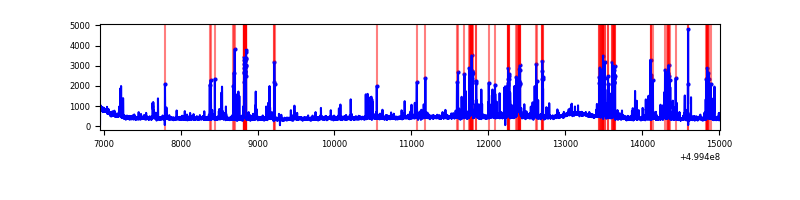 |
| D | 8064 | 8064 | 573 | 573 | 7.11% | 7.11% | 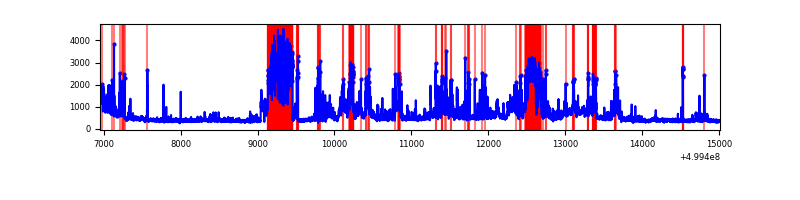 |
Top three noisy pixels from each quadrant. If the there are fewer than three noisy pixels in the level2.evt file, extra rows are filled as -1
| Pixel properties | Quadrant properties | ||||||
|---|---|---|---|---|---|---|---|
| Quadrant | DetID | PixID | Counts | Sigma | Mean | Median | Sigma |
| A | 11 | 3 | 134430 | 619.45 | 871 | 850 | 215.6 |
| A | 3 | 14 | 114898 | 528.88 | 871 | 850 | 215.6 |
| A | 0 | 8 | 53508 | 244.19 | 871 | 850 | 215.6 |
| B | 10 | 14 | 627587 | 3410.84 | 853 | 820 | 183.8 |
| B | 2 | 249 | 352252 | 1912.48 | 853 | 820 | 183.8 |
| B | 0 | 213 | 85067 | 458.47 | 853 | 820 | 183.8 |
| C | 13 | 3 | 642705 | 2769.56 | 841 | 834 | 231.8 |
| C | 4 | 5 | 115701 | 495.63 | 841 | 834 | 231.8 |
| C | 14 | 254 | 76087 | 324.7 | 841 | 834 | 231.8 |
| D | 3 | 12 | 2623345 | 11317.33 | 811 | 775 | 231.7 |
| D | 3 | 224 | 129289 | 554.58 | 811 | 775 | 231.7 |
| D | 5 | 173 | 60468 | 257.6 | 811 | 775 | 231.7 |
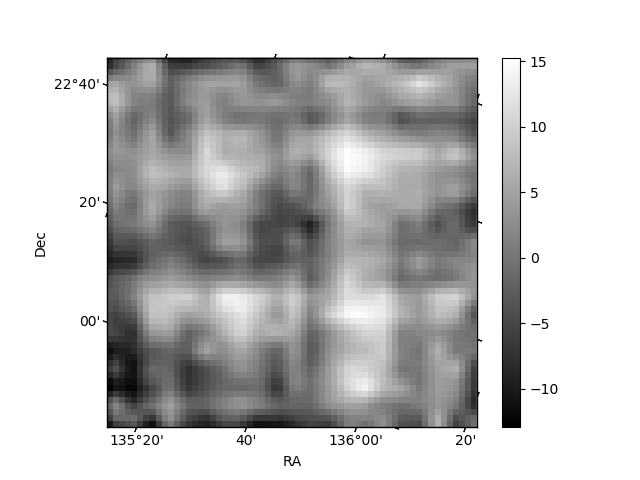
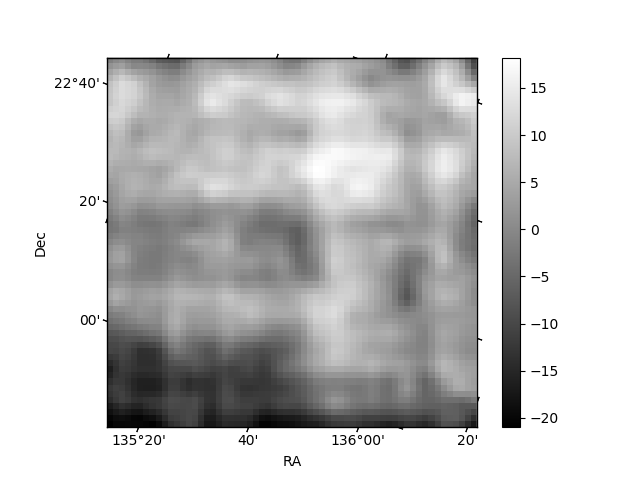
Histogram calculated using DETX and DETY for each event in the final _common_clean file
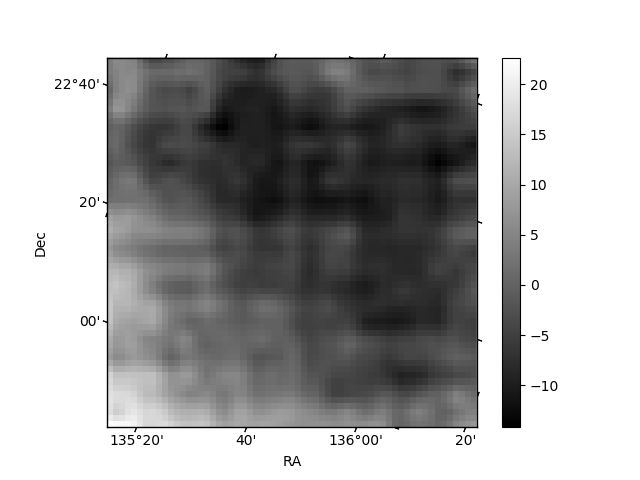
| Quadrant A | 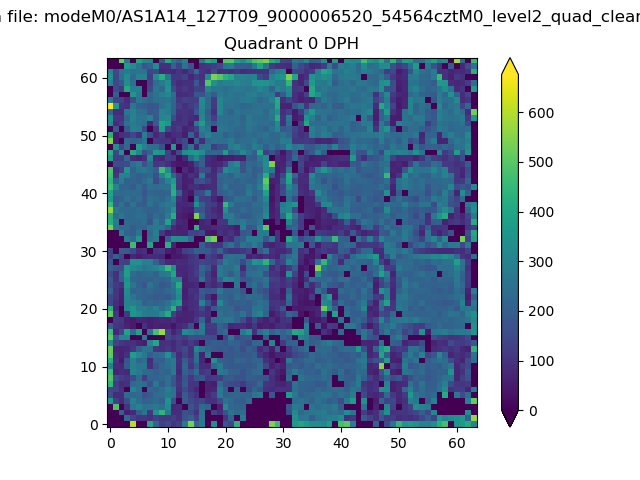 |
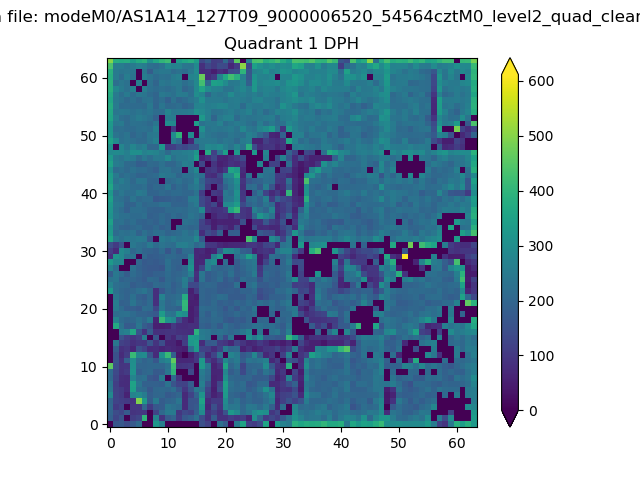 |
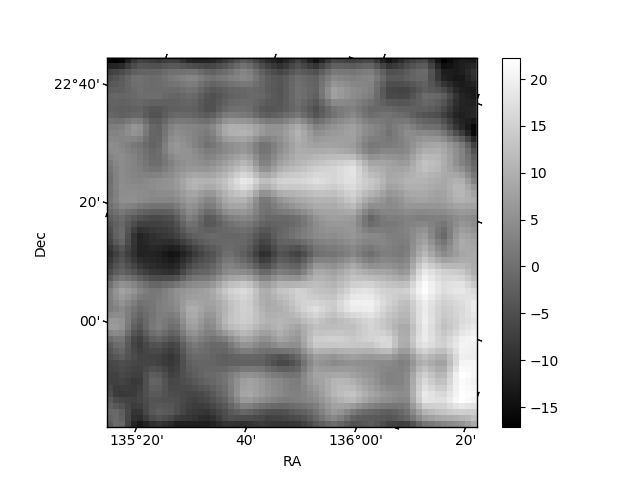
Quadrant B |
|---|---|---|---|
| Quadrant D | 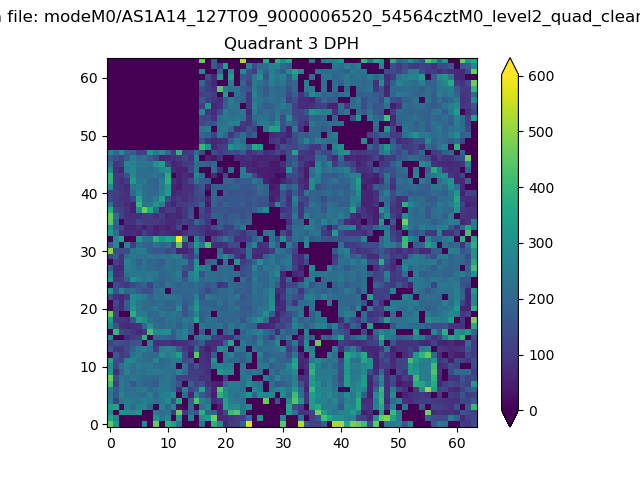 |
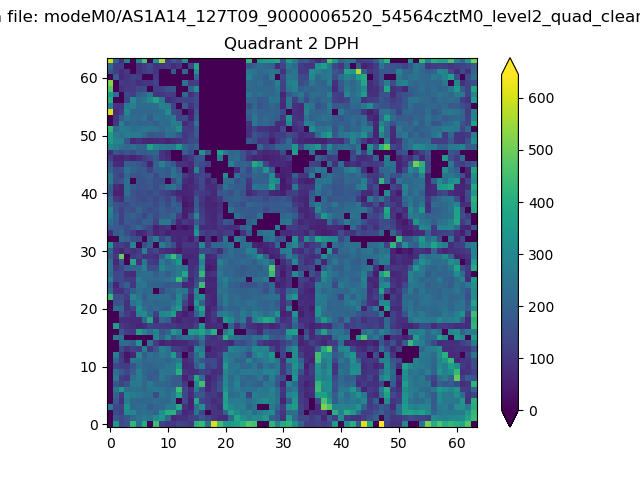 |
Quadrant C |
| Plot type | Count rate plots | Images |
|---|---|---|
| Comparison with Poisson distribution Blue bars denote a histogram of data divided into 1 sec bins. Red curve is a Poisson curve with rate = median count rate of data. |
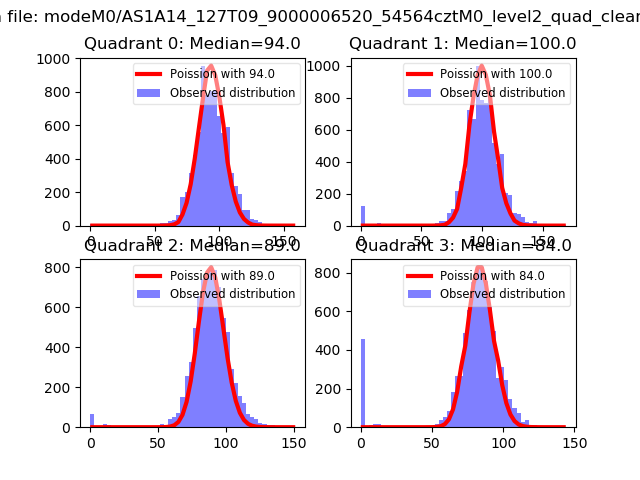 |
 |
| Quadrant-wise count rates Data is divided into 100 sec bins |
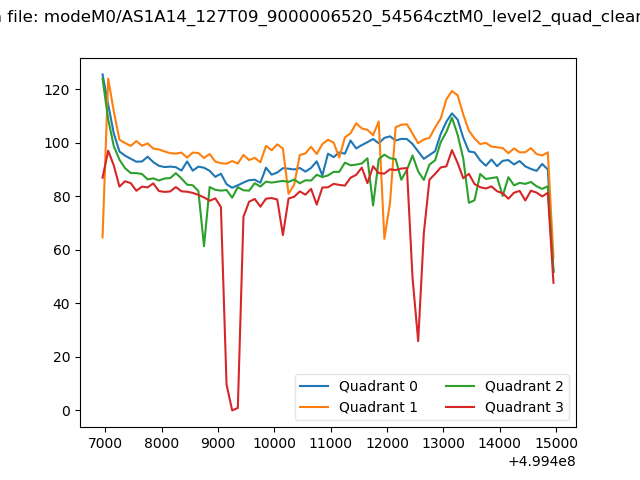 |
|
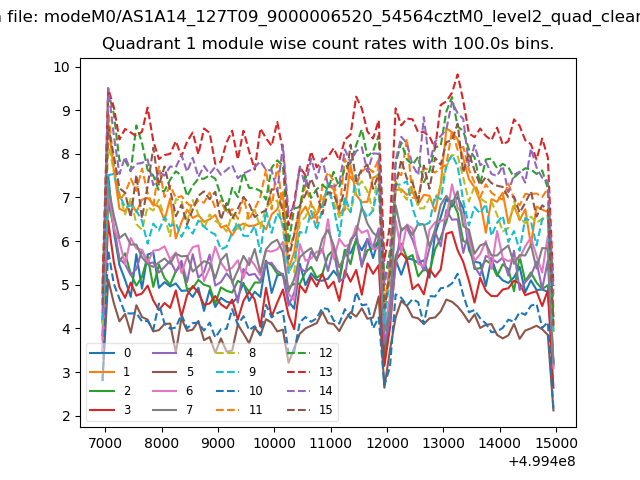
| Module-wise count rates for Quadrant A Data is divided into 100 sec bins |
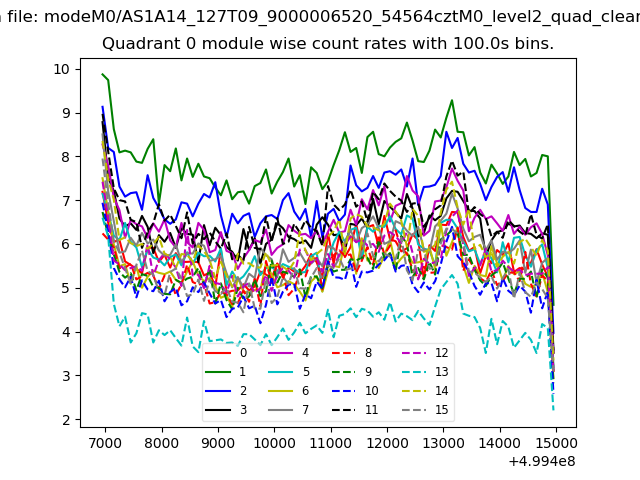 |
 |
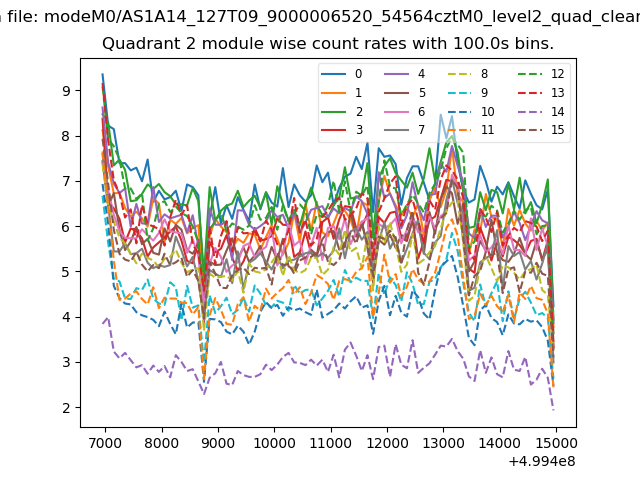
| Module-wise count rates for Quadrant B Data is divided into 100 sec bins |
 |
 |
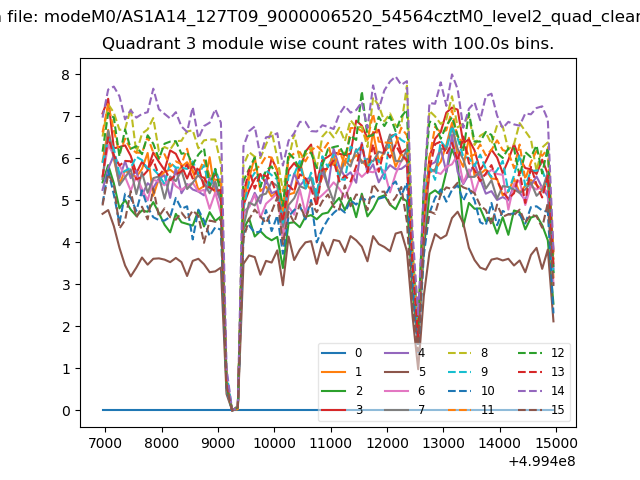
| Module-wise count rates for Quadrant C Data is divided into 100 sec bins |
 |
 |
| Module-wise count rates for Quadrant D Data is divided into 100 sec bins |
 |
 |
| Parameter | Plot |
|---|---|
| CZT HV Monitor | 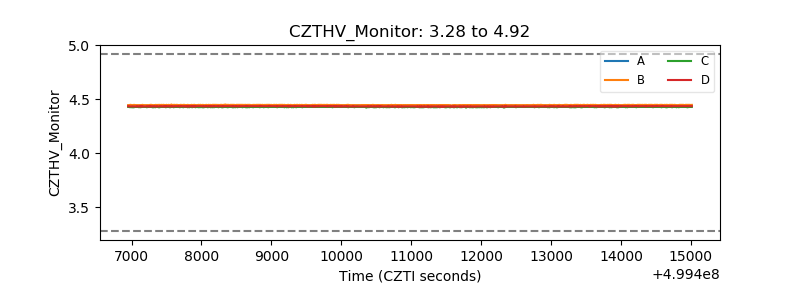 |
| D_VDD | 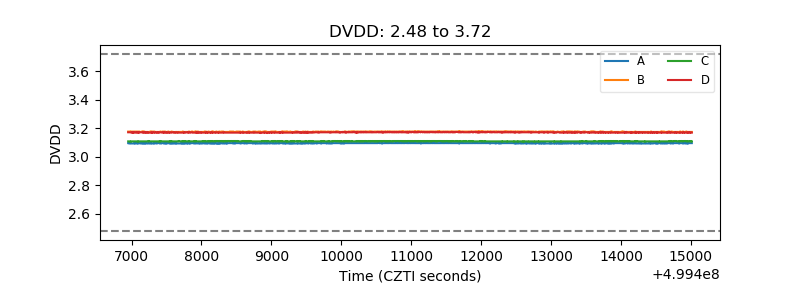 |
| Temperature 1 | 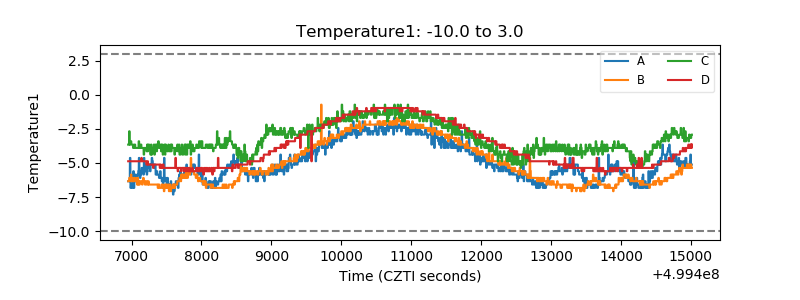 |
| Veto HV Monitor | 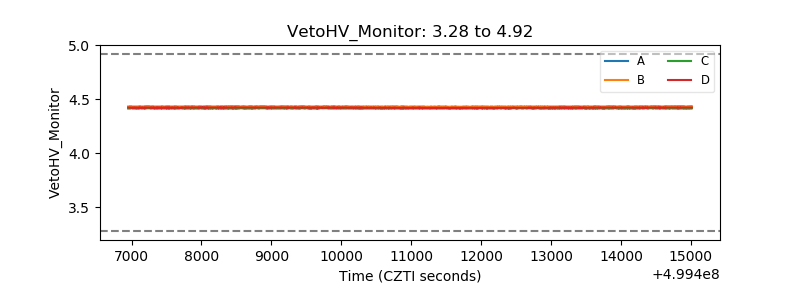 |
| Veto LLD | 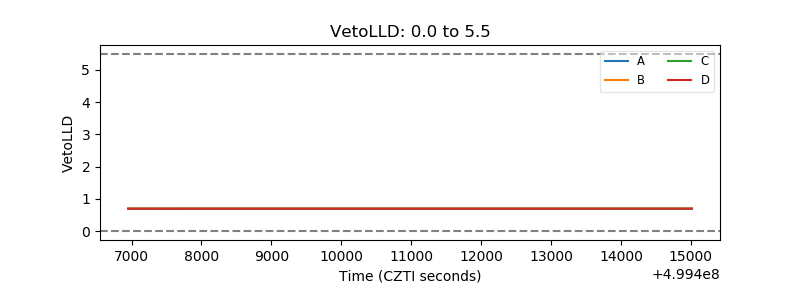 |
| Alpha Counter |  |
| _CPM_Rate | 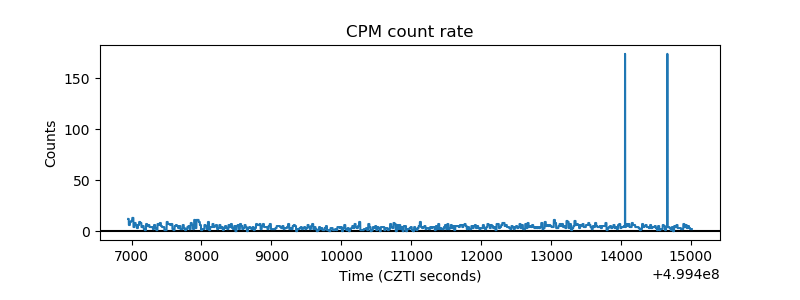 |
| CZT Counter | 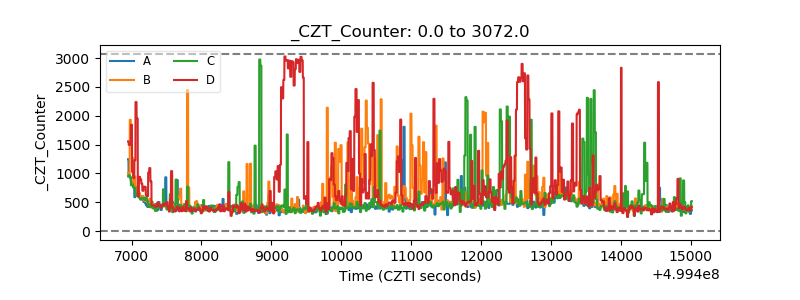 |
| +2.5 Volts monitor | 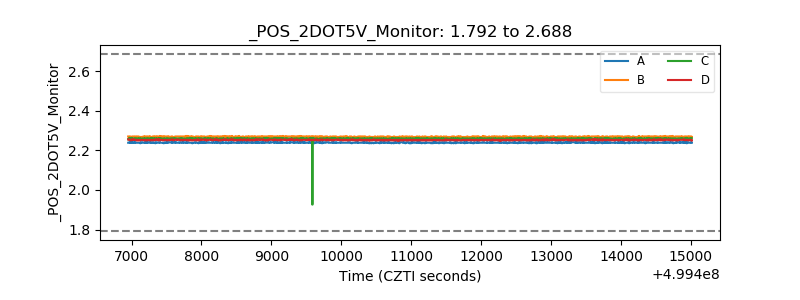 |
| +5 Volts monitor | 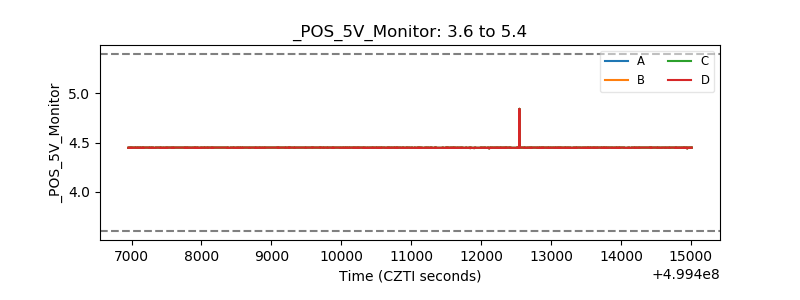 |
| _ROLL_ROT | 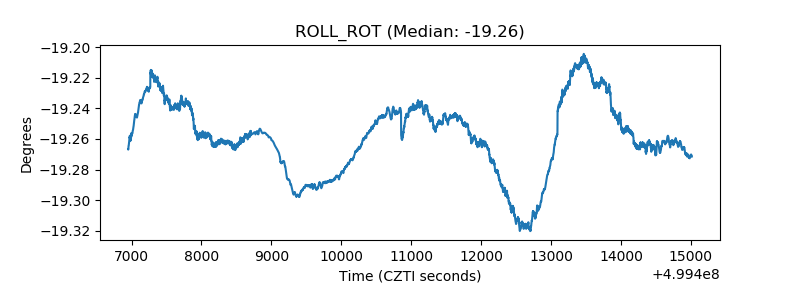 |
| _Roll_DEC | 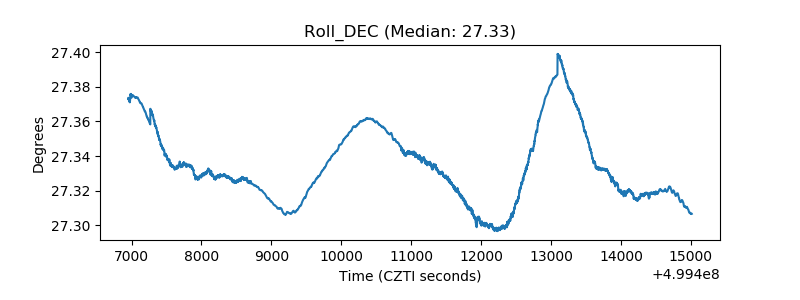 |
| _Roll_RA | 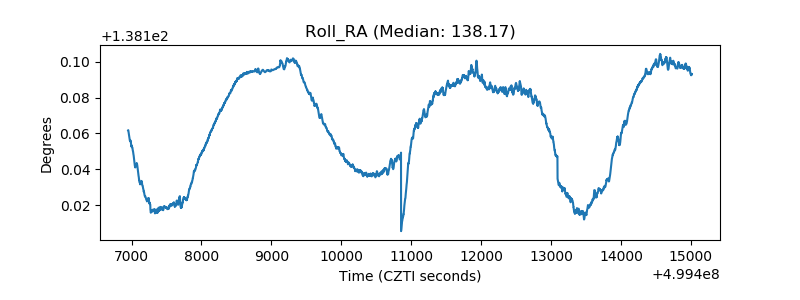 |
| Veto Counter | 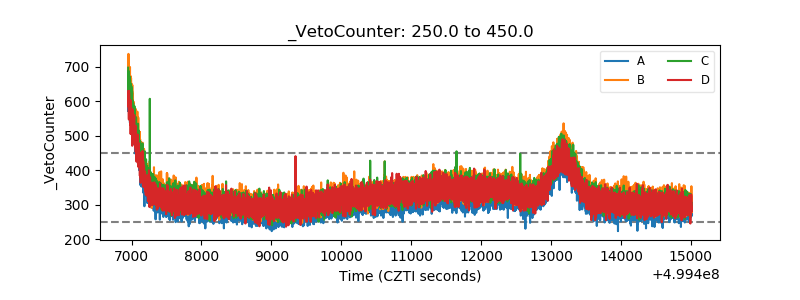 |