| Param | Original file | Final file |
|---|---|---|
| Filename | modeM0/AS1A14_127T09_9000006520_54565cztM0_level2.fits | modeM0/AS1A14_127T09_9000006520_54565cztM0_level2_quad_clean.evt |
| Size (bytes) | 291,983,040 | 66,522,240 |
| Size | 278.5 MB | 63.4 MB |
| Events in quadrant A | 2,583,129 | 430,943 |
| Events in quadrant B | 2,382,293 | 463,719 |
| Events in quadrant C | 3,285,895 | 390,510 |
| Events in quadrant D | 2,185,391 | 393,886 |
| Mode M0 | |||
|---|---|---|---|
| Quadrant | BADHDUFLAG | Total packets | Discarded packets |
| A | 0 | 13954 | 2884 |
| B | 0 | 13228 | 2838 |
| C | 0 | 16328 | 3177 |
| D | 0 | 12721 | 2648 |
| Mode SS | |||
|---|---|---|---|
| Quadrant | BADHDUFLAG | Total packets | Discarded packets |
| A | 0 | 124 | 20 |
| B | 0 | 124 | 22 |
| C | 0 | 126 | 30 |
| D | 0 | 124 | 22 |
| Quadrant | Total seconds | Saturated seconds | Saturation percentage |
|---|---|---|---|
| A | 4749 | 109 | 2.295220% |
| B | 4743 | 44 | 0.927683% |
| C | 4715 | 302 | 6.405090% |
| D | 4794 | 27 | 0.563204% |
Noise dominated data is calculated using 1-second bins in cleaned event files. If a bin has >2000 counts, and if more than 50% of those come from <1% of pixels, then it is considered to be noise-dominated and hence unusable.
| Quadrant | # 1 sec bins | Bins with >0 counts | Bins with >2000 counts | High rate bins dominated by noise | Noise dominated (total time) | Noise dominated (detector-on time) | Marked lightcurve |
|---|---|---|---|---|---|---|---|
| A | 6457 | 4988 | 92 | 92 | 1.42% | 1.84% | 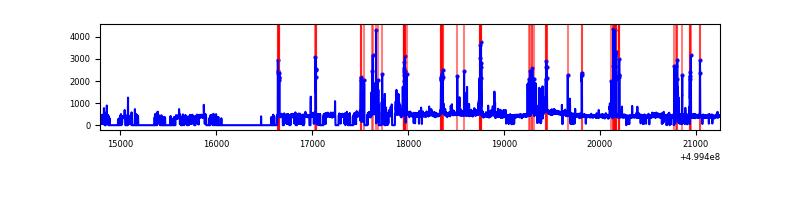 |
| B | 6457 | 4989 | 21 | 21 | 0.33% | 0.42% | 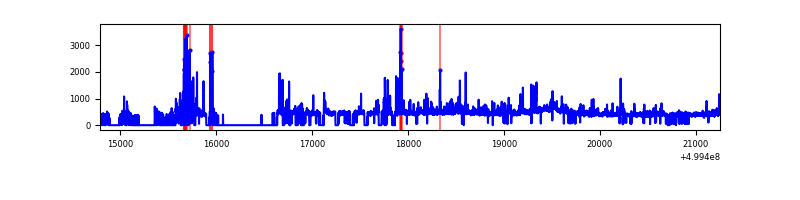 |
| C | 6463 | 4984 | 252 | 252 | 3.90% | 5.06% | 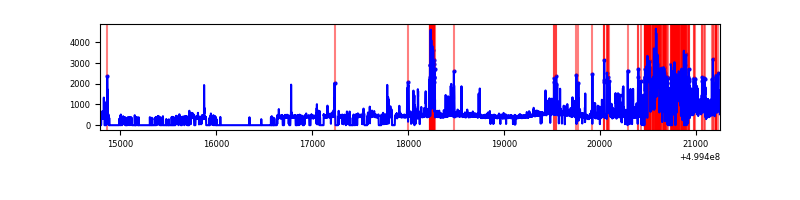 |
| D | 6458 | 5035 | 20 | 20 | 0.31% | 0.40% | 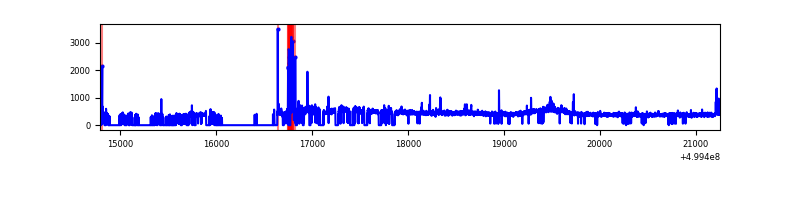 |
Top three noisy pixels from each quadrant. If the there are fewer than three noisy pixels in the level2.evt file, extra rows are filled as -1
| Pixel properties | Quadrant properties | ||||||
|---|---|---|---|---|---|---|---|
| Quadrant | DetID | PixID | Counts | Sigma | Mean | Median | Sigma |
| A | 11 | 3 | 317243 | 2506.97 | 505 | 493 | 126.3 |
| A | 0 | 8 | 110546 | 871.03 | 505 | 493 | 126.3 |
| A | 3 | 110 | 69191 | 543.72 | 505 | 493 | 126.3 |
| B | 10 | 14 | 147019 | 1334.57 | 505 | 487 | 109.8 |
| B | 2 | 249 | 99237 | 899.39 | 505 | 487 | 109.8 |
| B | 0 | 213 | 37103 | 333.49 | 505 | 487 | 109.8 |
| C | 12 | 254 | 772514 | 5796.69 | 479 | 475 | 133.2 |
| C | 13 | 3 | 319050 | 2391.95 | 479 | 475 | 133.2 |
| C | 14 | 254 | 205523 | 1539.56 | 479 | 475 | 133.2 |
| D | 15 | 94 | 86499 | 612.67 | 495 | 473 | 140.4 |
| D | 2 | 172 | 53709 | 379.14 | 495 | 473 | 140.4 |
| D | 5 | 173 | 40734 | 286.74 | 495 | 473 | 140.4 |
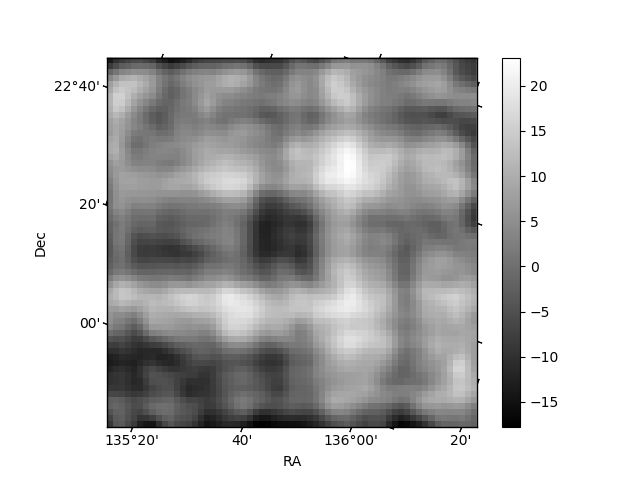
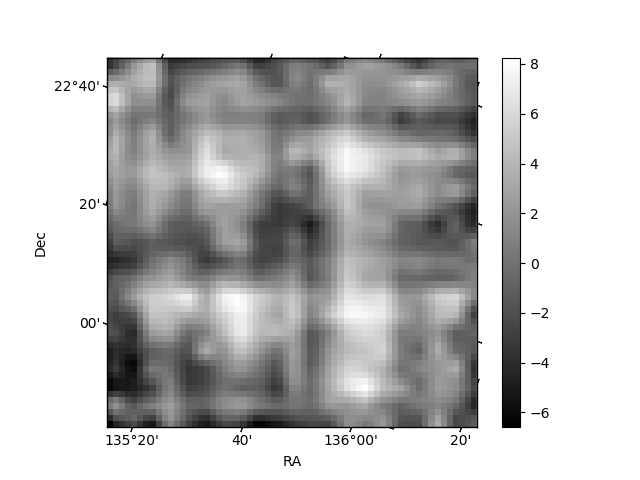
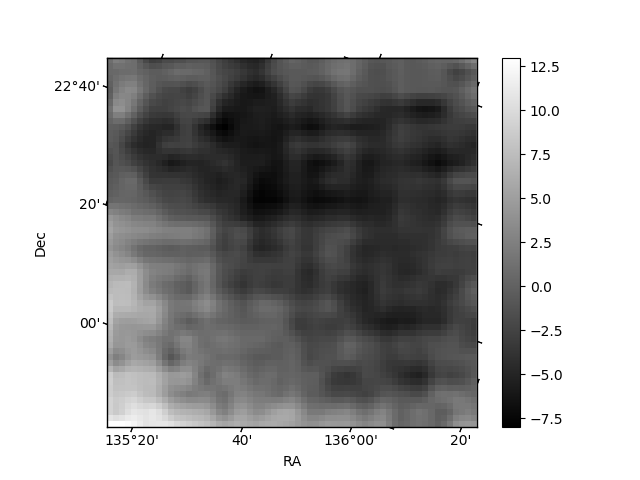
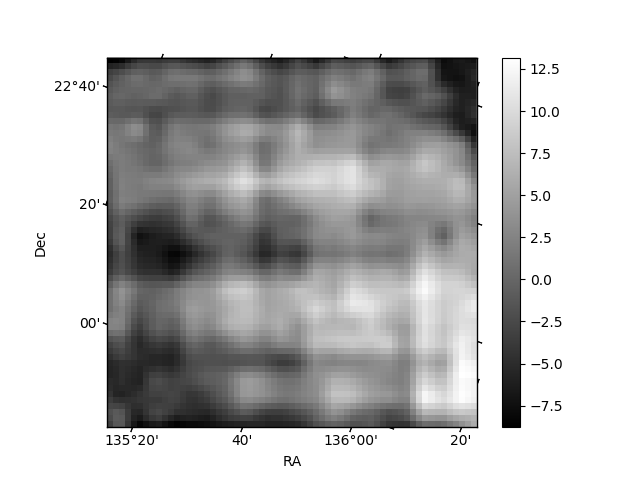
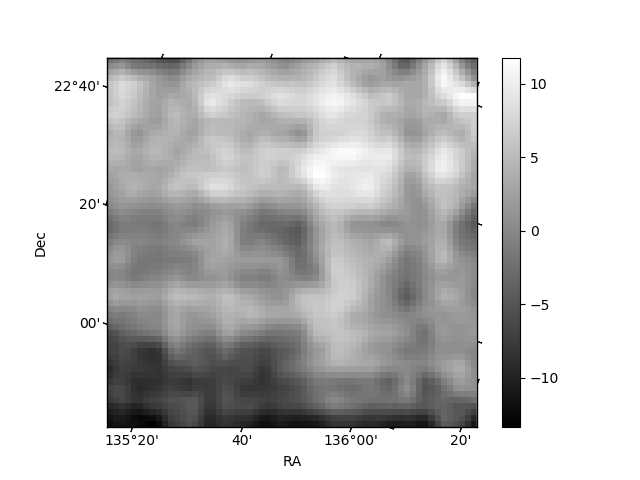
Histogram calculated using DETX and DETY for each event in the final _common_clean file
| Quadrant A | 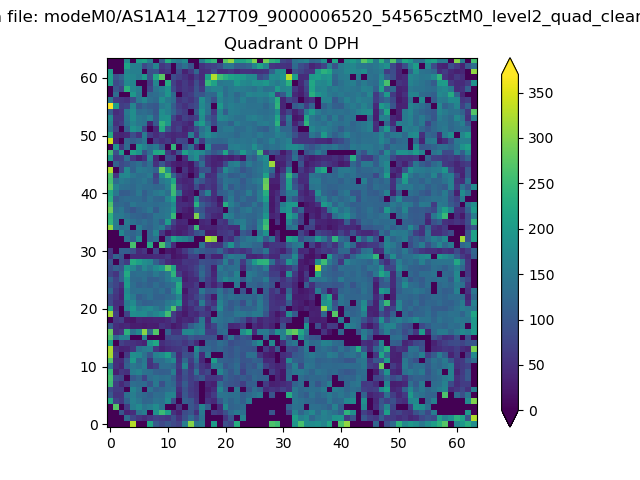 |
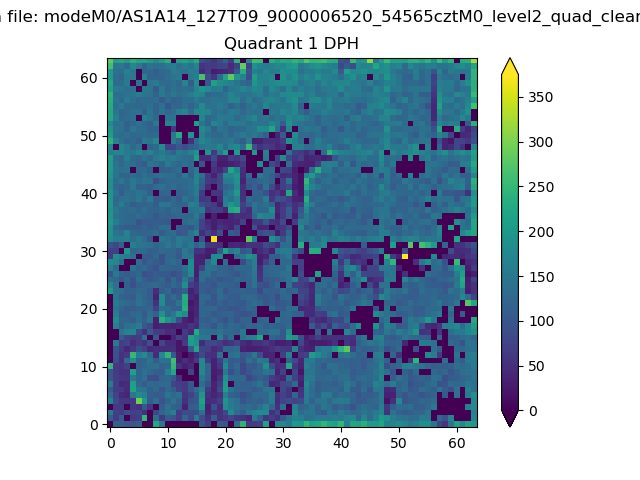 |
Quadrant B |
|---|---|---|---|
| Quadrant D | 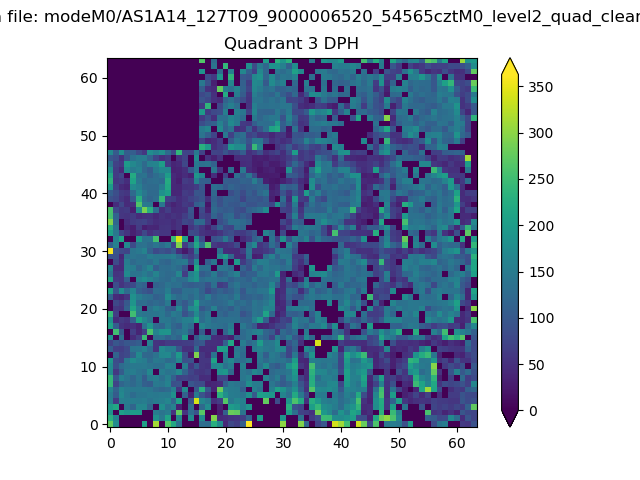 |
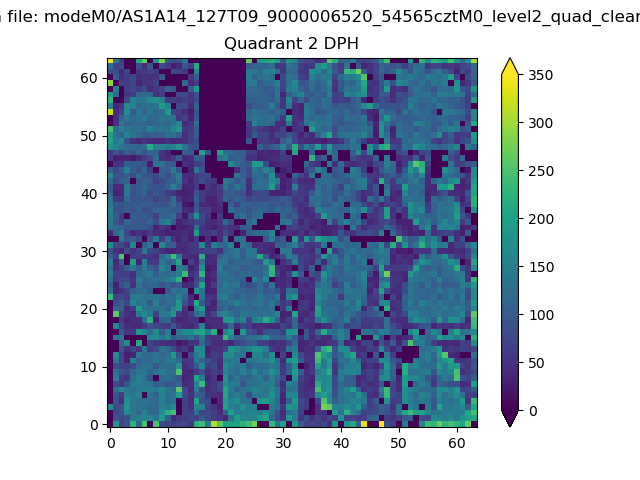 |
Quadrant C |
| Plot type | Count rate plots | Images |
|---|---|---|
| Comparison with Poisson distribution Blue bars denote a histogram of data divided into 1 sec bins. Red curve is a Poisson curve with rate = median count rate of data. |
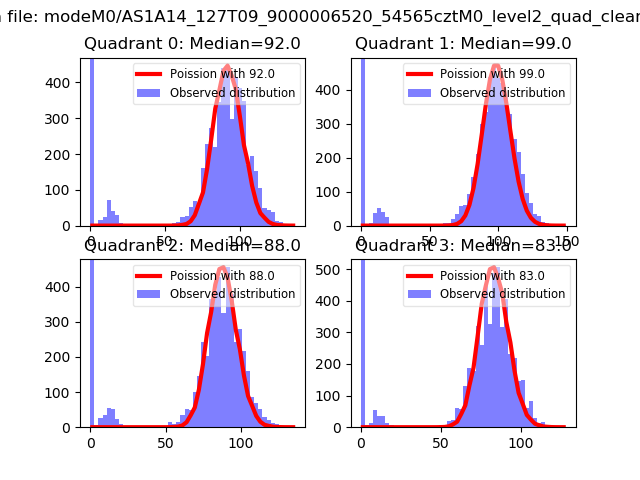 |
 |
| Quadrant-wise count rates Data is divided into 100 sec bins |
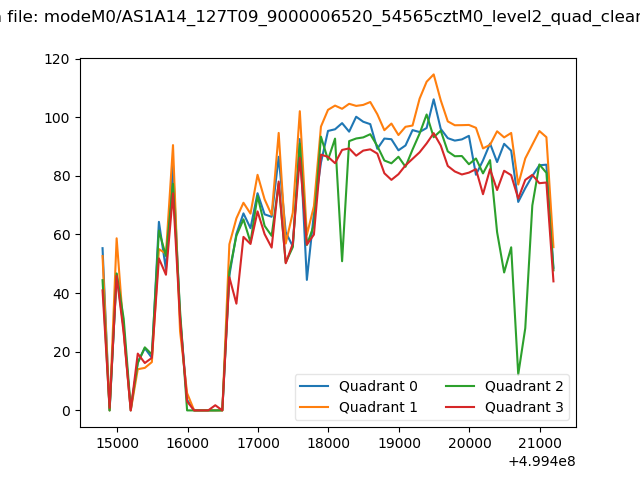 |
|
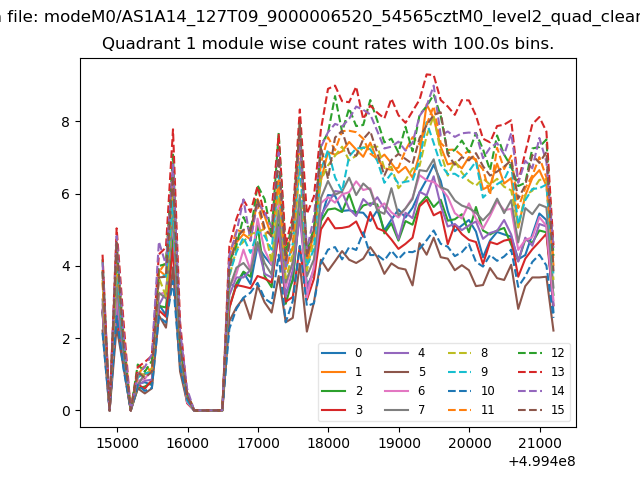
| Module-wise count rates for Quadrant A Data is divided into 100 sec bins |
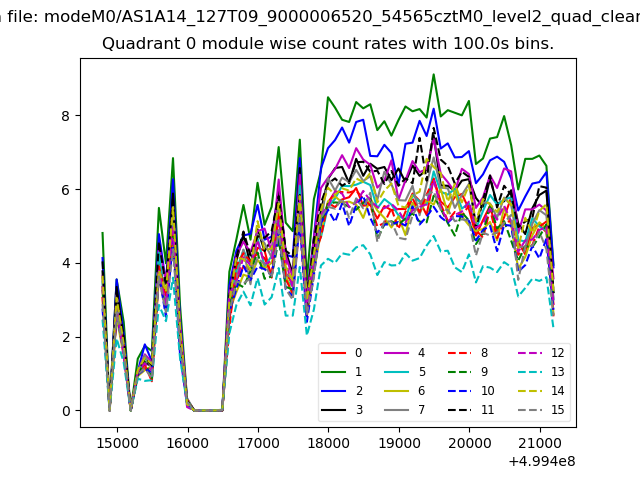 |
 |
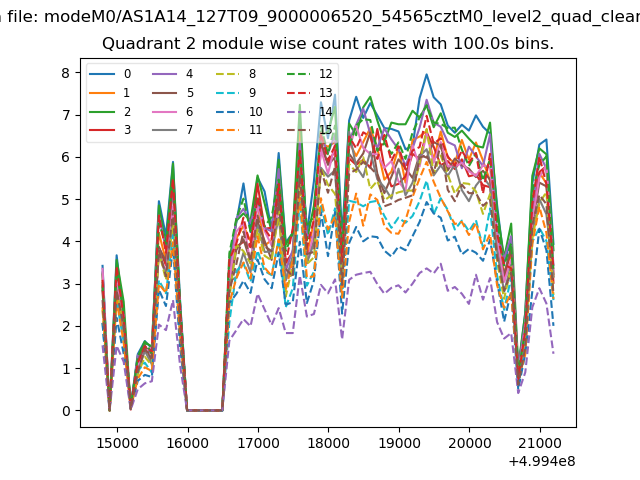
| Module-wise count rates for Quadrant B Data is divided into 100 sec bins |
 |
 |
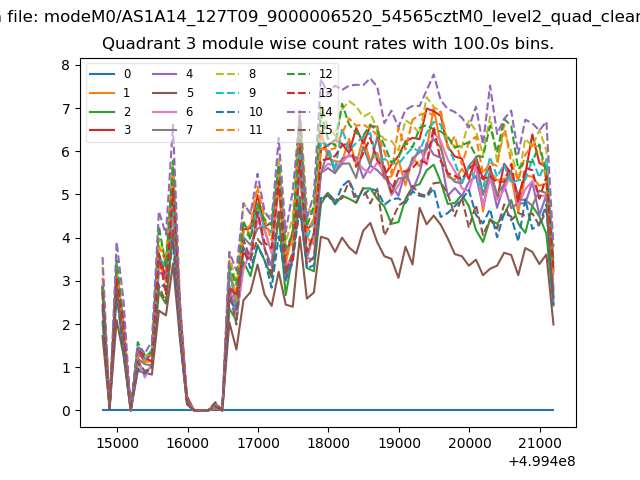
| Module-wise count rates for Quadrant C Data is divided into 100 sec bins |
 |
 |
| Module-wise count rates for Quadrant D Data is divided into 100 sec bins |
 |
 |
| Parameter | Plot |
|---|---|
| CZT HV Monitor | 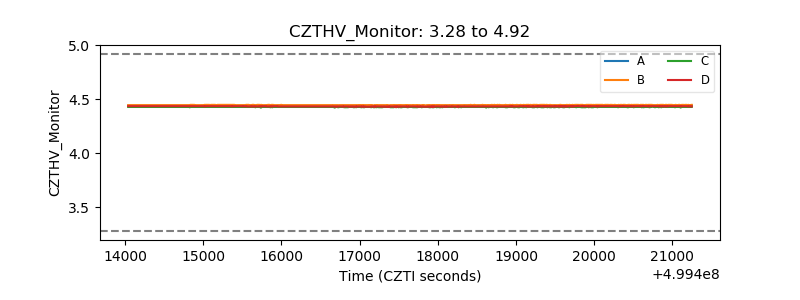 |
| D_VDD | 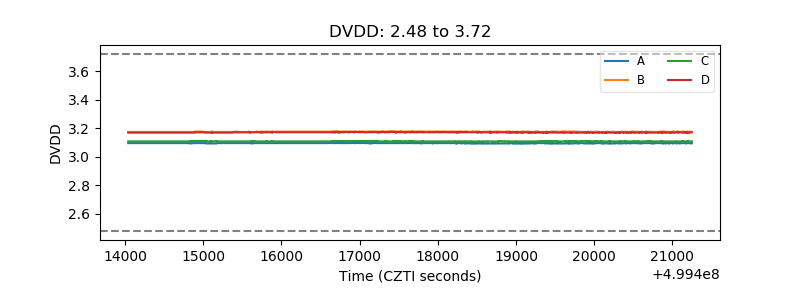 |
| Temperature 1 | 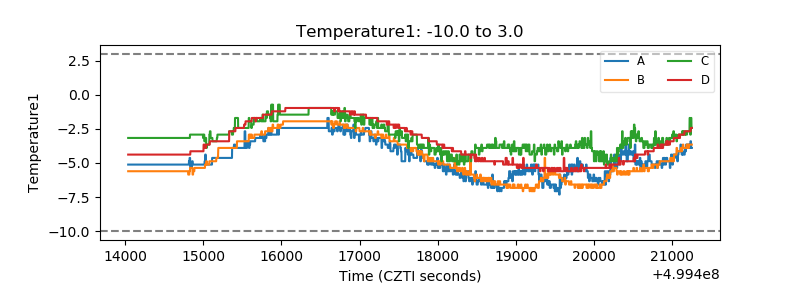 |
| Veto HV Monitor | 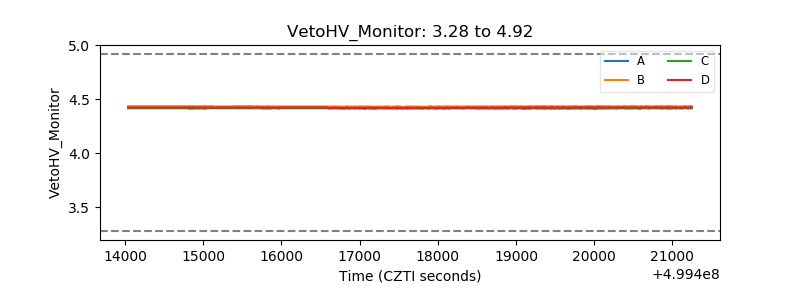 |
| Veto LLD | 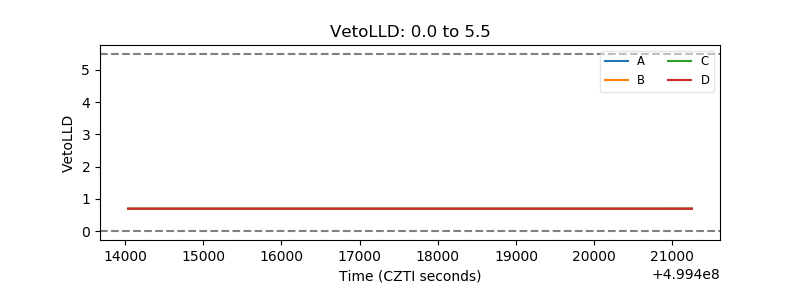 |
| Alpha Counter | 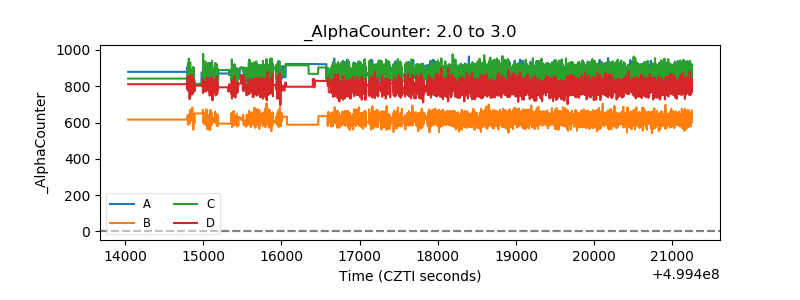 |
| _CPM_Rate | 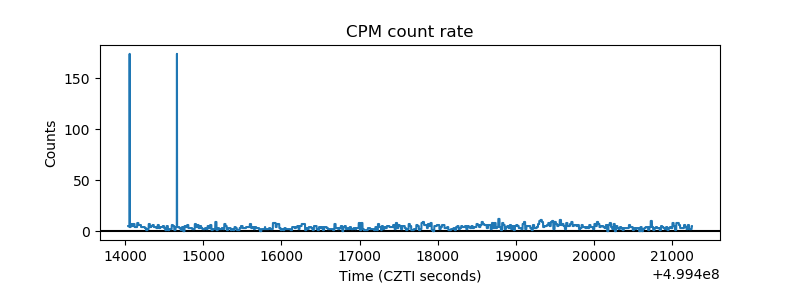 |
| CZT Counter | 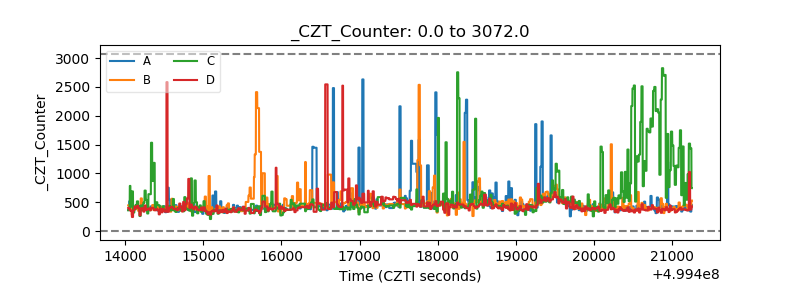 |
| +2.5 Volts monitor | 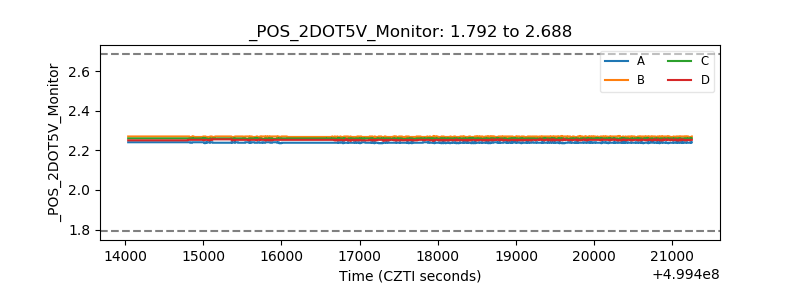 |
| +5 Volts monitor | 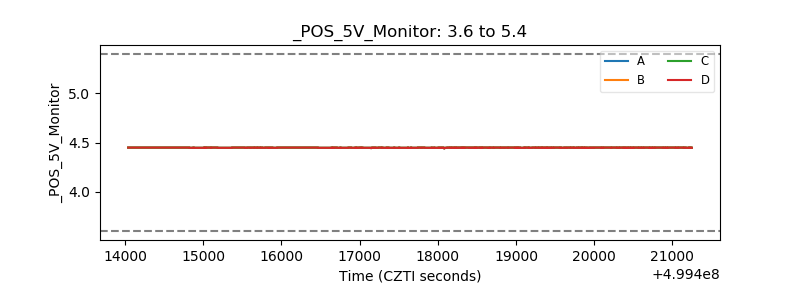 |
| _ROLL_ROT | 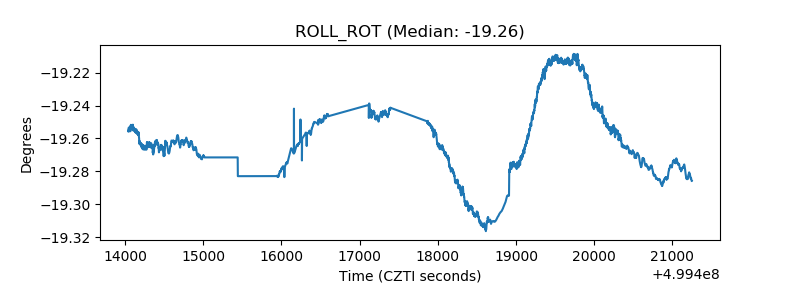 |
| _Roll_DEC | 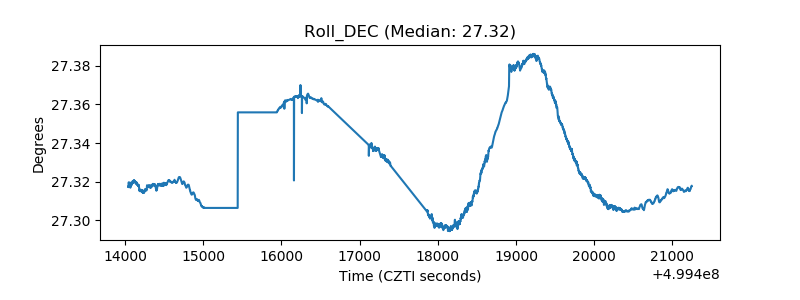 |
| _Roll_RA | 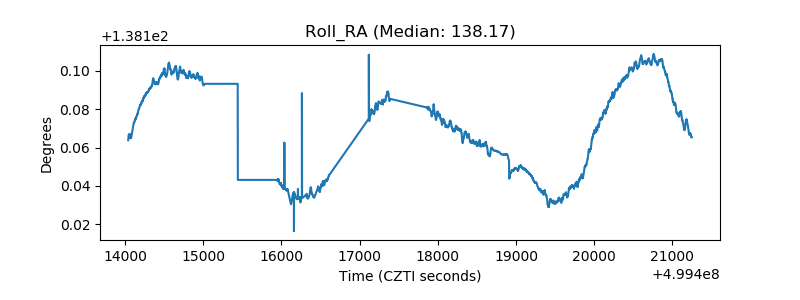 |
| Veto Counter | 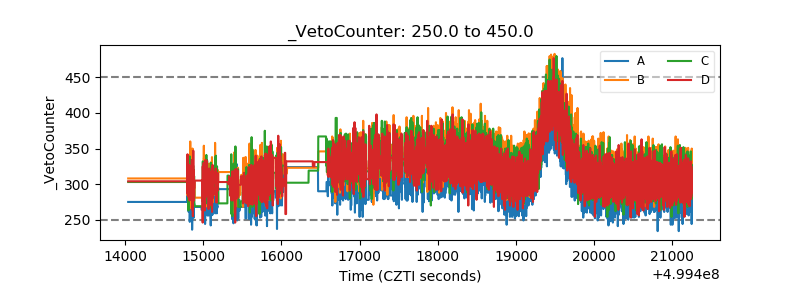 |