| Param | Original file | Final file |
|---|---|---|
| Filename | modeM0/AS1A14_127T09_9000006520_54568cztM0_level2.fits | modeM0/AS1A14_127T09_9000006520_54568cztM0_level2_quad_clean.evt |
| Size (bytes) | 908,498,880 | 176,155,200 |
| Size | 866.4 MB | 168.0 MB |
| Events in quadrant A | 7,358,244 | 1,130,852 |
| Events in quadrant B | 6,877,683 | 1,247,501 |
| Events in quadrant C | 10,050,982 | 1,053,623 |
| Events in quadrant D | 8,359,866 | 1,024,029 |
| Mode M0 | |||
|---|---|---|---|
| Quadrant | BADHDUFLAG | Total packets | Discarded packets |
| A | 0 | 30833 | 1 |
| B | 0 | 29360 | 1 |
| C | 0 | 38791 | 1 |
| D | 0 | 34075 | 1 |
| Mode SS | |||
|---|---|---|---|
| Quadrant | BADHDUFLAG | Total packets | Discarded packets |
| A | 0 | 256 | 0 |
| B | 0 | 256 | 0 |
| C | 0 | 256 | 0 |
| D | 0 | 256 | 0 |
| Mode M9 | |||
|---|---|---|---|
| Quadrant | BADHDUFLAG | Total packets | Discarded packets |
| A | 0 | 3 | 0 |
| B | 0 | 3 | 0 |
| C | 0 | 3 | 0 |
| D | 0 | 3 | 0 |
| Quadrant | Total seconds | Saturated seconds | Saturation percentage |
|---|---|---|---|
| A | 12692 | 727 | 5.728018% |
| B | 12692 | 323 | 2.544910% |
| C | 12692 | 906 | 7.138355% |
| D | 12692 | 559 | 4.404349% |
Noise dominated data is calculated using 1-second bins in cleaned event files. If a bin has >2000 counts, and if more than 50% of those come from <1% of pixels, then it is considered to be noise-dominated and hence unusable.
| Quadrant | # 1 sec bins | Bins with >0 counts | Bins with >2000 counts | High rate bins dominated by noise | Noise dominated (total time) | Noise dominated (detector-on time) | Marked lightcurve |
|---|---|---|---|---|---|---|---|
| A | 12987 | 12693 | 458 | 458 | 3.53% | 3.61% | 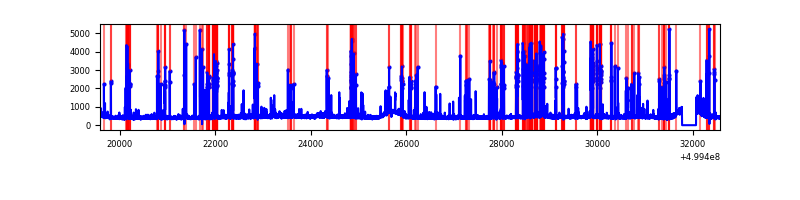 |
| B | 12987 | 12693 | 69 | 69 | 0.53% | 0.54% | 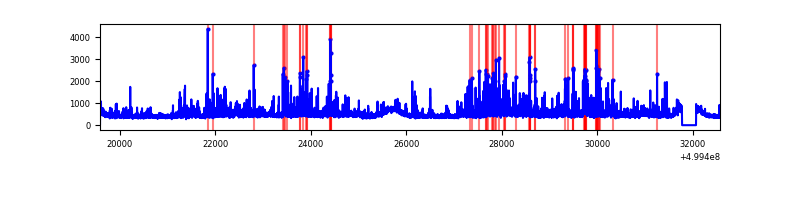 |
| C | 12987 | 12693 | 710 | 710 | 5.47% | 5.59% | 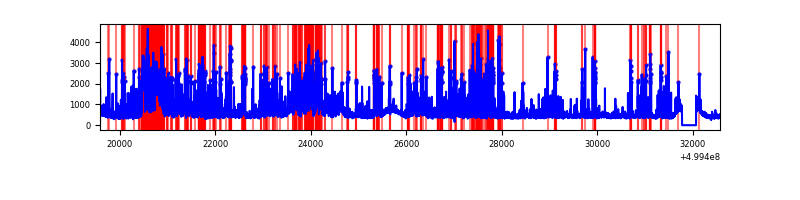 |
| D | 12987 | 12693 | 417 | 417 | 3.21% | 3.29% | 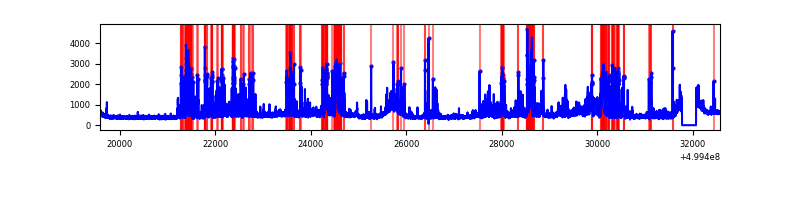 |
Top three noisy pixels from each quadrant. If the there are fewer than three noisy pixels in the level2.evt file, extra rows are filled as -1
| Pixel properties | Quadrant properties | ||||||
|---|---|---|---|---|---|---|---|
| Quadrant | DetID | PixID | Counts | Sigma | Mean | Median | Sigma |
| A | 11 | 3 | 1667231 | 5013.0 | 1349 | 1317 | 332.3 |
| A | 4 | 3 | 138948 | 414.15 | 1349 | 1317 | 332.3 |
| A | 3 | 14 | 135647 | 404.22 | 1349 | 1317 | 332.3 |
| B | 10 | 14 | 472420 | 1622.69 | 1357 | 1306 | 290.3 |
| B | 0 | 213 | 234373 | 802.77 | 1357 | 1306 | 290.3 |
| B | 10 | 247 | 158588 | 541.74 | 1357 | 1306 | 290.3 |
| C | 12 | 254 | 2468220 | 6952.21 | 1307 | 1296 | 354.8 |
| C | 13 | 3 | 979403 | 2756.47 | 1307 | 1296 | 354.8 |
| C | 9 | 38 | 696355 | 1958.79 | 1307 | 1296 | 354.8 |
| D | 3 | 12 | 1146607 | 3052.74 | 1323 | 1262 | 375.2 |
| D | 15 | 94 | 889334 | 2367.02 | 1323 | 1262 | 375.2 |
| D | 1 | 3 | 326677 | 867.34 | 1323 | 1262 | 375.2 |
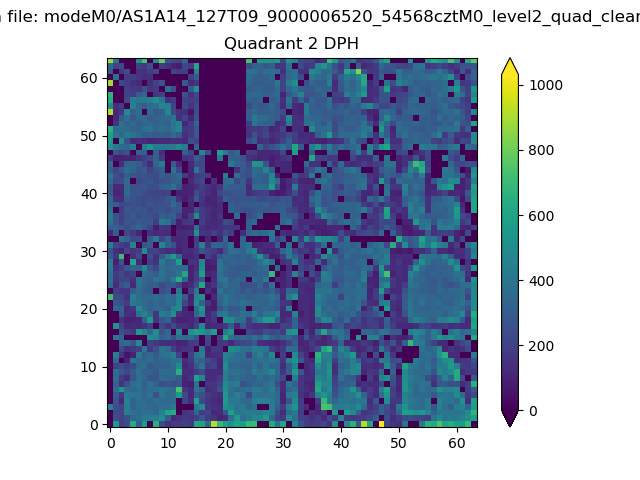
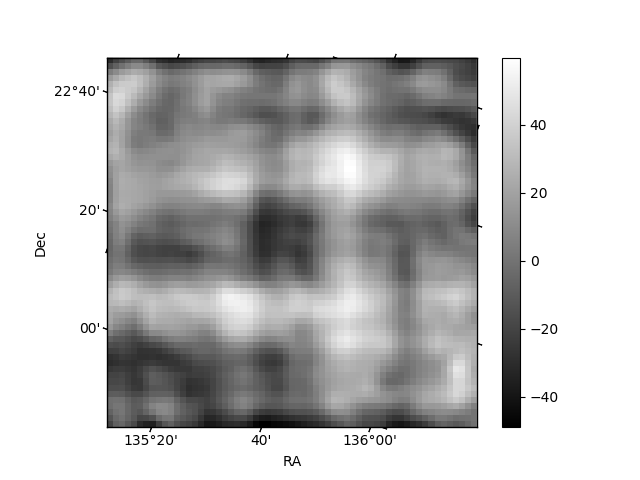
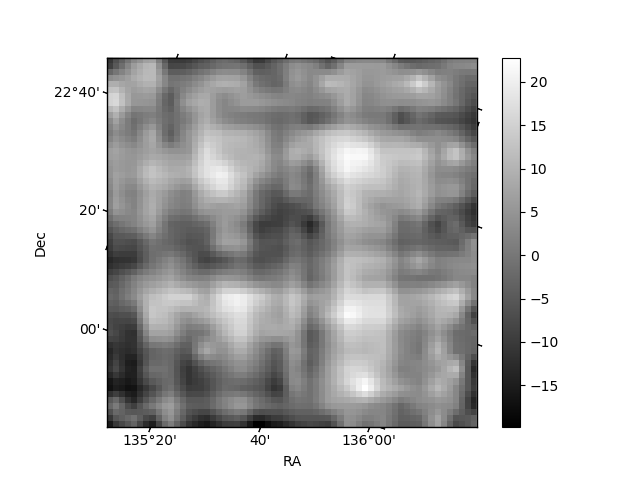
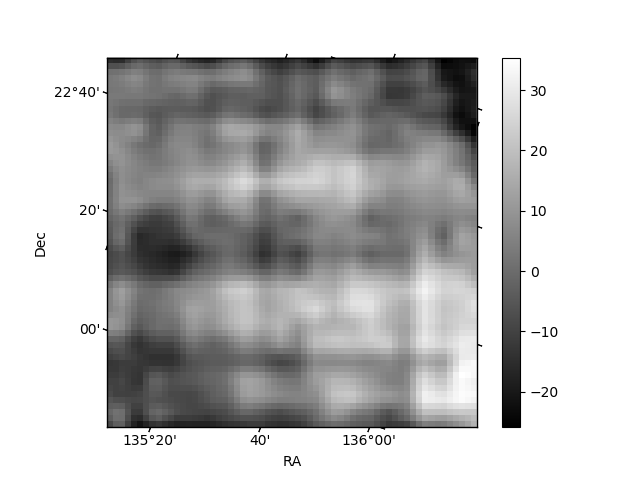
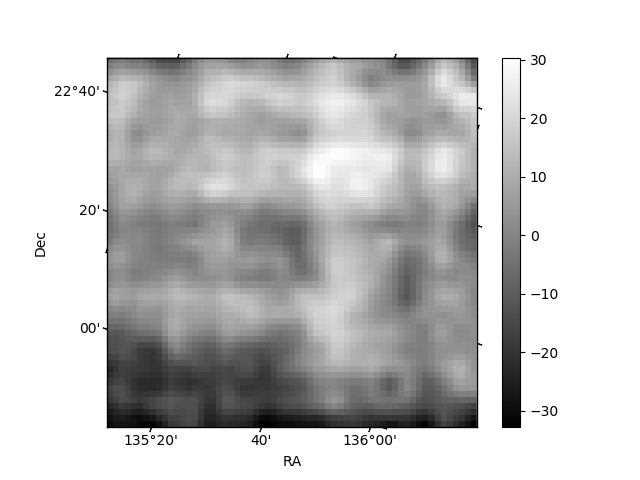
Histogram calculated using DETX and DETY for each event in the final _common_clean file
| Quadrant A | 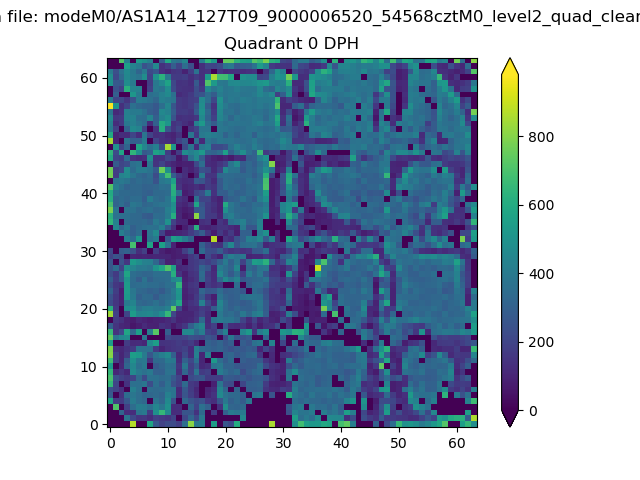 |
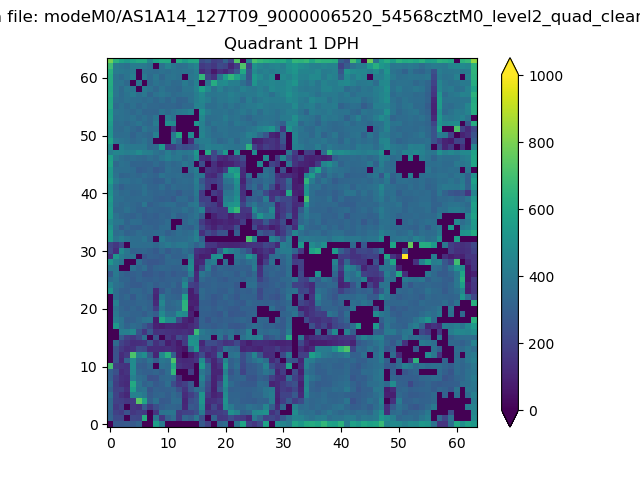 |
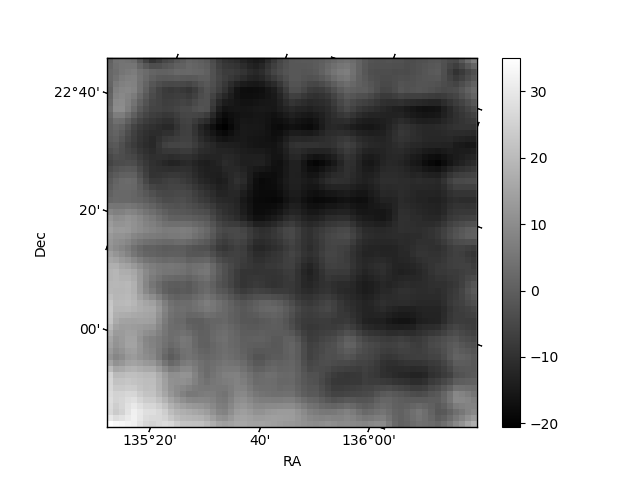
Quadrant B |
|---|---|---|---|
| Quadrant D | 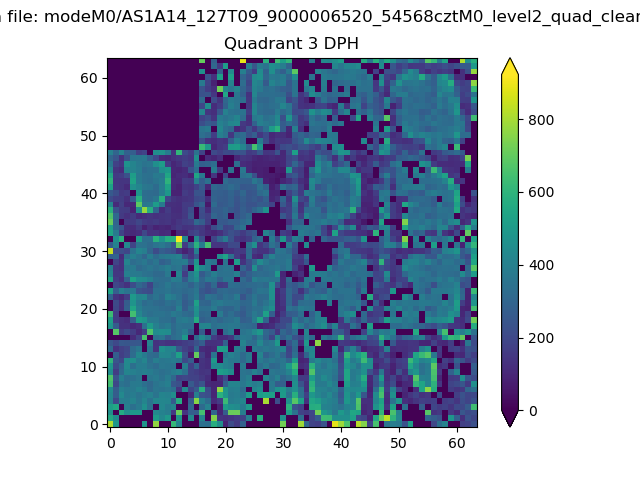 |
 |
Quadrant C |
| Plot type | Count rate plots | Images |
|---|---|---|
| Comparison with Poisson distribution Blue bars denote a histogram of data divided into 1 sec bins. Red curve is a Poisson curve with rate = median count rate of data. |
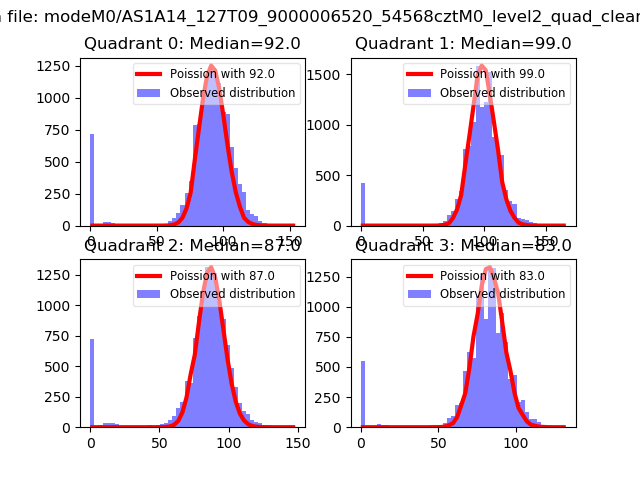 |
 |
| Quadrant-wise count rates Data is divided into 100 sec bins |
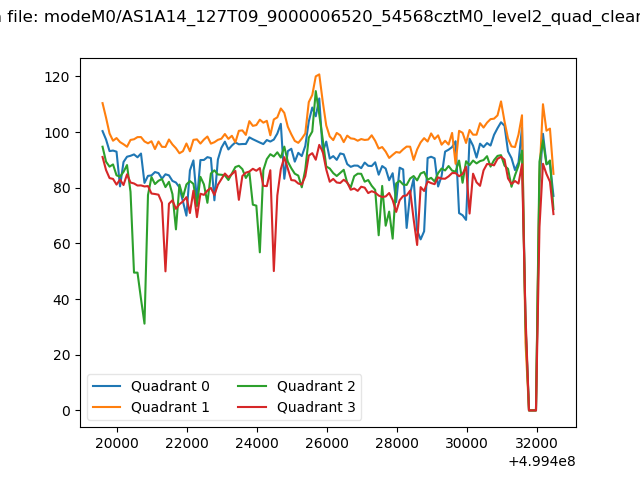 |
|
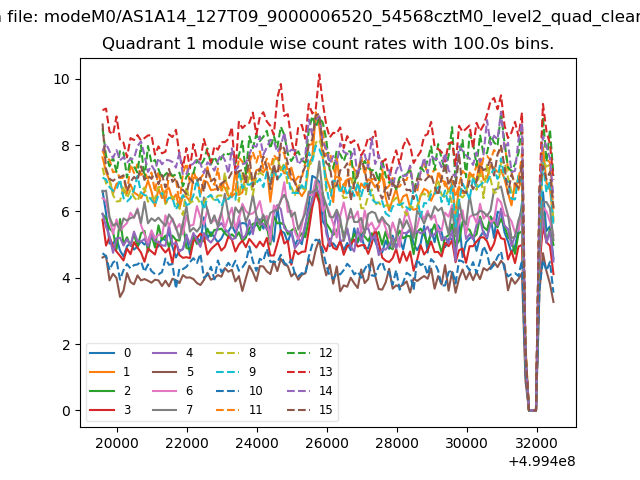
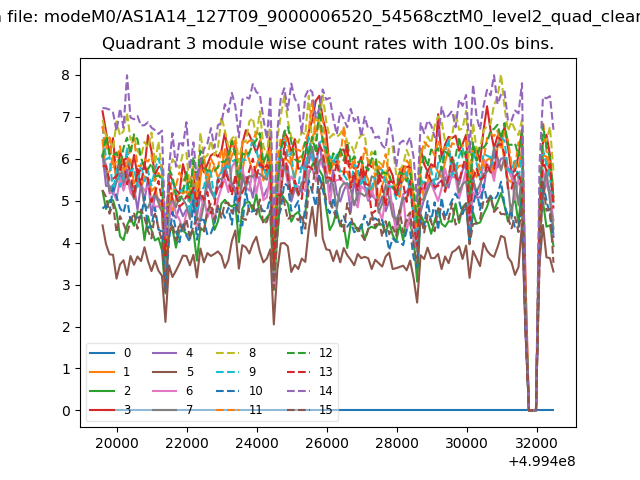
| Module-wise count rates for Quadrant A Data is divided into 100 sec bins |
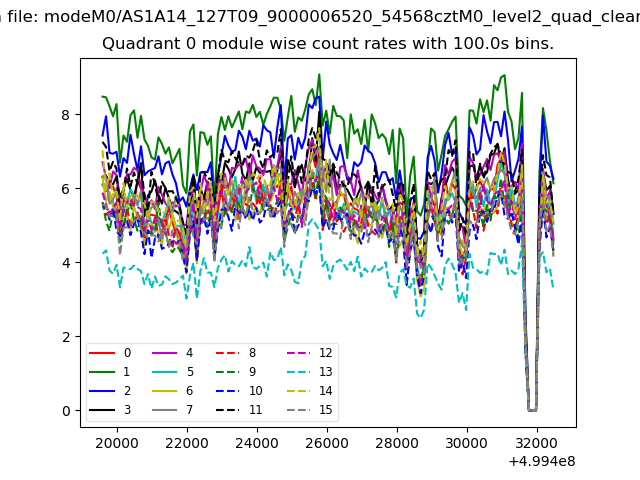 |
 |
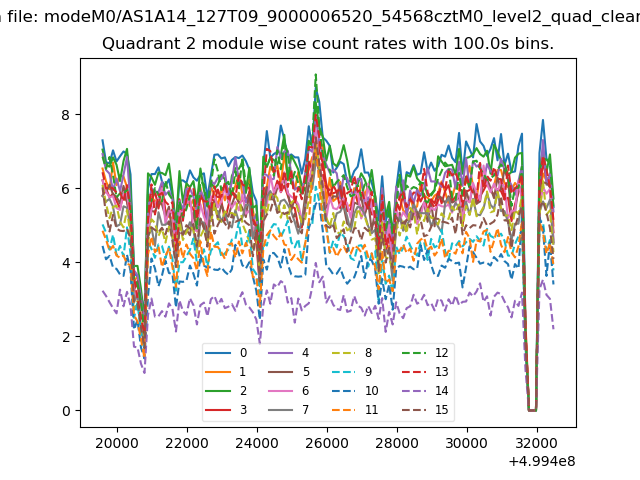
| Module-wise count rates for Quadrant B Data is divided into 100 sec bins |
 |
 |
| Module-wise count rates for Quadrant C Data is divided into 100 sec bins |
 |
 |
| Module-wise count rates for Quadrant D Data is divided into 100 sec bins |
 |
 |
| Parameter | Plot |
|---|---|
| CZT HV Monitor | 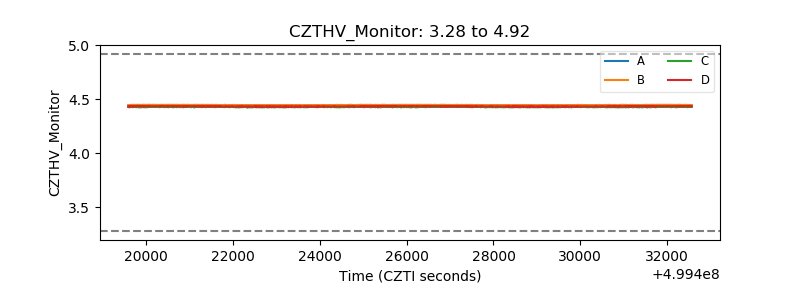 |
| D_VDD | 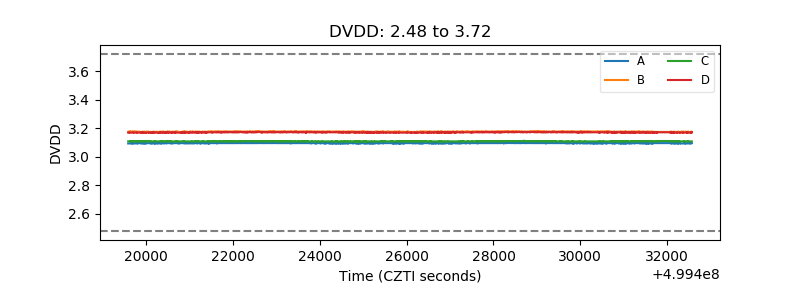 |
| Temperature 1 | 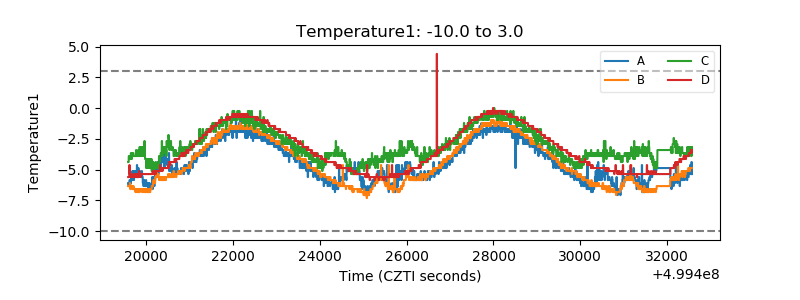 |
| Veto HV Monitor | 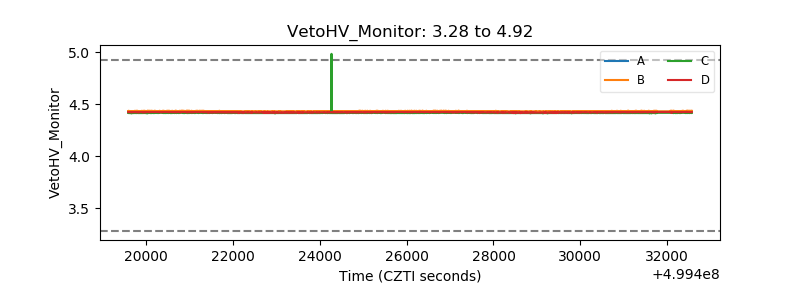 |
| Veto LLD | 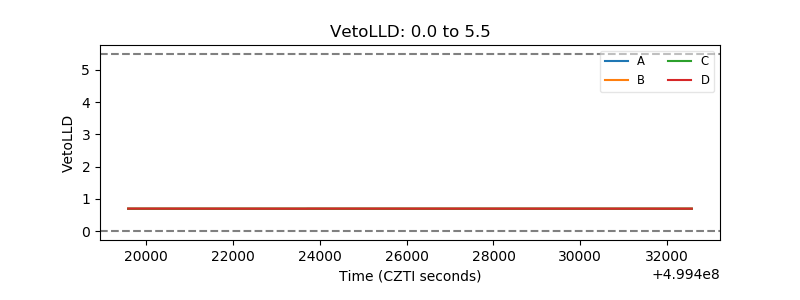 |
| Alpha Counter | 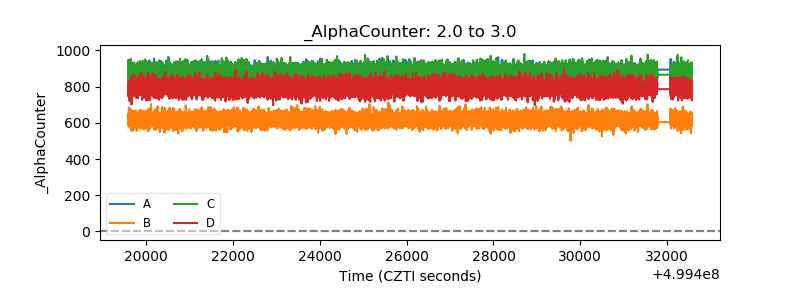 |
| _CPM_Rate | 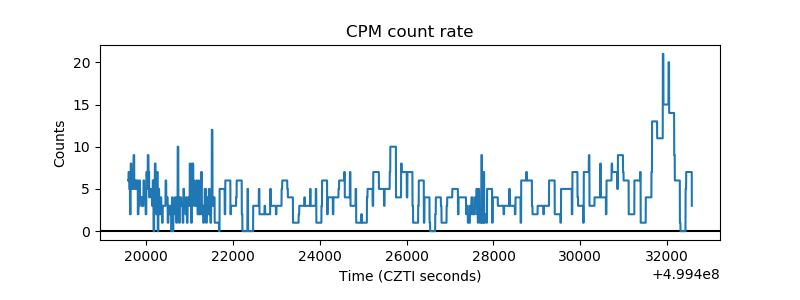 |
| CZT Counter | 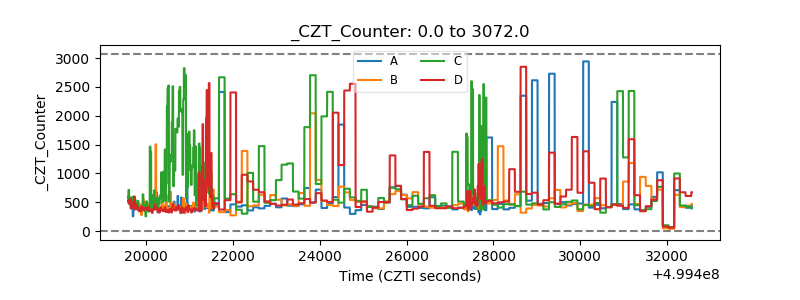 |
| +2.5 Volts monitor |  |
| +5 Volts monitor |  |
| _ROLL_ROT | 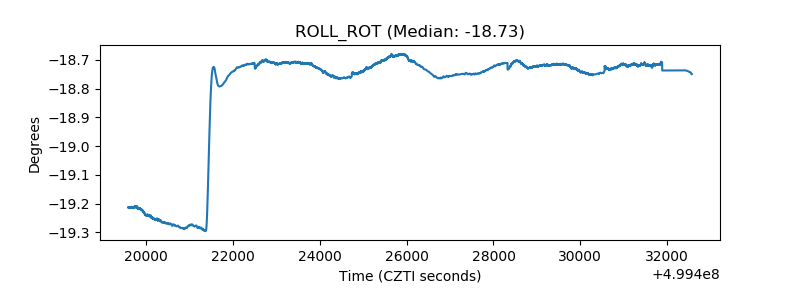 |
| _Roll_DEC | 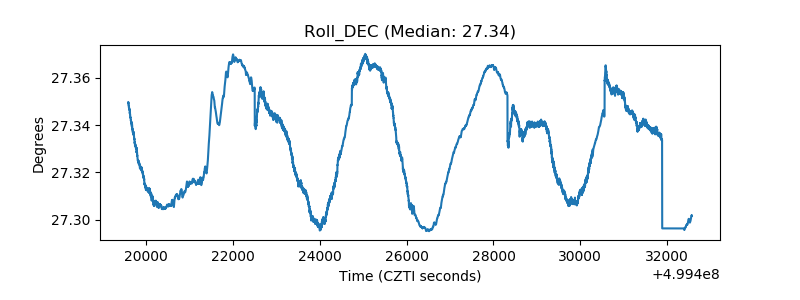 |
| _Roll_RA | 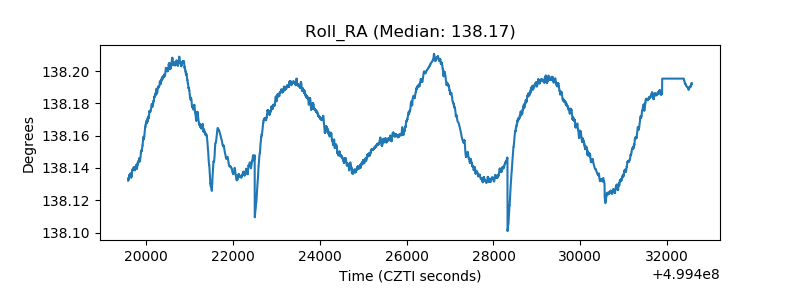 |
| Veto Counter | 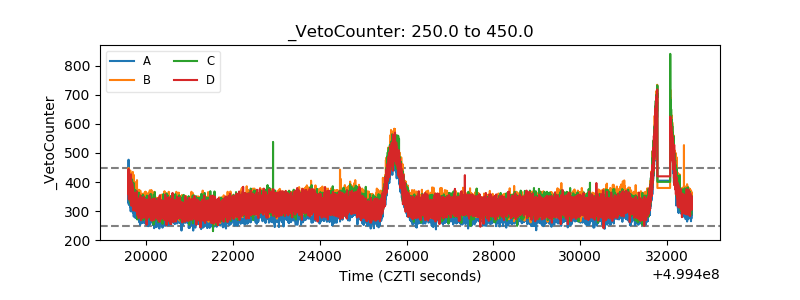 |