| Param | Original file | Final file |
|---|---|---|
| Filename | modeM0/AS1A14_127T09_9000006520_54569cztM0_level2.fits | modeM0/AS1A14_127T09_9000006520_54569cztM0_level2_quad_clean.evt |
| Size (bytes) | 873,253,440 | 179,547,840 |
| Size | 832.8 MB | 171.2 MB |
| Events in quadrant A | 8,727,376 | 1,111,807 |
| Events in quadrant B | 8,591,986 | 1,233,855 |
| Events in quadrant C | 6,955,989 | 1,121,732 |
| Events in quadrant D | 7,038,502 | 1,067,693 |
| Mode M0 | |||
|---|---|---|---|
| Quadrant | BADHDUFLAG | Total packets | Discarded packets |
| A | 0 | 34285 | 3 |
| B | 0 | 34530 | 3 |
| C | 0 | 30084 | 3 |
| D | 0 | 30066 | 3 |
| Mode SS | |||
|---|---|---|---|
| Quadrant | BADHDUFLAG | Total packets | Discarded packets |
| A | 0 | 266 | 0 |
| B | 0 | 266 | 0 |
| C | 0 | 266 | 0 |
| D | 0 | 266 | 0 |
| Mode M9 | |||
|---|---|---|---|
| Quadrant | BADHDUFLAG | Total packets | Discarded packets |
| A | 0 | 17 | 0 |
| B | 0 | 17 | 0 |
| C | 0 | 17 | 0 |
| D | 0 | 17 | 0 |
| Quadrant | Total seconds | Saturated seconds | Saturation percentage |
|---|---|---|---|
| A | 13041 | 1105 | 8.473277% |
| B | 13041 | 906 | 6.947320% |
| C | 13041 | 420 | 3.220612% |
| D | 13041 | 291 | 2.231424% |
Noise dominated data is calculated using 1-second bins in cleaned event files. If a bin has >2000 counts, and if more than 50% of those come from <1% of pixels, then it is considered to be noise-dominated and hence unusable.
| Quadrant | # 1 sec bins | Bins with >0 counts | Bins with >2000 counts | High rate bins dominated by noise | Noise dominated (total time) | Noise dominated (detector-on time) | Marked lightcurve |
|---|---|---|---|---|---|---|---|
| A | 14671 | 13044 | 764 | 764 | 5.21% | 5.86% | 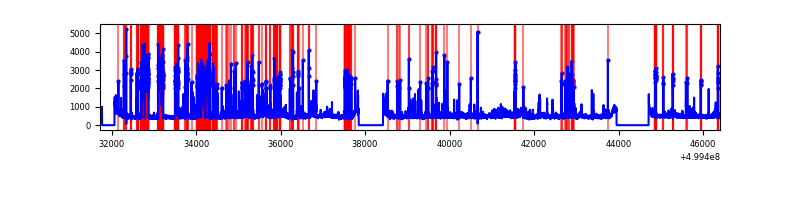 |
| B | 14671 | 13044 | 368 | 368 | 2.51% | 2.82% | 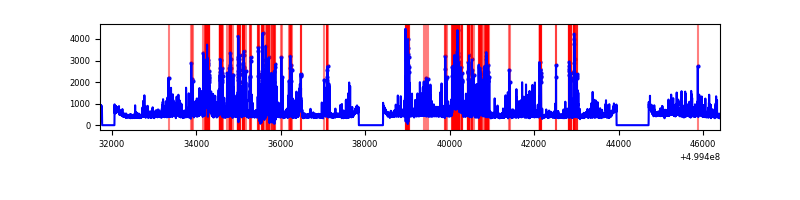 |
| C | 14671 | 13044 | 164 | 164 | 1.12% | 1.26% | 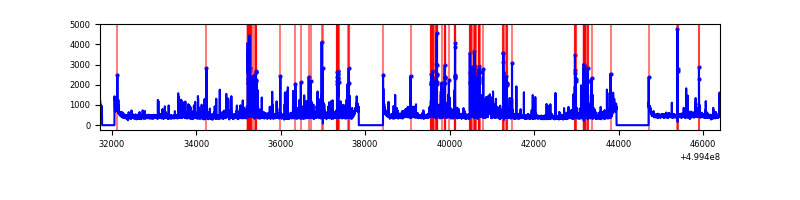 |
| D | 14671 | 13044 | 48 | 48 | 0.33% | 0.37% | 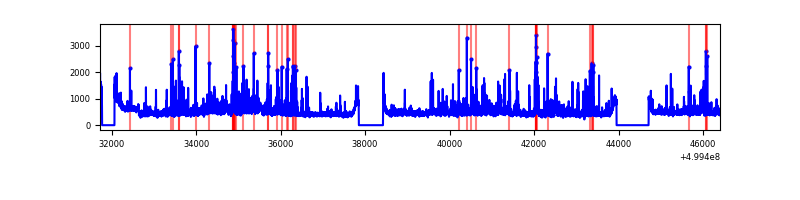 |
Top three noisy pixels from each quadrant. If the there are fewer than three noisy pixels in the level2.evt file, extra rows are filled as -1
| Pixel properties | Quadrant properties | ||||||
|---|---|---|---|---|---|---|---|
| Quadrant | DetID | PixID | Counts | Sigma | Mean | Median | Sigma |
| A | 11 | 3 | 2290926 | 6703.04 | 1395 | 1358 | 341.6 |
| A | 14 | 235 | 413468 | 1206.51 | 1395 | 1358 | 341.6 |
| A | 4 | 3 | 189440 | 550.64 | 1395 | 1358 | 341.6 |
| B | 2 | 249 | 1010078 | 3401.52 | 1392 | 1343 | 296.6 |
| B | 4 | 171 | 454590 | 1528.38 | 1392 | 1343 | 296.6 |
| B | 0 | 213 | 407148 | 1368.4 | 1392 | 1343 | 296.6 |
| C | 13 | 3 | 412427 | 1088.91 | 1388 | 1374 | 377.5 |
| C | 14 | 254 | 352760 | 930.85 | 1388 | 1374 | 377.5 |
| C | 9 | 38 | 97714 | 255.21 | 1388 | 1374 | 377.5 |
| D | 3 | 12 | 490537 | 1248.43 | 1398 | 1339 | 391.9 |
| D | 2 | 172 | 205990 | 522.27 | 1398 | 1339 | 391.9 |
| D | 15 | 94 | 178816 | 452.92 | 1398 | 1339 | 391.9 |
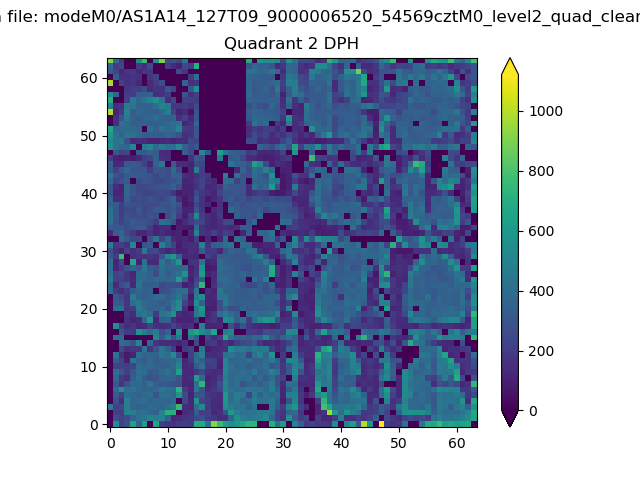
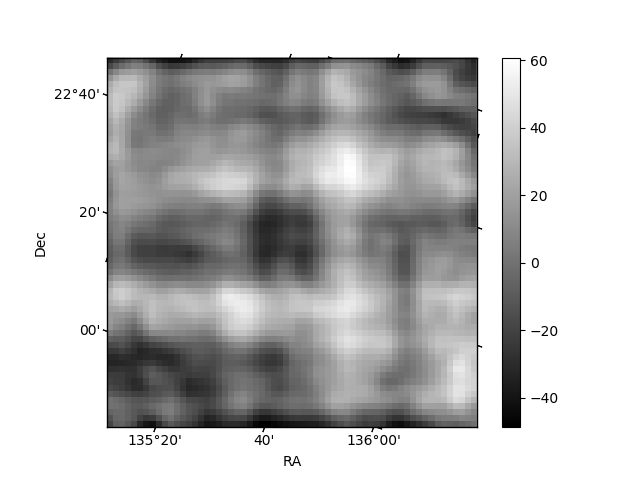
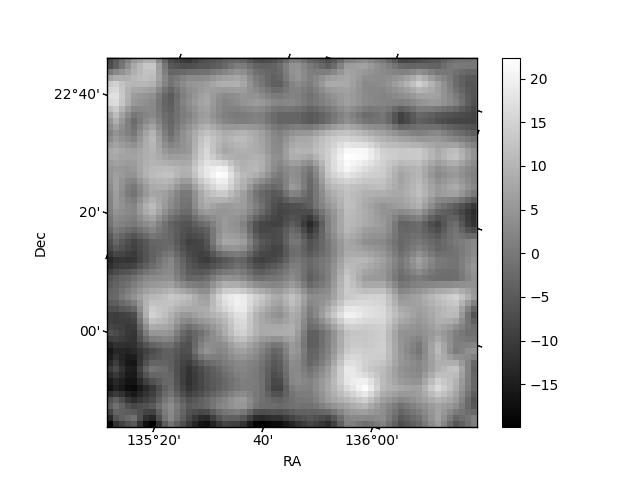
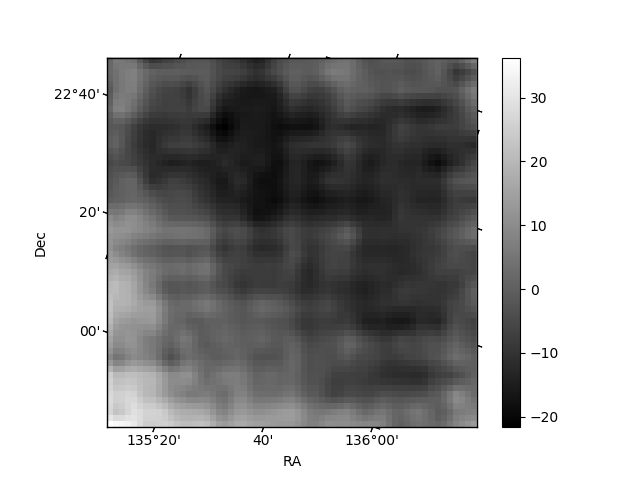
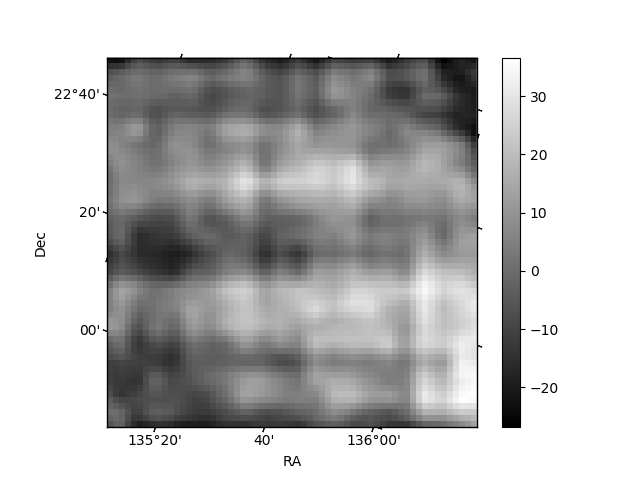
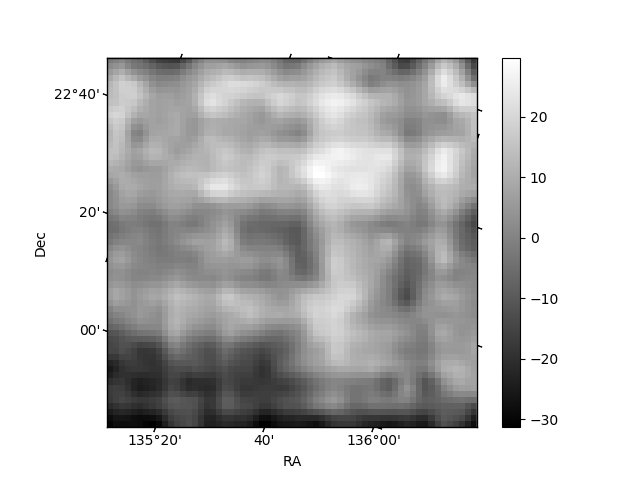
Histogram calculated using DETX and DETY for each event in the final _common_clean file
| Quadrant A | 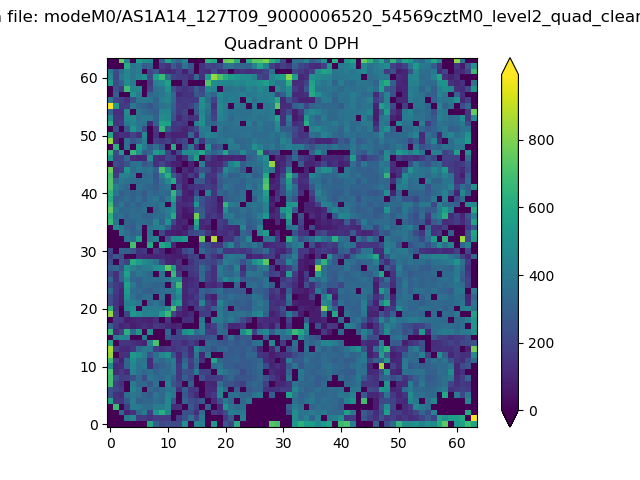 |
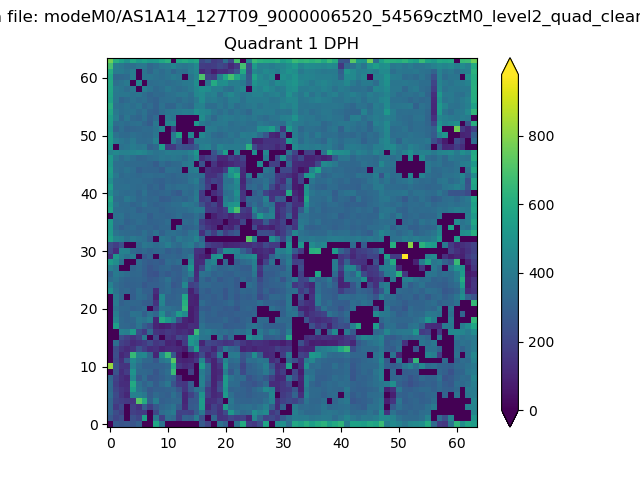 |
Quadrant B |
|---|---|---|---|
| Quadrant D | 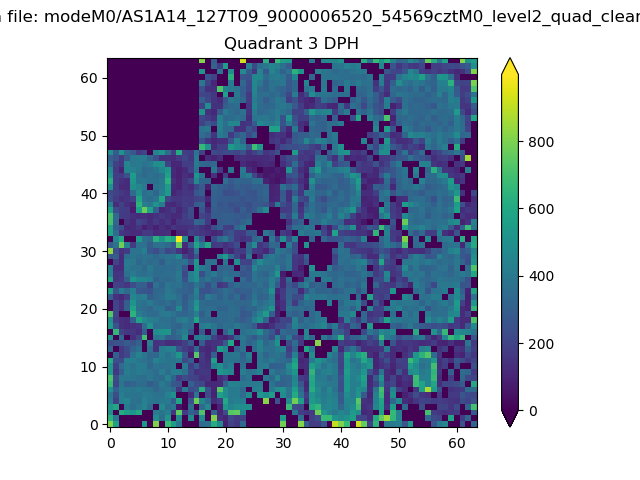 |
 |
Quadrant C |
| Plot type | Count rate plots | Images |
|---|---|---|
| Comparison with Poisson distribution Blue bars denote a histogram of data divided into 1 sec bins. Red curve is a Poisson curve with rate = median count rate of data. |
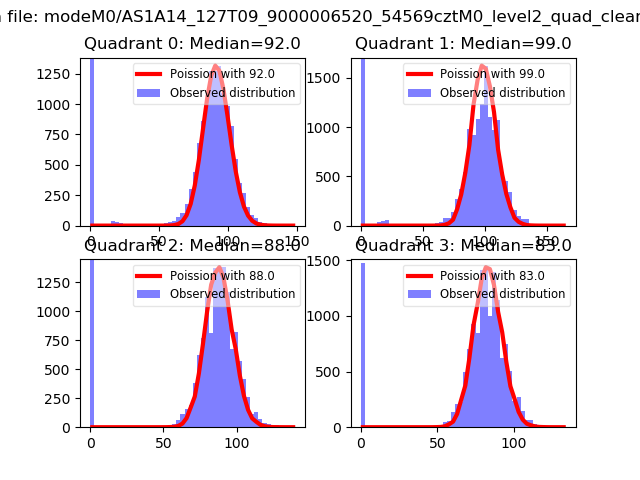 |
 |
| Quadrant-wise count rates Data is divided into 100 sec bins |
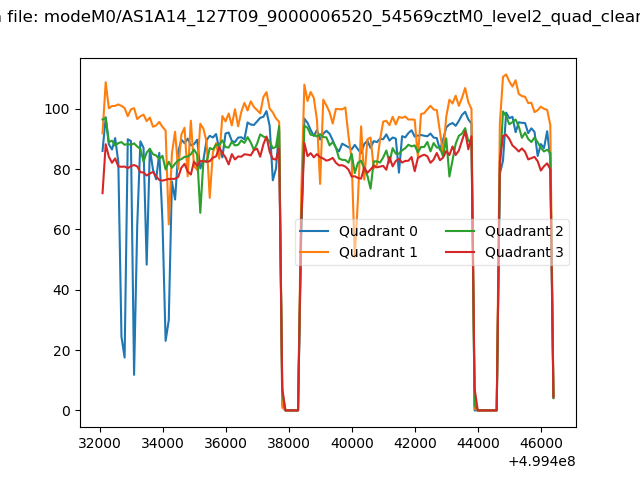 |
|
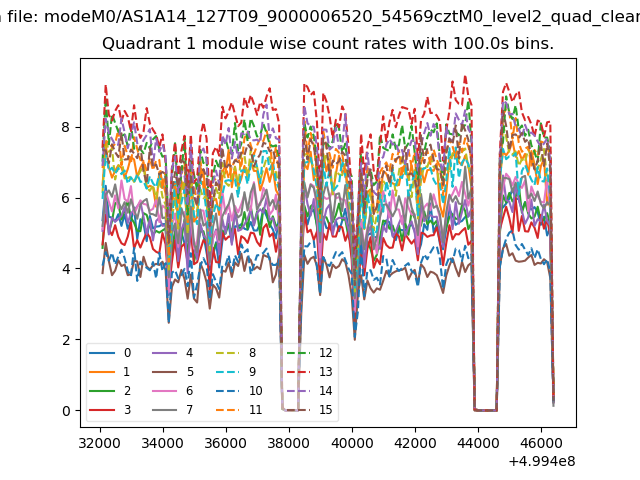
| Module-wise count rates for Quadrant A Data is divided into 100 sec bins |
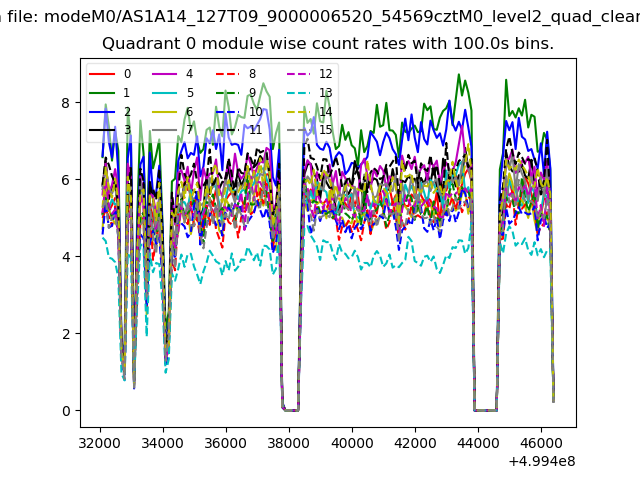 |
 |
| Module-wise count rates for Quadrant B Data is divided into 100 sec bins |
 |
 |
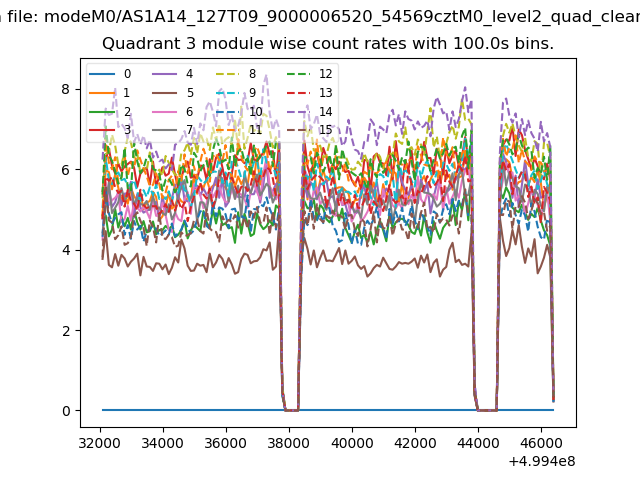
| Module-wise count rates for Quadrant C Data is divided into 100 sec bins |
 |
 |
| Module-wise count rates for Quadrant D Data is divided into 100 sec bins |
 |
 |
| Parameter | Plot |
|---|---|
| CZT HV Monitor | 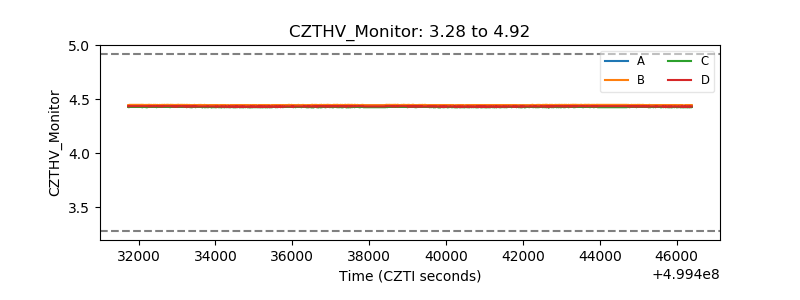 |
| D_VDD | 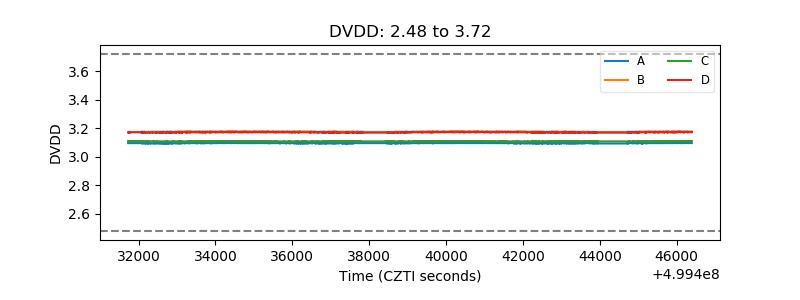 |
| Temperature 1 | 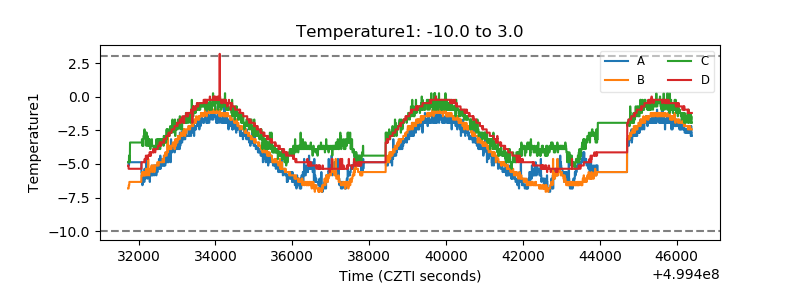 |
| Veto HV Monitor | 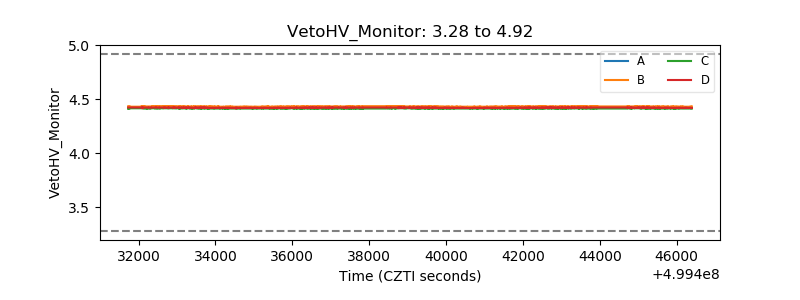 |
| Veto LLD | 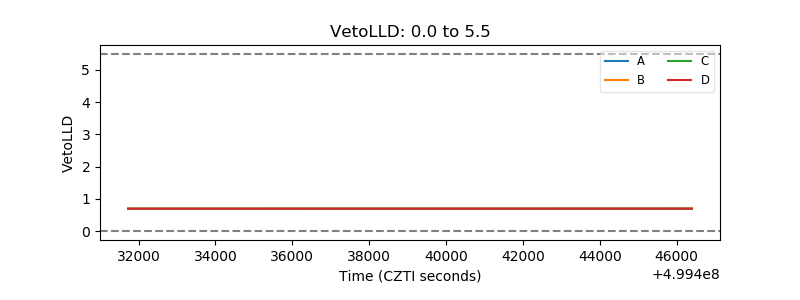 |
| Alpha Counter | 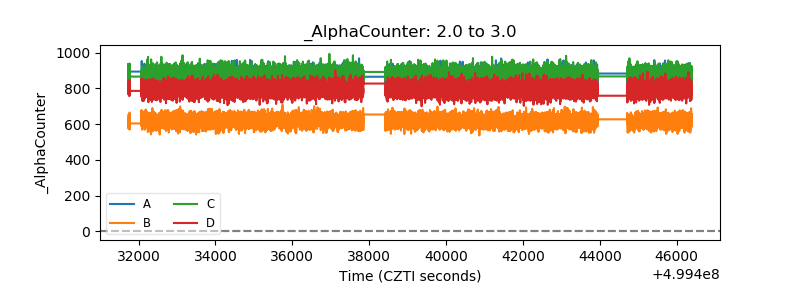 |
| _CPM_Rate | 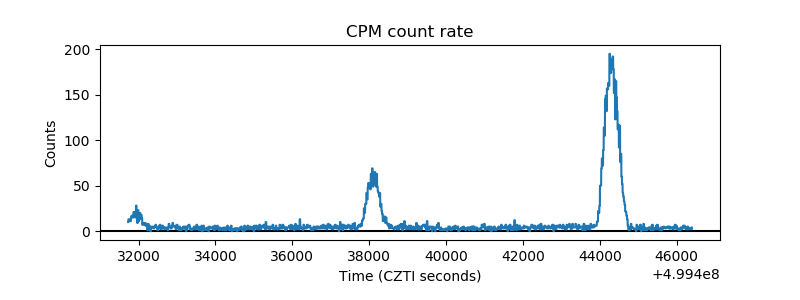 |
| CZT Counter | 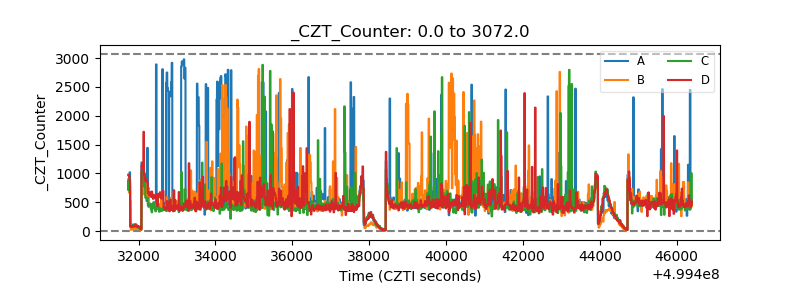 |
| +2.5 Volts monitor | 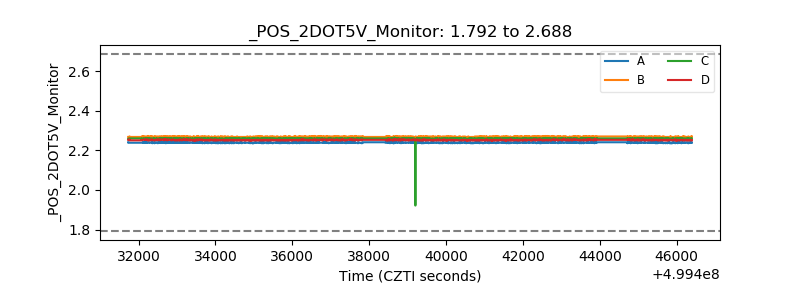 |
| +5 Volts monitor | 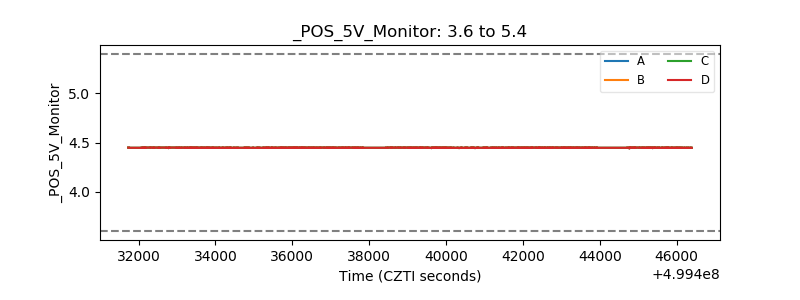 |
| _ROLL_ROT | 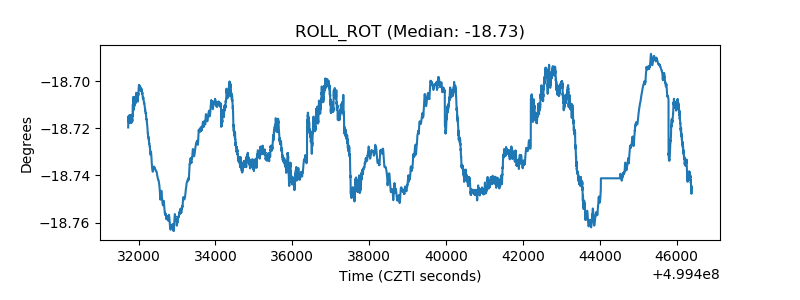 |
| _Roll_DEC | 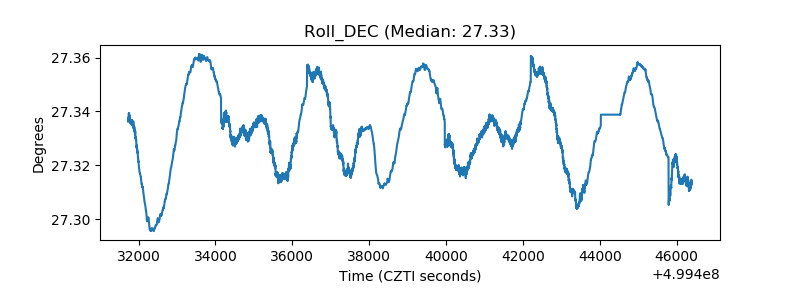 |
| _Roll_RA | 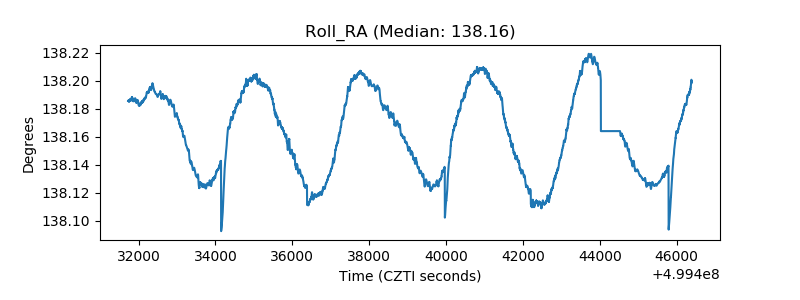 |
| Veto Counter | 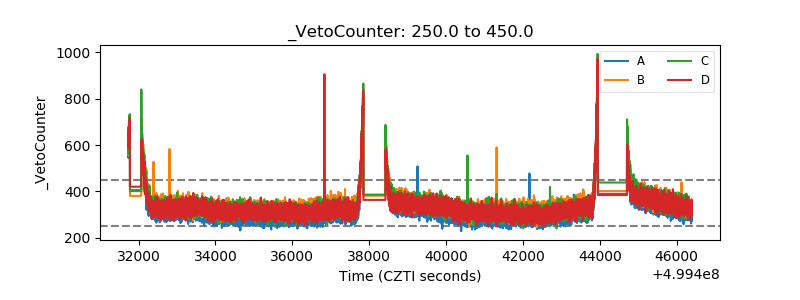 |