| Param | Original file | Final file |
|---|---|---|
| Filename | modeM0/AS1A14_127T09_9000006520_54573cztM0_level2.fits | modeM0/AS1A14_127T09_9000006520_54573cztM0_level2_quad_clean.evt |
| Size (bytes) | 457,914,240 | 92,465,280 |
| Size | 436.7 MB | 88.2 MB |
| Events in quadrant A | 4,081,761 | 595,599 |
| Events in quadrant B | 4,164,780 | 652,294 |
| Events in quadrant C | 3,288,112 | 591,928 |
| Events in quadrant D | 4,931,882 | 525,069 |
| Mode M0 | |||
|---|---|---|---|
| Quadrant | BADHDUFLAG | Total packets | Discarded packets |
| A | 0 | 16289 | 1 |
| B | 0 | 16833 | 1 |
| C | 0 | 14200 | 1 |
| D | 0 | 18995 | 1 |
| Mode SS | |||
|---|---|---|---|
| Quadrant | BADHDUFLAG | Total packets | Discarded packets |
| A | 0 | 128 | 0 |
| B | 0 | 128 | 0 |
| C | 0 | 128 | 0 |
| D | 0 | 128 | 0 |
| Mode M9 | |||
|---|---|---|---|
| Quadrant | BADHDUFLAG | Total packets | Discarded packets |
| A | 0 | 11 | 0 |
| B | 0 | 11 | 0 |
| C | 0 | 11 | 0 |
| D | 0 | 11 | 0 |
| Quadrant | Total seconds | Saturated seconds | Saturation percentage |
|---|---|---|---|
| A | 6224 | 423 | 6.796272% |
| B | 6224 | 306 | 4.916452% |
| C | 6224 | 126 | 2.024422% |
| D | 6224 | 559 | 8.981362% |
Noise dominated data is calculated using 1-second bins in cleaned event files. If a bin has >2000 counts, and if more than 50% of those come from <1% of pixels, then it is considered to be noise-dominated and hence unusable.
| Quadrant | # 1 sec bins | Bins with >0 counts | Bins with >2000 counts | High rate bins dominated by noise | Noise dominated (total time) | Noise dominated (detector-on time) | Marked lightcurve |
|---|---|---|---|---|---|---|---|
| A | 7364 | 6225 | 289 | 289 | 3.92% | 4.64% | 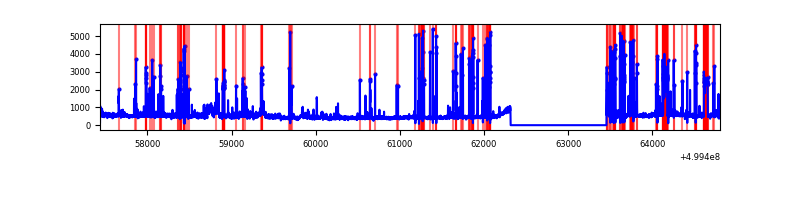 |
| B | 7364 | 6225 | 138 | 138 | 1.87% | 2.22% | 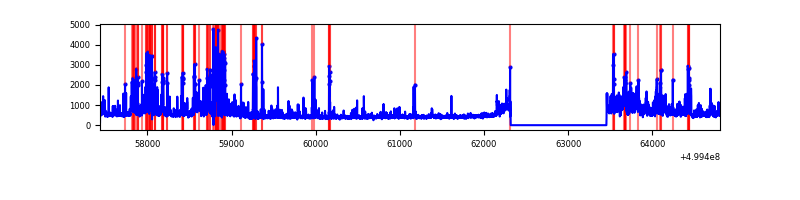 |
| C | 7364 | 6225 | 68 | 68 | 0.92% | 1.09% | 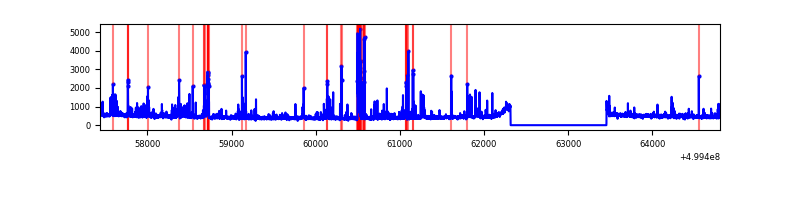 |
| D | 7364 | 6225 | 431 | 431 | 5.85% | 6.92% | 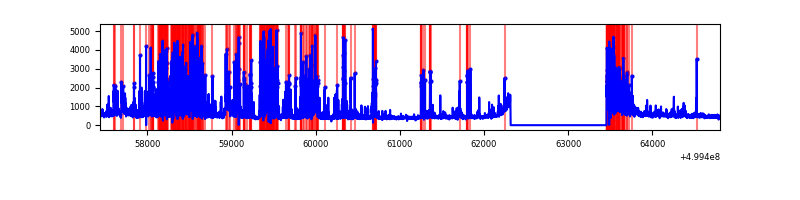 |
Top three noisy pixels from each quadrant. If the there are fewer than three noisy pixels in the level2.evt file, extra rows are filled as -1
| Pixel properties | Quadrant properties | ||||||
|---|---|---|---|---|---|---|---|
| Quadrant | DetID | PixID | Counts | Sigma | Mean | Median | Sigma |
| A | 11 | 3 | 948804 | 5615.86 | 681 | 666 | 168.8 |
| A | 14 | 235 | 197404 | 1165.29 | 681 | 666 | 168.8 |
| A | 3 | 14 | 114154 | 672.19 | 681 | 666 | 168.8 |
| B | 0 | 213 | 343116 | 2347.48 | 685 | 662 | 145.9 |
| B | 2 | 249 | 224245 | 1532.63 | 685 | 662 | 145.9 |
| B | 1 | 207 | 214442 | 1465.43 | 685 | 662 | 145.9 |
| C | 14 | 254 | 209882 | 1114.71 | 684 | 677 | 187.7 |
| C | 13 | 3 | 100724 | 533.08 | 684 | 677 | 187.7 |
| C | 6 | 223 | 100213 | 530.36 | 684 | 677 | 187.7 |
| D | 15 | 94 | 1888895 | 10203.03 | 656 | 628 | 185.1 |
| D | 7 | 70 | 116704 | 627.2 | 656 | 628 | 185.1 |
| D | 10 | 199 | 99572 | 534.63 | 656 | 628 | 185.1 |
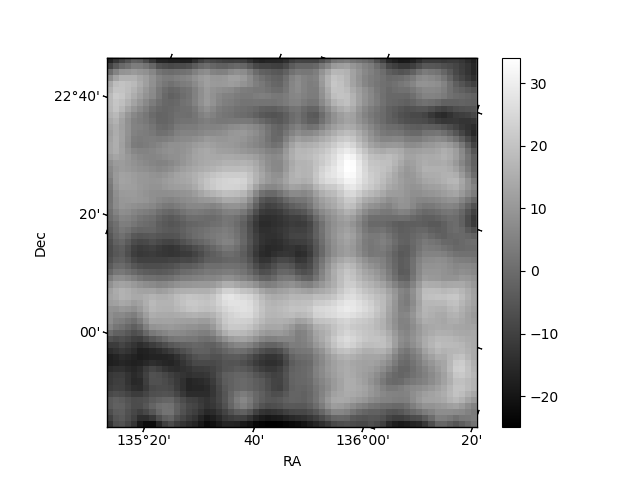
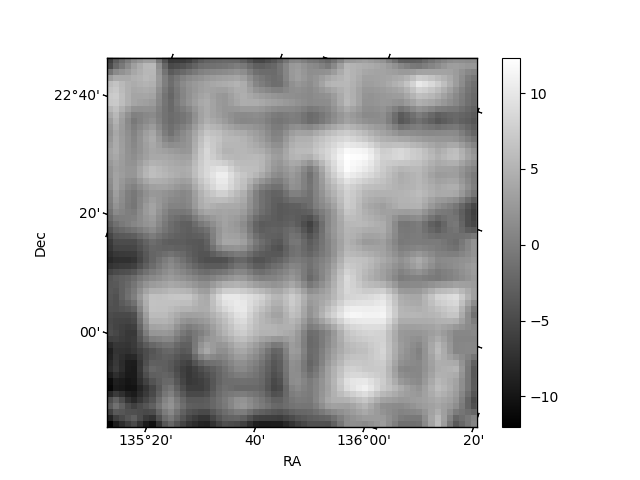
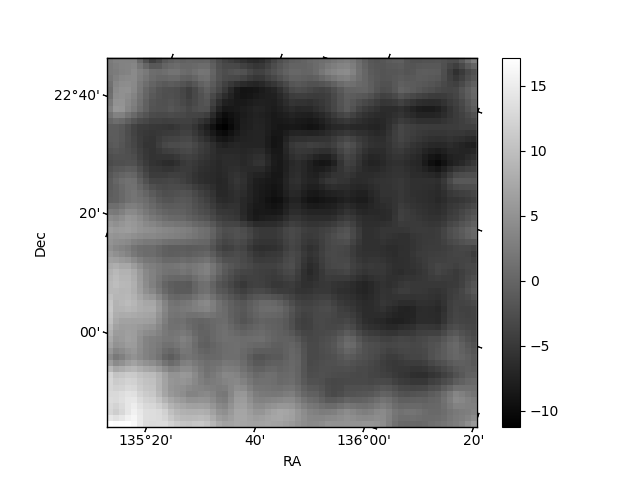
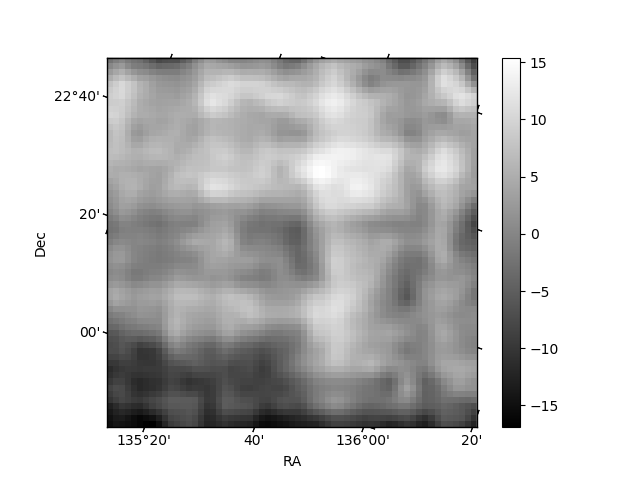
Histogram calculated using DETX and DETY for each event in the final _common_clean file
| Quadrant A | 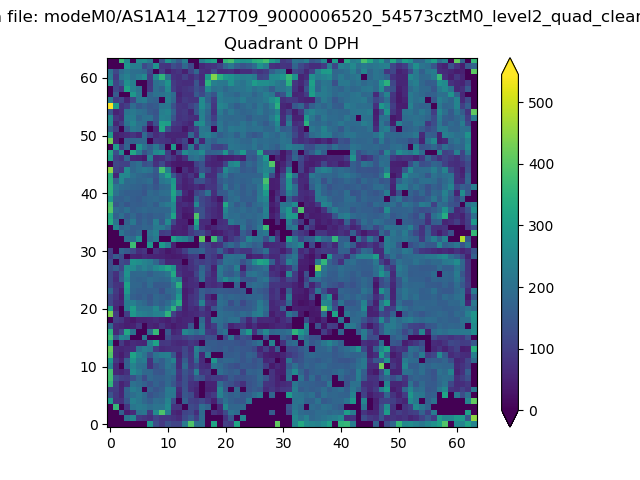 |
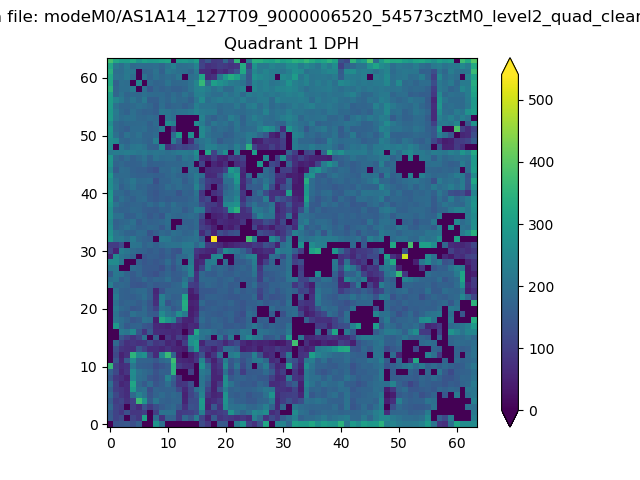 |
Quadrant B |
|---|---|---|---|
| Quadrant D | 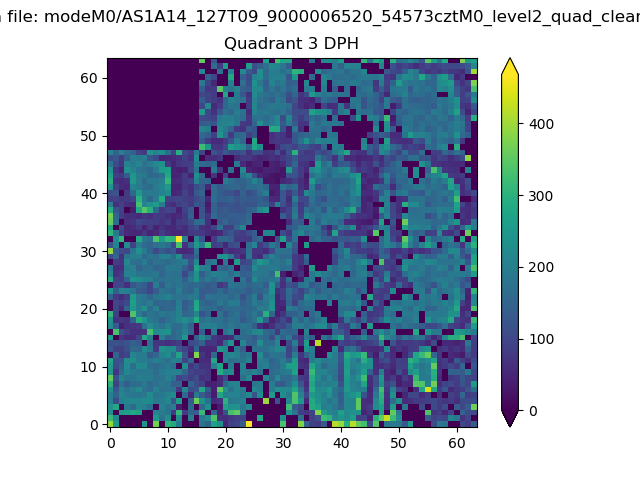 |
 |
Quadrant C |
| Plot type | Count rate plots | Images |
|---|---|---|
| Comparison with Poisson distribution Blue bars denote a histogram of data divided into 1 sec bins. Red curve is a Poisson curve with rate = median count rate of data. |
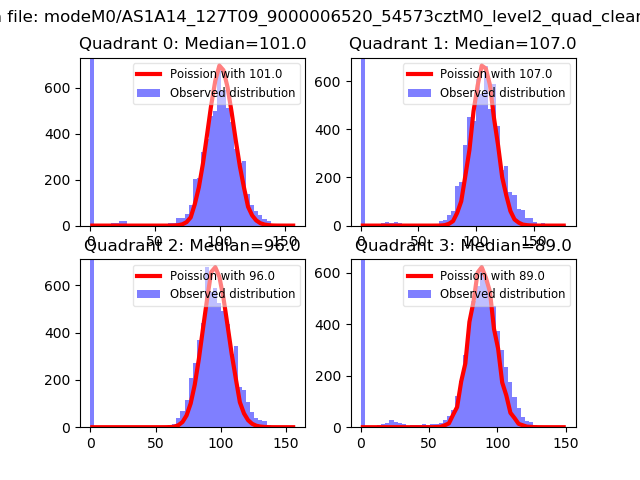 |
 |
| Quadrant-wise count rates Data is divided into 100 sec bins |
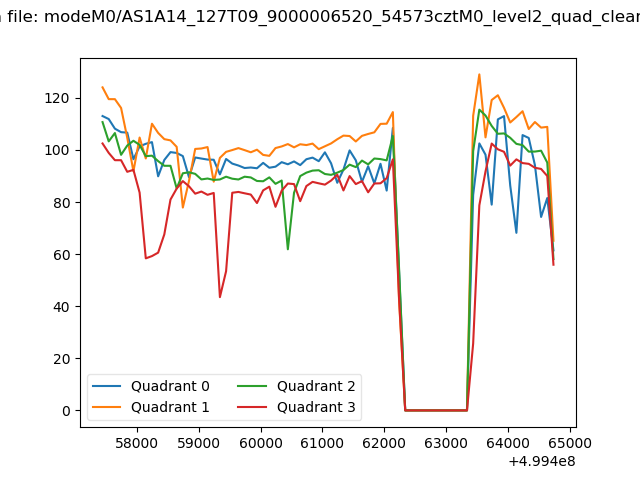 |
|
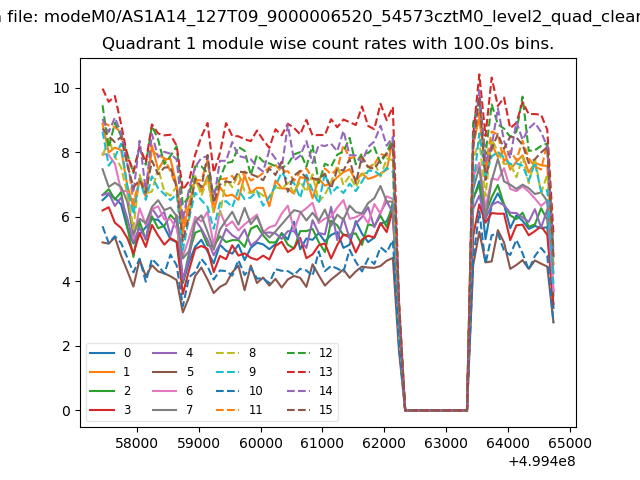
| Module-wise count rates for Quadrant A Data is divided into 100 sec bins |
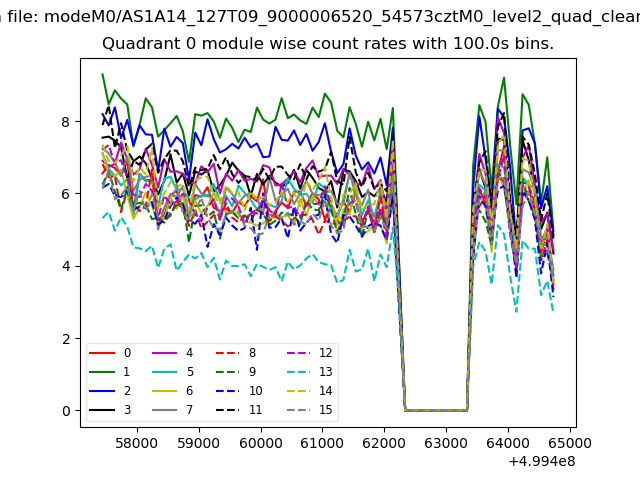 |
 |
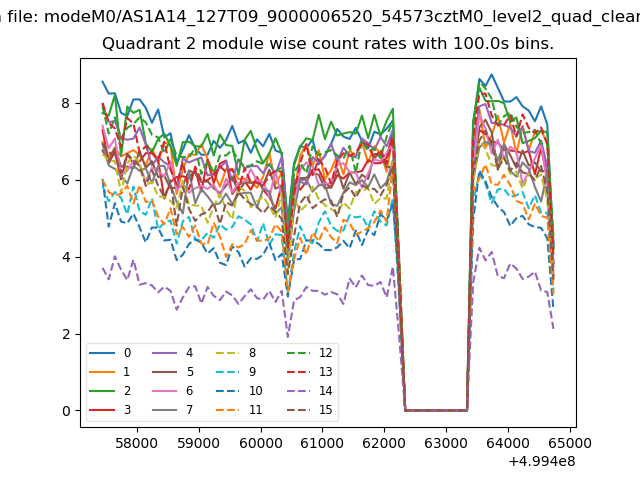
| Module-wise count rates for Quadrant B Data is divided into 100 sec bins |
 |
 |
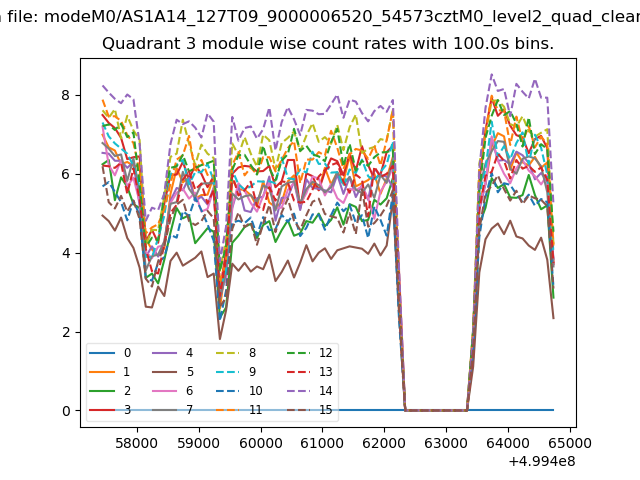
| Module-wise count rates for Quadrant C Data is divided into 100 sec bins |
 |
 |
| Module-wise count rates for Quadrant D Data is divided into 100 sec bins |
 |
 |
| Parameter | Plot |
|---|---|
| CZT HV Monitor | 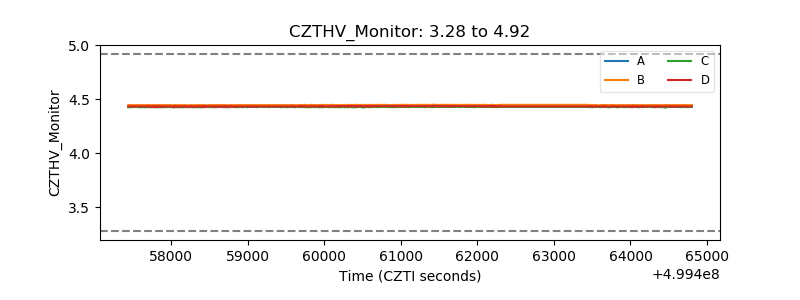 |
| D_VDD | 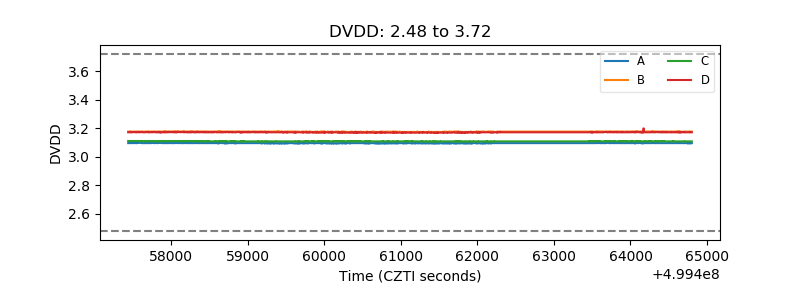 |
| Temperature 1 | 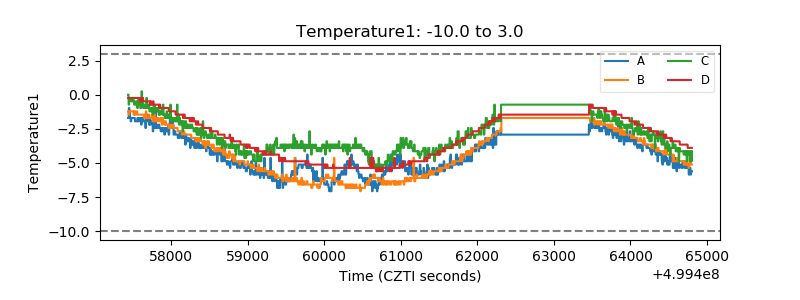 |
| Veto HV Monitor | 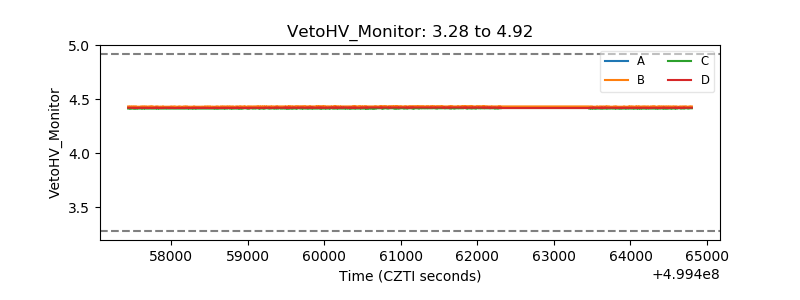 |
| Veto LLD | 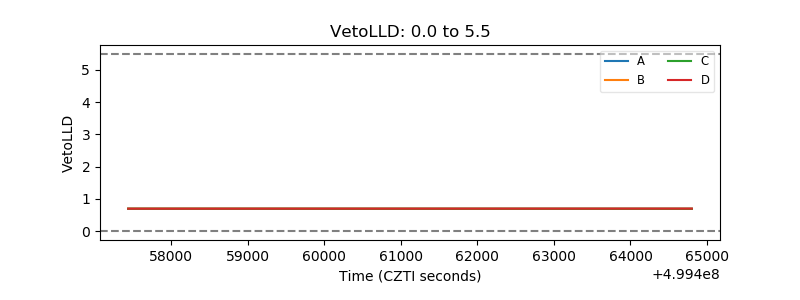 |
| Alpha Counter | 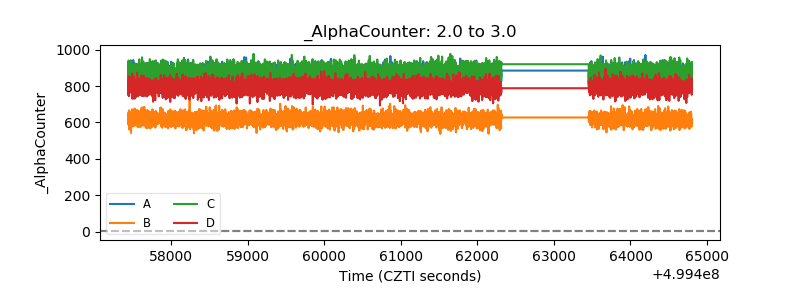 |
| _CPM_Rate | 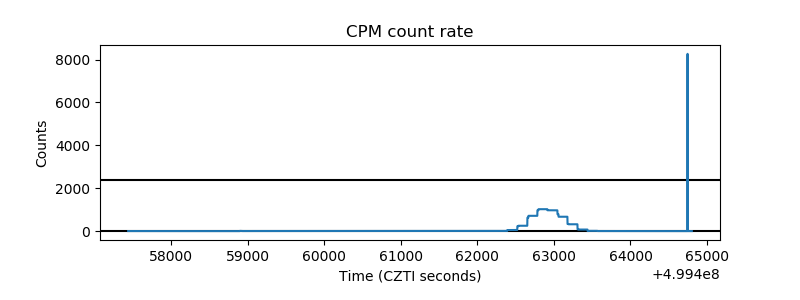 |
| CZT Counter | 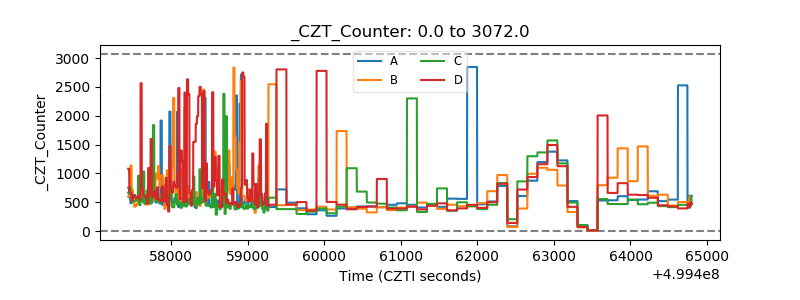 |
| +2.5 Volts monitor |  |
| +5 Volts monitor |  |
| _ROLL_ROT | 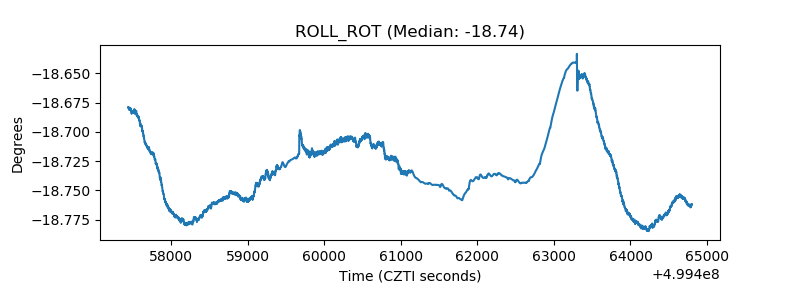 |
| _Roll_DEC | 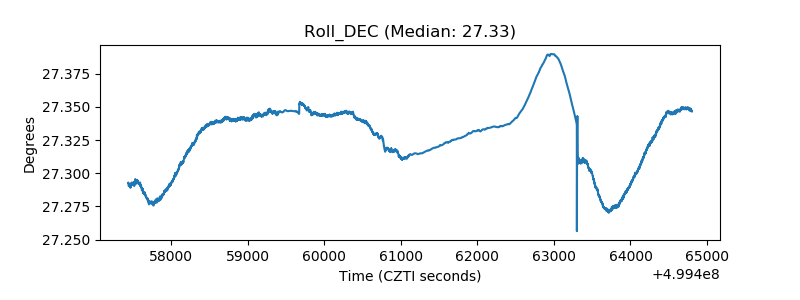 |
| _Roll_RA | 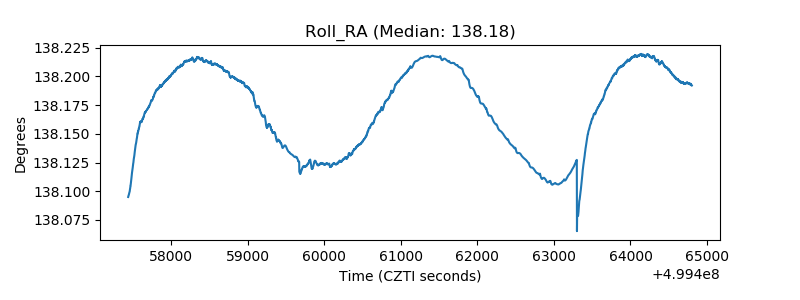 |
| Veto Counter | 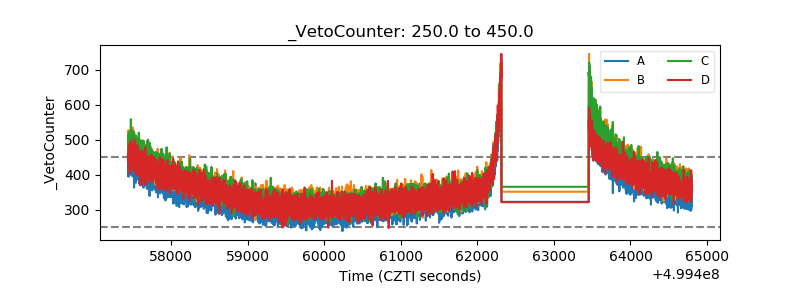 |