| Param | Original file | Final file |
|---|---|---|
| Filename | modeM0/AS1A14_127T09_9000006520_54575cztM0_level2.fits | modeM0/AS1A14_127T09_9000006520_54575cztM0_level2_quad_clean.evt |
| Size (bytes) | 500,469,120 | 94,832,640 |
| Size | 477.3 MB | 90.4 MB |
| Events in quadrant A | 4,102,758 | 634,081 |
| Events in quadrant B | 4,113,169 | 667,984 |
| Events in quadrant C | 3,595,443 | 605,293 |
| Events in quadrant D | 6,213,988 | 514,511 |
| Mode M0 | |||
|---|---|---|---|
| Quadrant | BADHDUFLAG | Total packets | Discarded packets |
| A | 0 | 16591 | 2 |
| B | 0 | 16818 | 2 |
| C | 0 | 15372 | 2 |
| D | 0 | 23036 | 3 |
| Mode SS | |||
|---|---|---|---|
| Quadrant | BADHDUFLAG | Total packets | Discarded packets |
| A | 0 | 132 | 0 |
| B | 0 | 132 | 0 |
| C | 0 | 132 | 0 |
| D | 0 | 132 | 0 |
| Mode M9 | |||
|---|---|---|---|
| Quadrant | BADHDUFLAG | Total packets | Discarded packets |
| A | 0 | 16 | 0 |
| B | 0 | 17 | 0 |
| C | 0 | 17 | 0 |
| D | 0 | 17 | 0 |
| Quadrant | Total seconds | Saturated seconds | Saturation percentage |
|---|---|---|---|
| A | 6442 | 234 | 3.632412% |
| B | 6442 | 369 | 5.728035% |
| C | 6442 | 167 | 2.592363% |
| D | 6441 | 844 | 13.103555% |
Noise dominated data is calculated using 1-second bins in cleaned event files. If a bin has >2000 counts, and if more than 50% of those come from <1% of pixels, then it is considered to be noise-dominated and hence unusable.
| Quadrant | # 1 sec bins | Bins with >0 counts | Bins with >2000 counts | High rate bins dominated by noise | Noise dominated (total time) | Noise dominated (detector-on time) | Marked lightcurve |
|---|---|---|---|---|---|---|---|
| A | 7587 | 6442 | 147 | 147 | 1.94% | 2.28% | 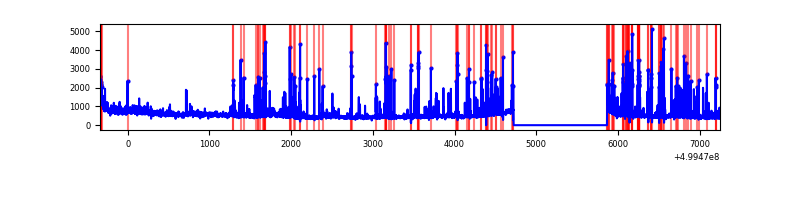 |
| B | 7587 | 6442 | 156 | 156 | 2.06% | 2.42% | 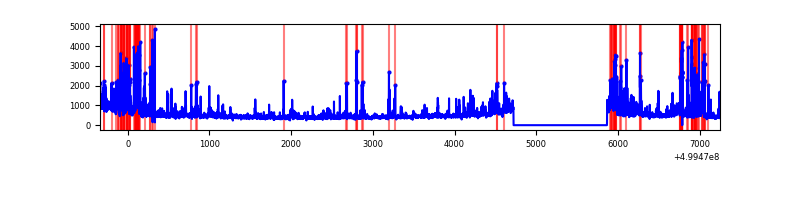 |
| C | 7587 | 6443 | 119 | 119 | 1.57% | 1.85% | 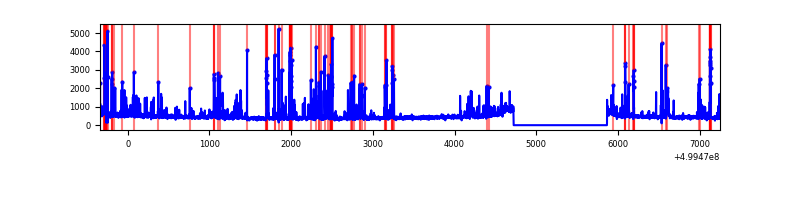 |
| D | 7586 | 6442 | 717 | 717 | 9.45% | 11.13% | 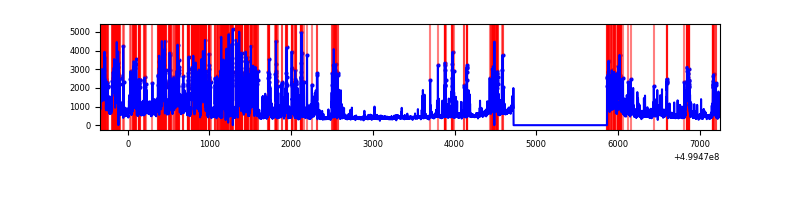 |
Top three noisy pixels from each quadrant. If the there are fewer than three noisy pixels in the level2.evt file, extra rows are filled as -1
| Pixel properties | Quadrant properties | ||||||
|---|---|---|---|---|---|---|---|
| Quadrant | DetID | PixID | Counts | Sigma | Mean | Median | Sigma |
| A | 11 | 3 | 640290 | 3602.32 | 709 | 690 | 177.6 |
| A | 3 | 14 | 507438 | 2854.08 | 709 | 690 | 177.6 |
| A | 14 | 235 | 77342 | 431.72 | 709 | 690 | 177.6 |
| B | 8 | 234 | 407543 | 2700.4 | 701 | 675 | 150.7 |
| B | 0 | 173 | 276812 | 1832.73 | 701 | 675 | 150.7 |
| B | 0 | 213 | 133069 | 878.7 | 701 | 675 | 150.7 |
| C | 13 | 3 | 641339 | 3330.01 | 694 | 688 | 192.4 |
| C | 4 | 5 | 73736 | 379.69 | 694 | 688 | 192.4 |
| C | 14 | 254 | 49526 | 253.85 | 694 | 688 | 192.4 |
| D | 15 | 94 | 2326942 | 12387.27 | 659 | 628 | 187.8 |
| D | 3 | 12 | 859652 | 4574.17 | 659 | 628 | 187.8 |
| D | 8 | 160 | 118790 | 629.19 | 659 | 628 | 187.8 |
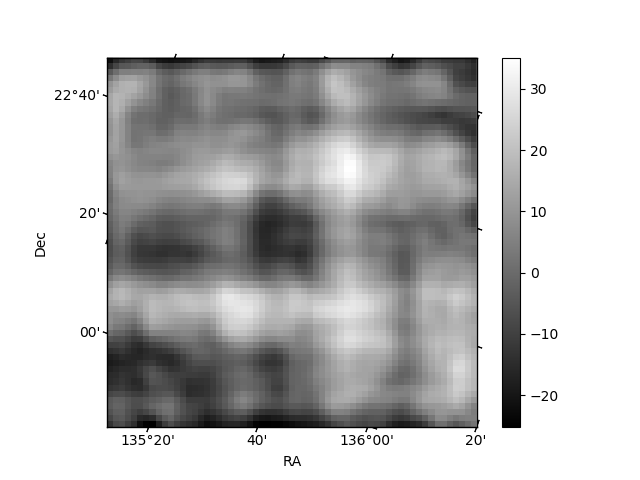
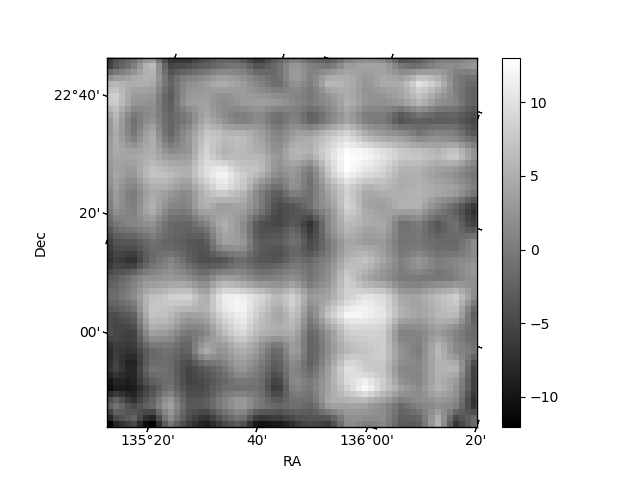
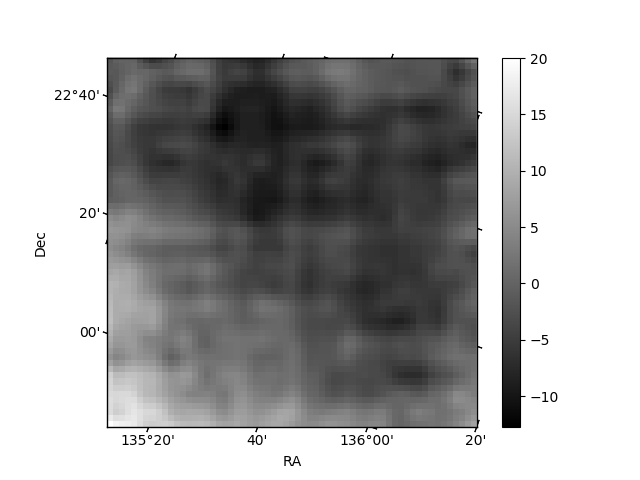
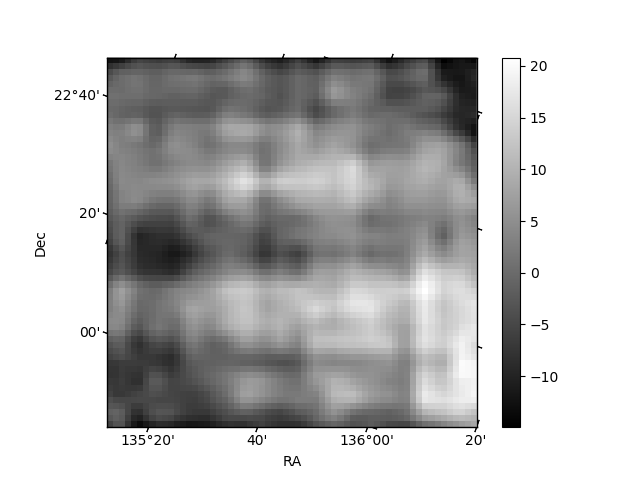
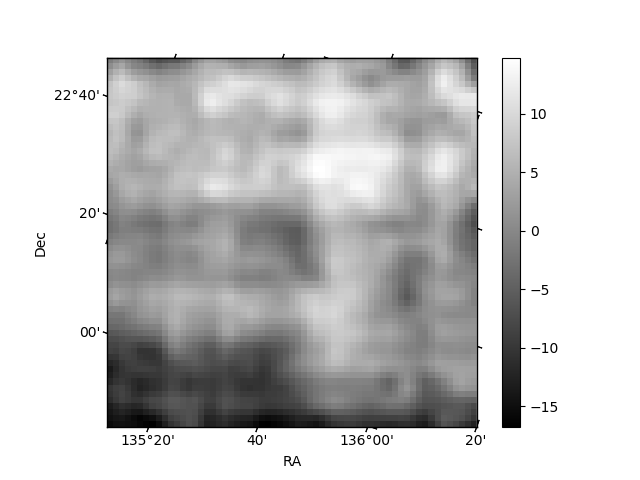
Histogram calculated using DETX and DETY for each event in the final _common_clean file
| Quadrant A | 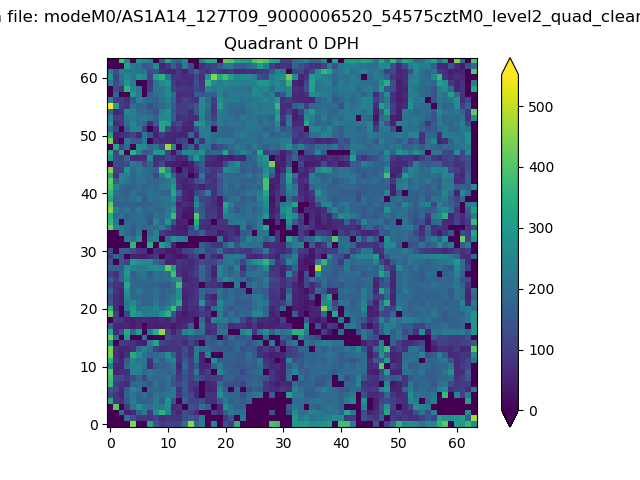 |
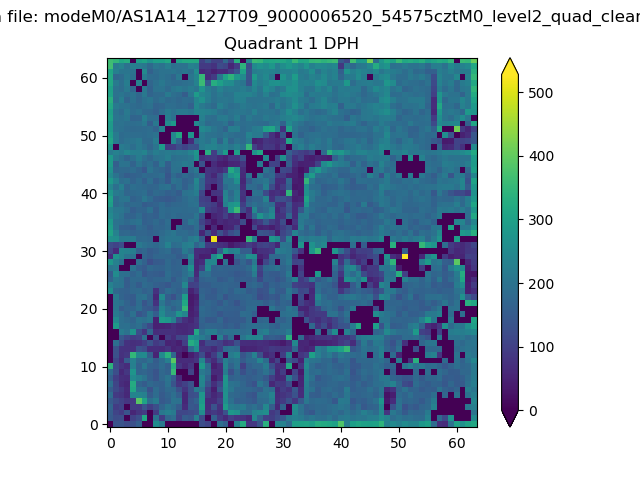 |
Quadrant B |
|---|---|---|---|
| Quadrant D | 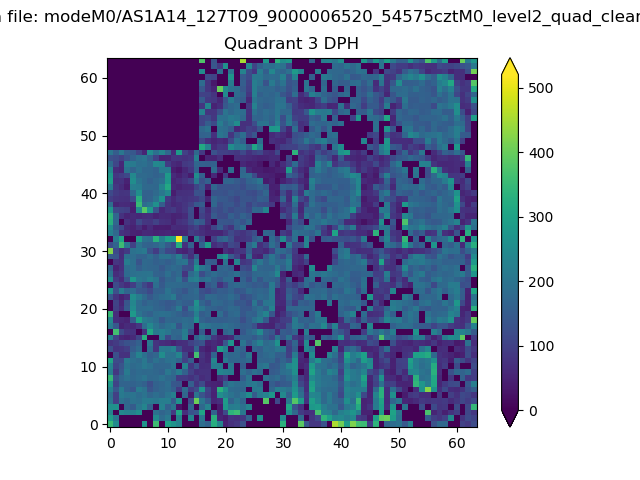 |
 |
Quadrant C |
| Plot type | Count rate plots | Images |
|---|---|---|
| Comparison with Poisson distribution Blue bars denote a histogram of data divided into 1 sec bins. Red curve is a Poisson curve with rate = median count rate of data. |
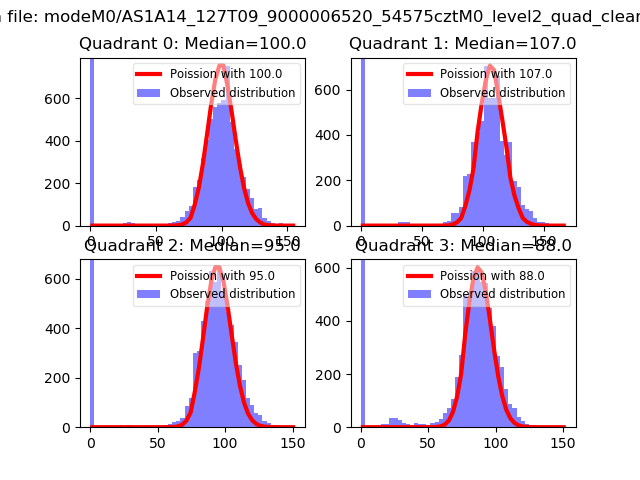 |
 |
| Quadrant-wise count rates Data is divided into 100 sec bins |
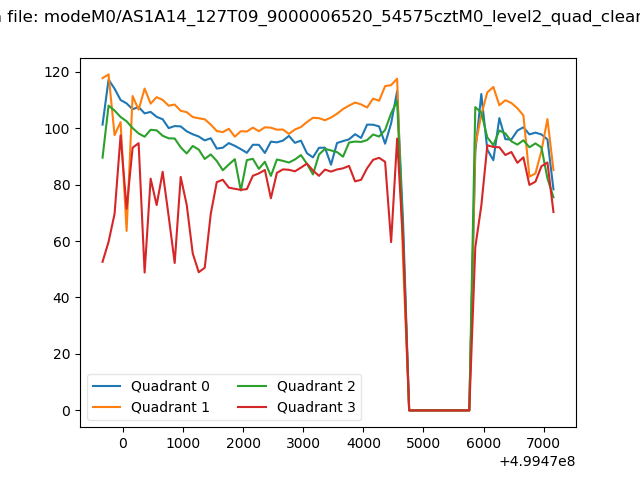 |
|
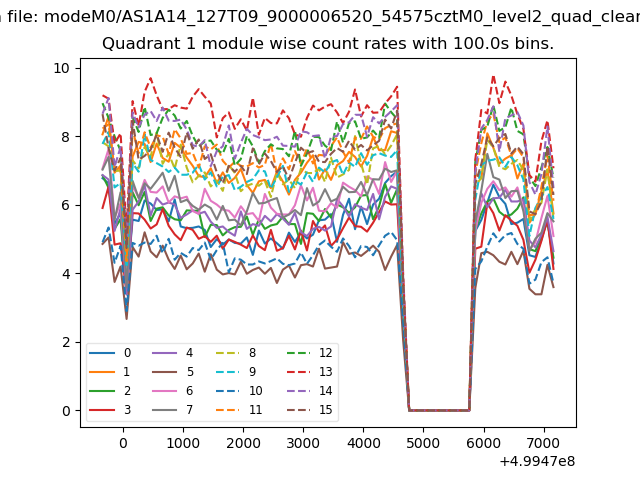
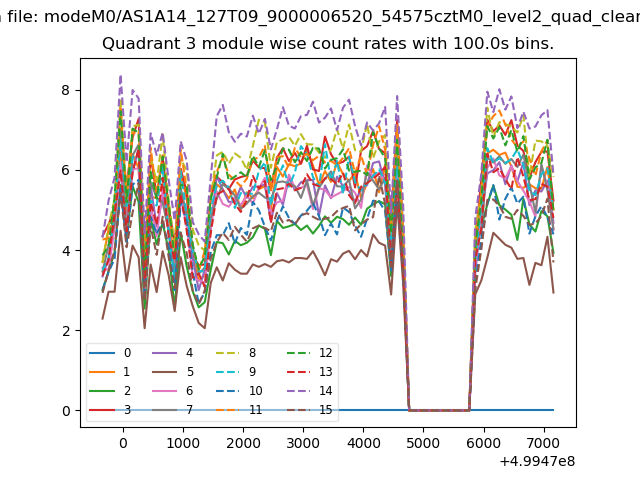
| Module-wise count rates for Quadrant A Data is divided into 100 sec bins |
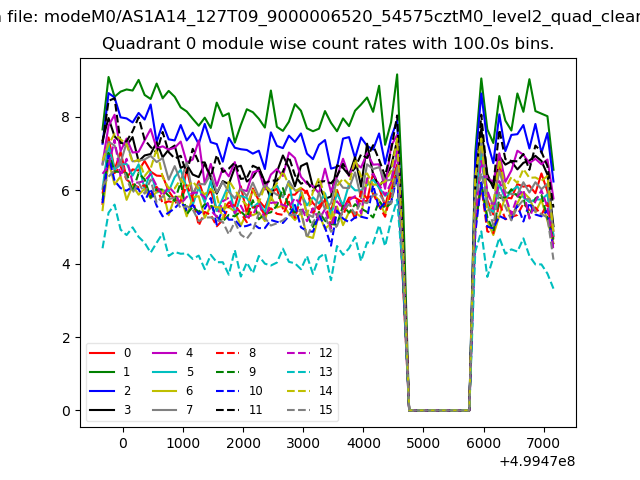 |
 |
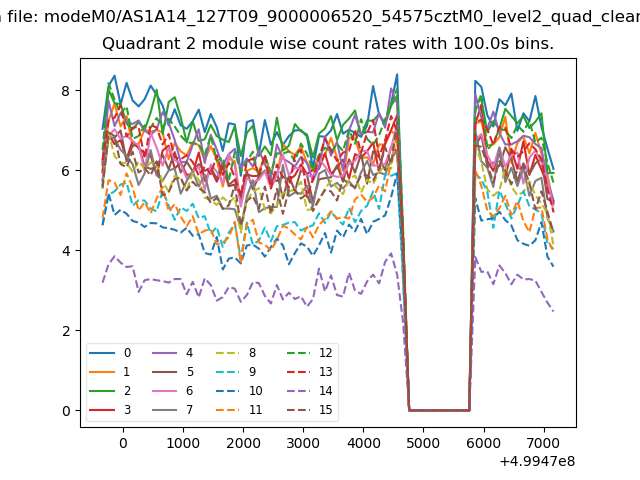
| Module-wise count rates for Quadrant B Data is divided into 100 sec bins |
 |
 |
| Module-wise count rates for Quadrant C Data is divided into 100 sec bins |
 |
 |
| Module-wise count rates for Quadrant D Data is divided into 100 sec bins |
 |
 |
| Parameter | Plot |
|---|---|
| CZT HV Monitor | 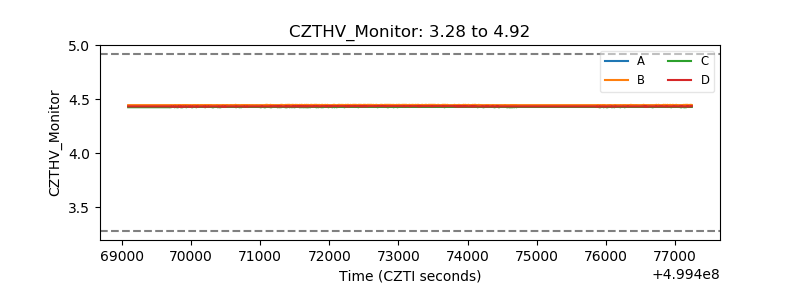 |
| D_VDD | 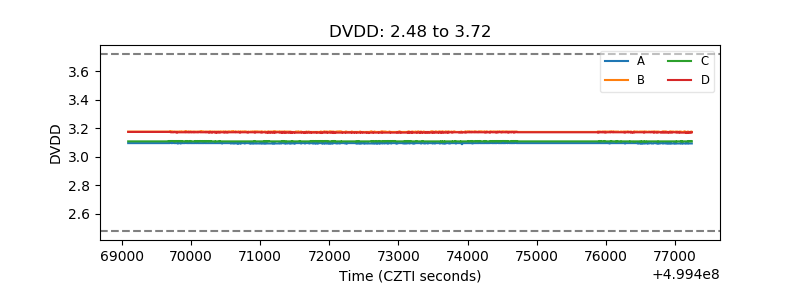 |
| Temperature 1 | 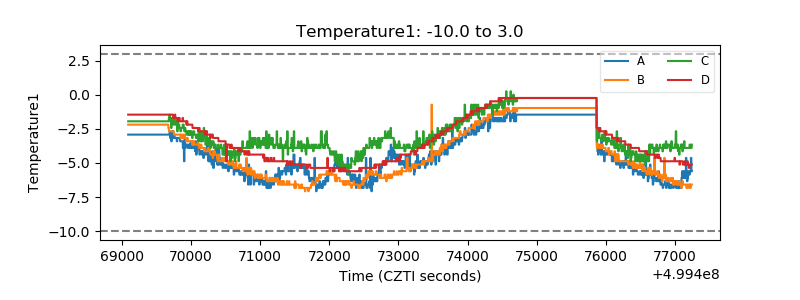 |
| Veto HV Monitor | 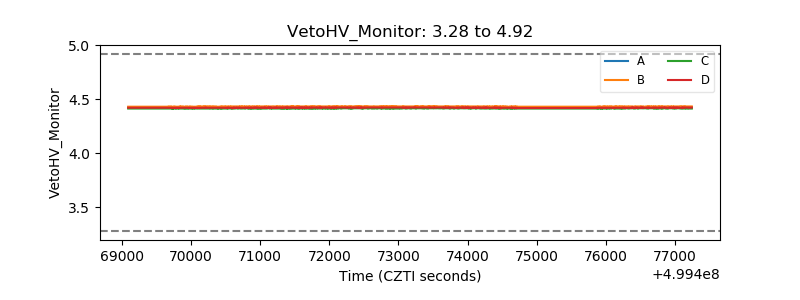 |
| Veto LLD | 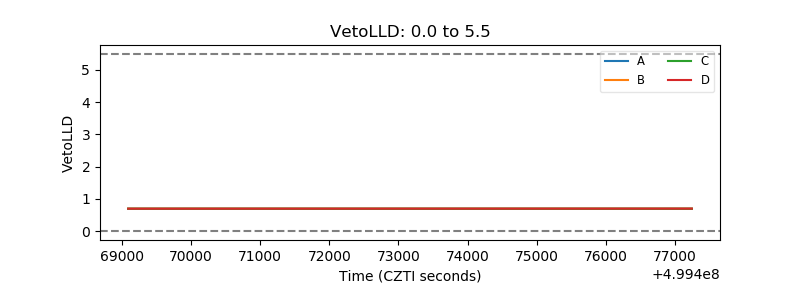 |
| Alpha Counter | 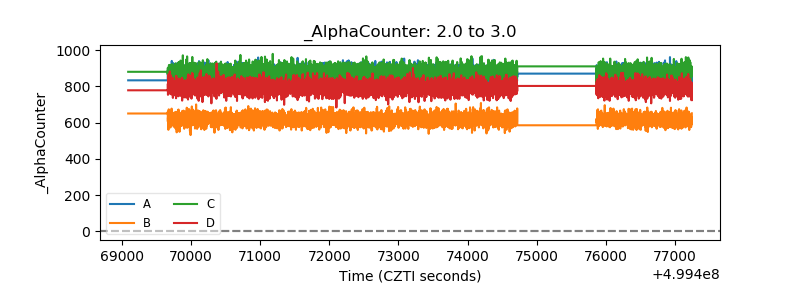 |
| _CPM_Rate | 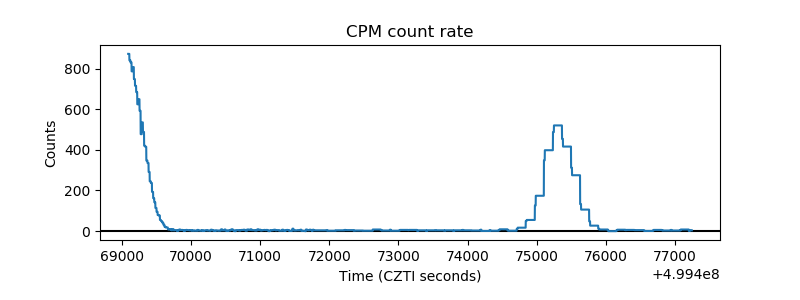 |
| CZT Counter | 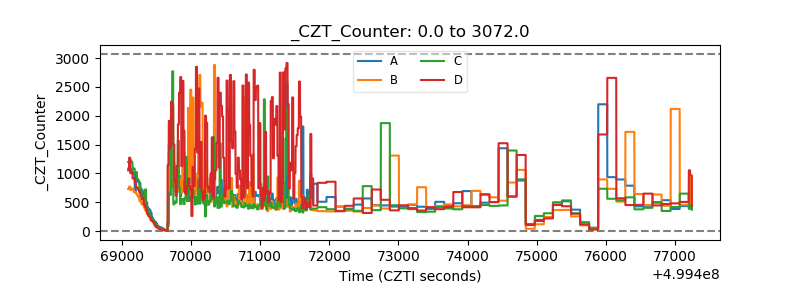 |
| +2.5 Volts monitor |  |
| +5 Volts monitor |  |
| _ROLL_ROT | 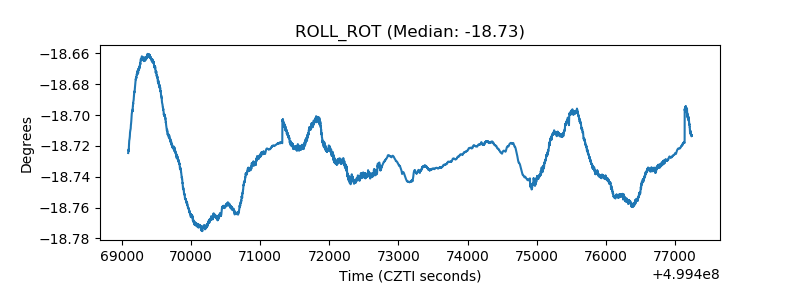 |
| _Roll_DEC | 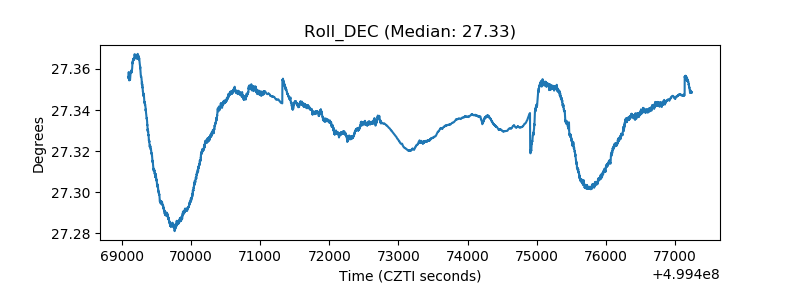 |
| _Roll_RA | 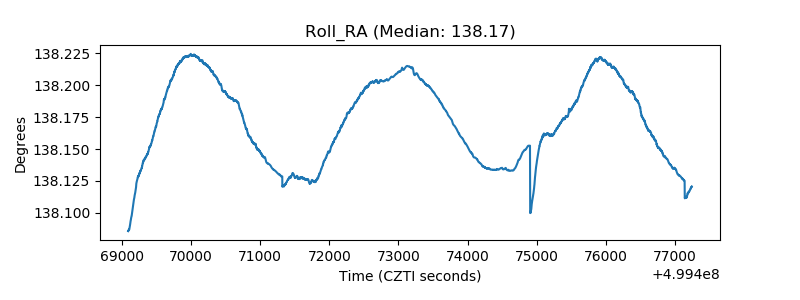 |
| Veto Counter | 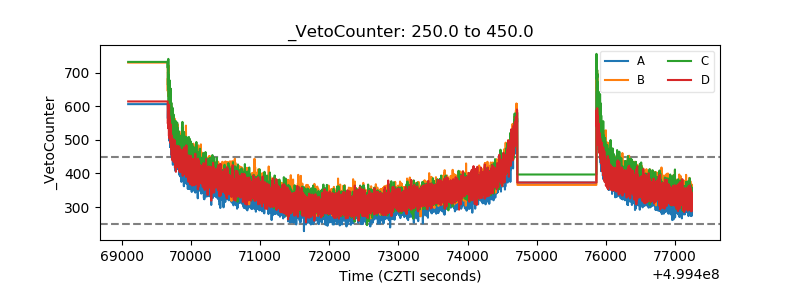 |