| Param | Original file | Final file |
|---|---|---|
| Filename | modeM0/AS1A14_127T09_9000006520_54576cztM0_level2.fits | modeM0/AS1A14_127T09_9000006520_54576cztM0_level2_quad_clean.evt |
| Size (bytes) | 453,317,760 | 97,899,840 |
| Size | 432.3 MB | 93.4 MB |
| Events in quadrant A | 4,051,378 | 636,665 |
| Events in quadrant B | 4,341,712 | 676,784 |
| Events in quadrant C | 3,676,899 | 614,236 |
| Events in quadrant D | 4,188,722 | 569,080 |
| Mode M0 | |||
|---|---|---|---|
| Quadrant | BADHDUFLAG | Total packets | Discarded packets |
| A | 0 | 16849 | 2 |
| B | 0 | 17881 | 2 |
| C | 0 | 16009 | 2 |
| D | 0 | 17303 | 2 |
| Mode SS | |||
|---|---|---|---|
| Quadrant | BADHDUFLAG | Total packets | Discarded packets |
| A | 0 | 136 | 0 |
| B | 0 | 136 | 0 |
| C | 0 | 136 | 0 |
| D | 0 | 136 | 0 |
| Mode M9 | |||
|---|---|---|---|
| Quadrant | BADHDUFLAG | Total packets | Discarded packets |
| A | 0 | 15 | 0 |
| B | 0 | 15 | 0 |
| C | 0 | 16 | 0 |
| D | 0 | 16 | 0 |
| Quadrant | Total seconds | Saturated seconds | Saturation percentage |
|---|---|---|---|
| A | 6708 | 329 | 4.904592% |
| B | 6708 | 345 | 5.143113% |
| C | 6708 | 171 | 2.549195% |
| D | 6707 | 231 | 3.444163% |
Noise dominated data is calculated using 1-second bins in cleaned event files. If a bin has >2000 counts, and if more than 50% of those come from <1% of pixels, then it is considered to be noise-dominated and hence unusable.
| Quadrant | # 1 sec bins | Bins with >0 counts | Bins with >2000 counts | High rate bins dominated by noise | Noise dominated (total time) | Noise dominated (detector-on time) | Marked lightcurve |
|---|---|---|---|---|---|---|---|
| A | 7718 | 6709 | 226 | 226 | 2.93% | 3.37% | 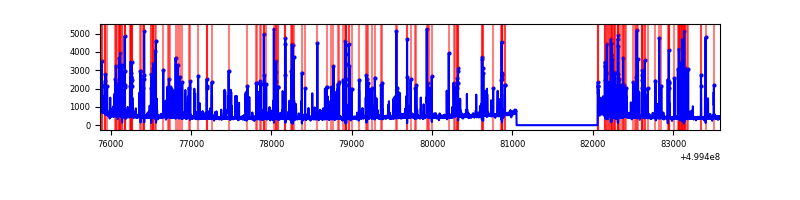 |
| B | 7718 | 6708 | 161 | 161 | 2.09% | 2.40% | 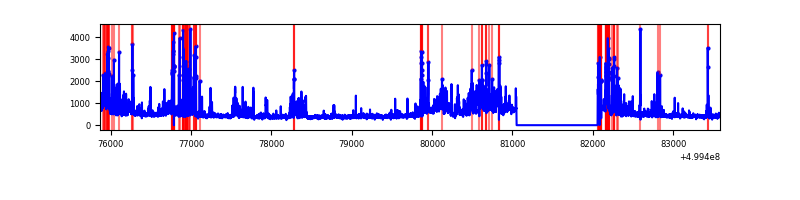 |
| C | 7718 | 6709 | 128 | 128 | 1.66% | 1.91% | 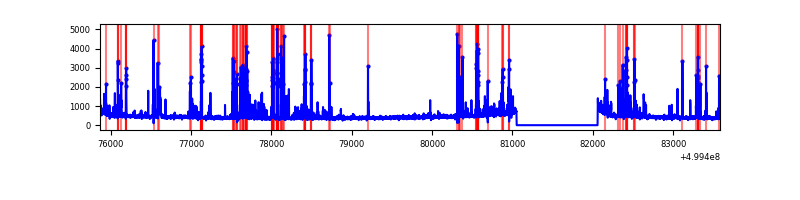 |
| D | 7717 | 6708 | 183 | 183 | 2.37% | 2.73% | 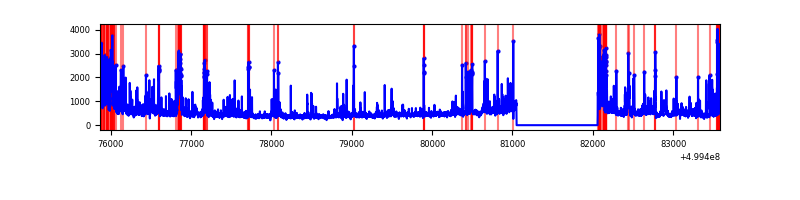 |
Top three noisy pixels from each quadrant. If the there are fewer than three noisy pixels in the level2.evt file, extra rows are filled as -1
| Pixel properties | Quadrant properties | ||||||
|---|---|---|---|---|---|---|---|
| Quadrant | DetID | PixID | Counts | Sigma | Mean | Median | Sigma |
| A | 11 | 3 | 979224 | 5418.56 | 715 | 697 | 180.6 |
| A | 3 | 14 | 91632 | 503.55 | 715 | 697 | 180.6 |
| A | 14 | 235 | 44872 | 244.62 | 715 | 697 | 180.6 |
| B | 0 | 173 | 732785 | 4818.16 | 708 | 684 | 151.9 |
| B | 5 | 172 | 166109 | 1088.71 | 708 | 684 | 151.9 |
| B | 10 | 14 | 120693 | 789.81 | 708 | 684 | 151.9 |
| C | 13 | 3 | 681416 | 3461.82 | 706 | 700 | 196.6 |
| C | 15 | 230 | 48235 | 241.74 | 706 | 700 | 196.6 |
| C | 15 | 157 | 45301 | 226.82 | 706 | 700 | 196.6 |
| D | 3 | 12 | 609454 | 3083.42 | 694 | 663 | 197.4 |
| D | 15 | 94 | 415267 | 2099.9 | 694 | 663 | 197.4 |
| D | 2 | 37 | 91219 | 458.65 | 694 | 663 | 197.4 |
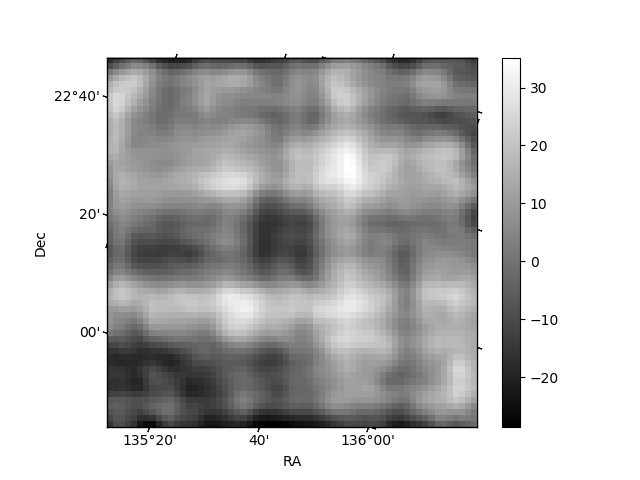
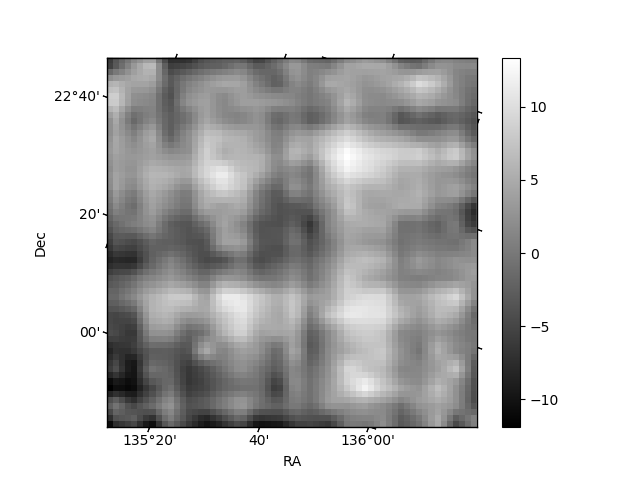
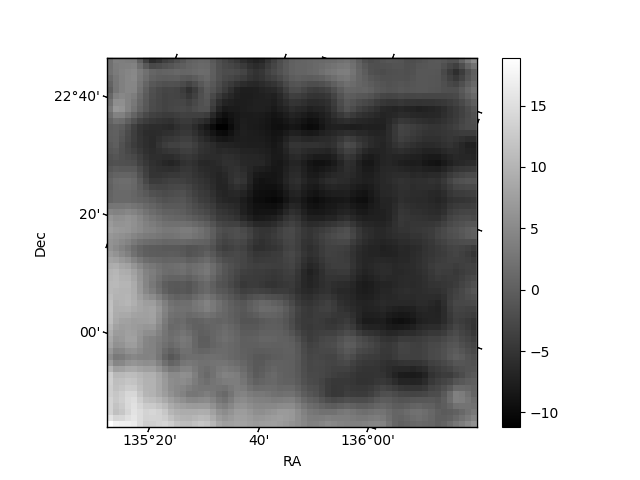
Histogram calculated using DETX and DETY for each event in the final _common_clean file
| Quadrant A | 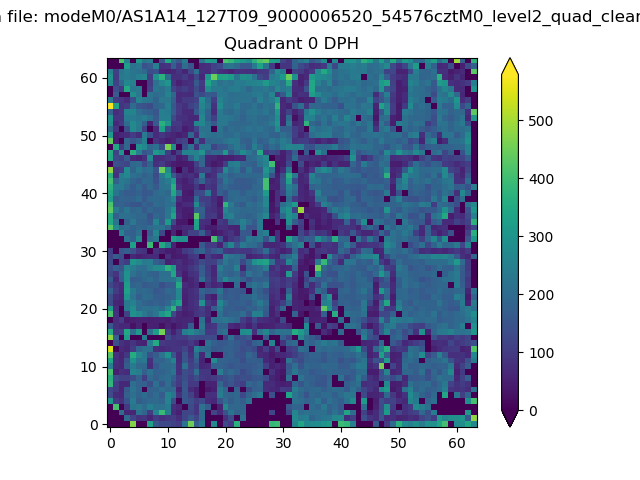 |
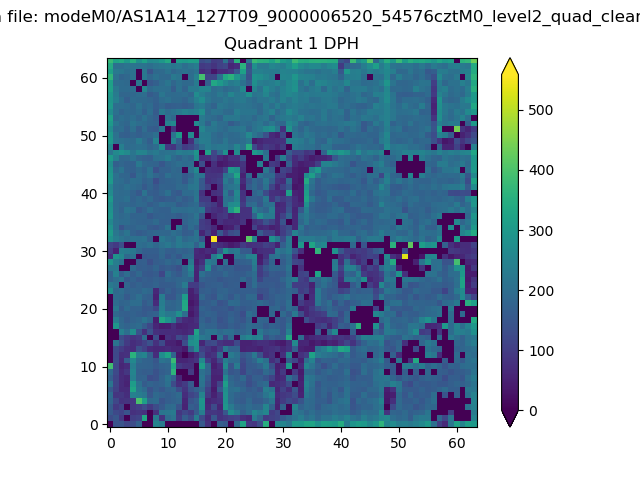 |
Quadrant B |
|---|---|---|---|
| Quadrant D | 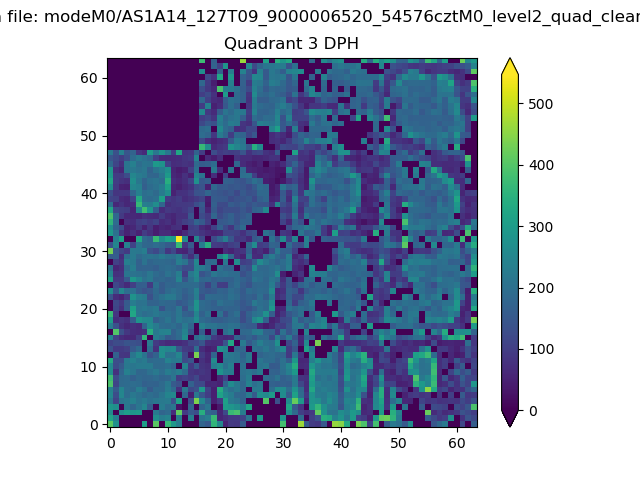 |
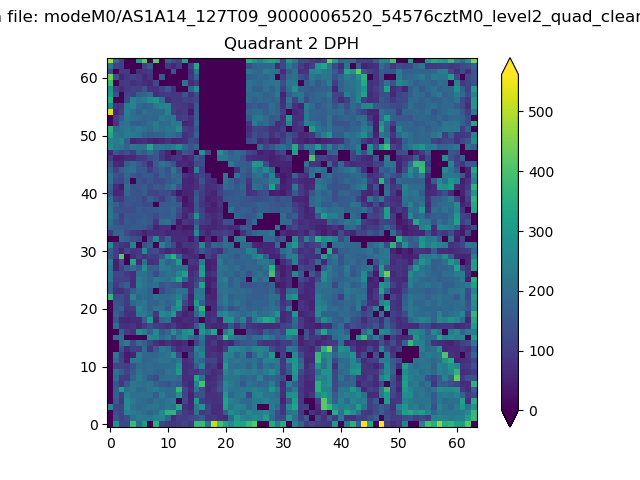 |
Quadrant C |
| Plot type | Count rate plots | Images |
|---|---|---|
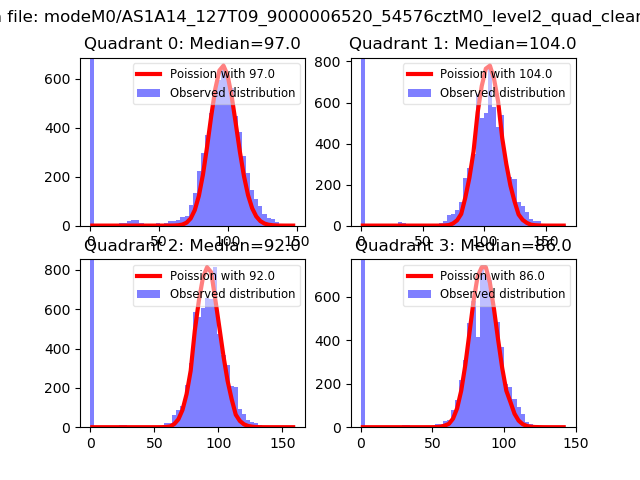
| Comparison with Poisson distribution Blue bars denote a histogram of data divided into 1 sec bins. Red curve is a Poisson curve with rate = median count rate of data. |
 |
 |
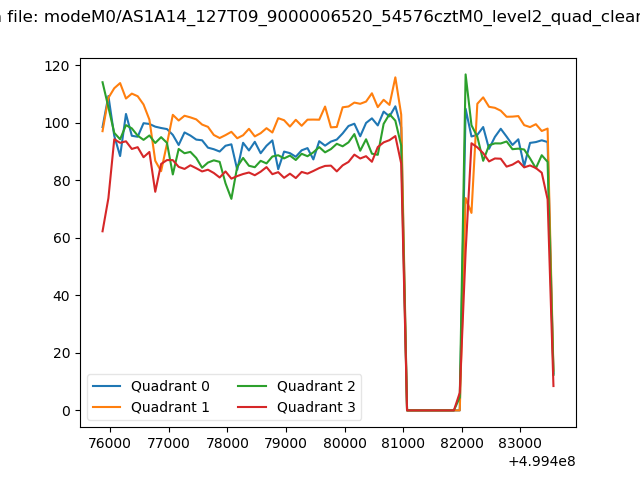
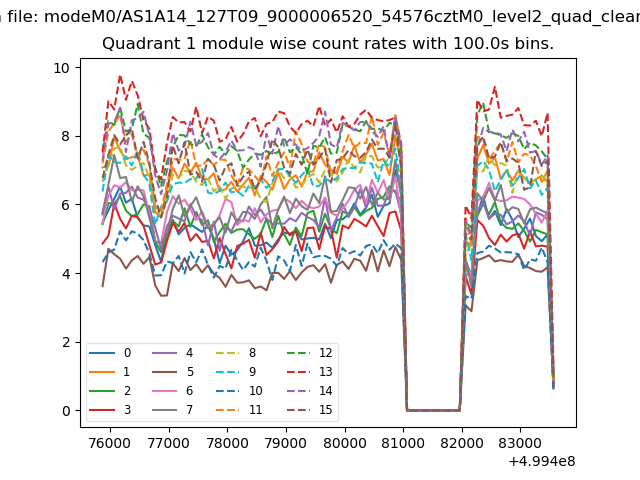
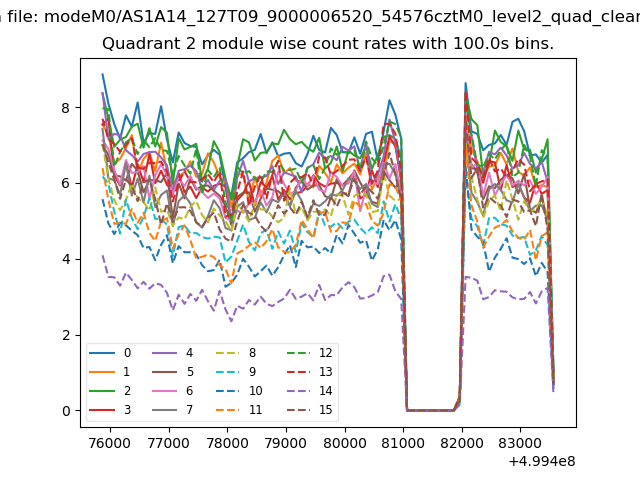
| Quadrant-wise count rates Data is divided into 100 sec bins |
 |
|
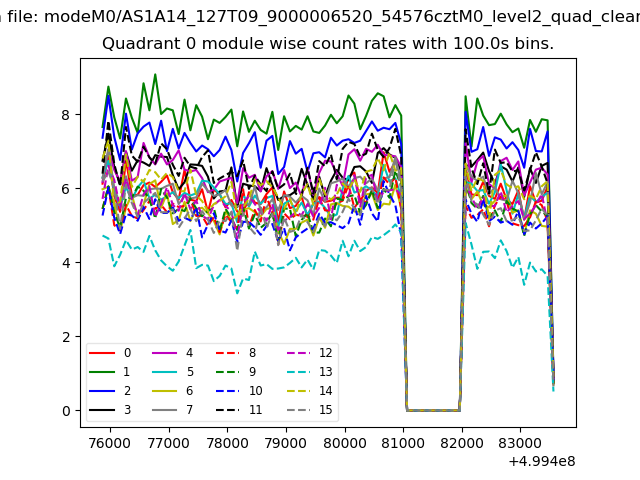
| Module-wise count rates for Quadrant A Data is divided into 100 sec bins |
 |
 |
| Module-wise count rates for Quadrant B Data is divided into 100 sec bins |
 |
 |
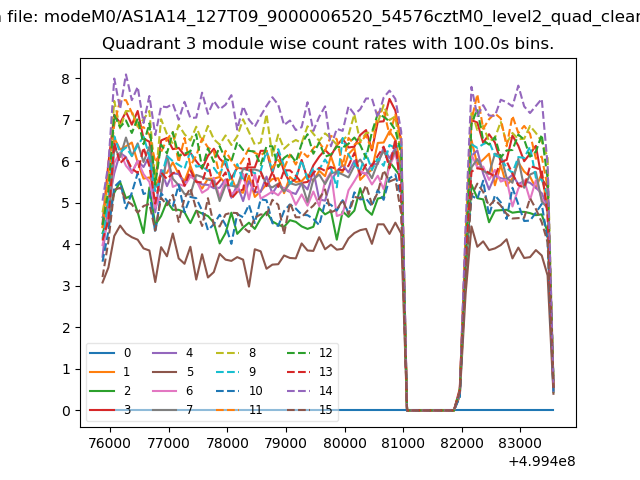
| Module-wise count rates for Quadrant C Data is divided into 100 sec bins |
 |
 |
| Module-wise count rates for Quadrant D Data is divided into 100 sec bins |
 |
 |
| Parameter | Plot |
|---|---|
| CZT HV Monitor | 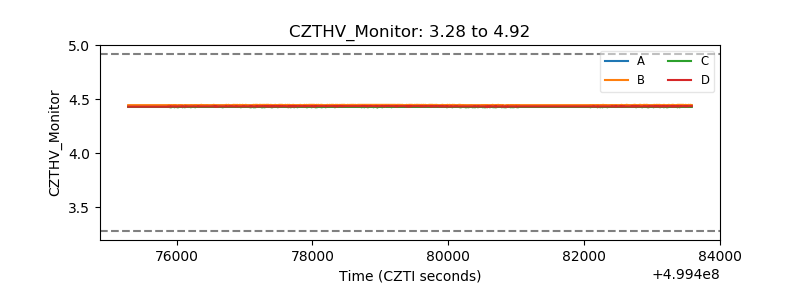 |
| D_VDD | 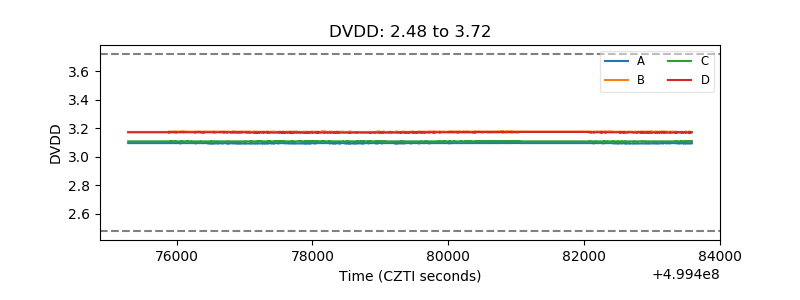 |
| Temperature 1 | 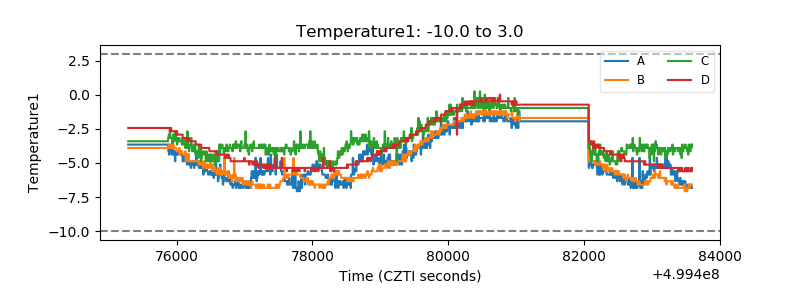 |
| Veto HV Monitor | 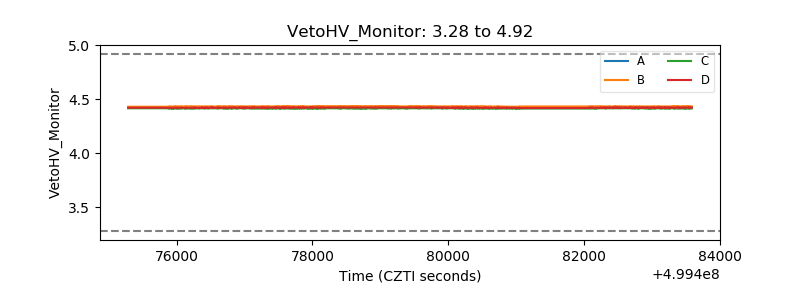 |
| Veto LLD | 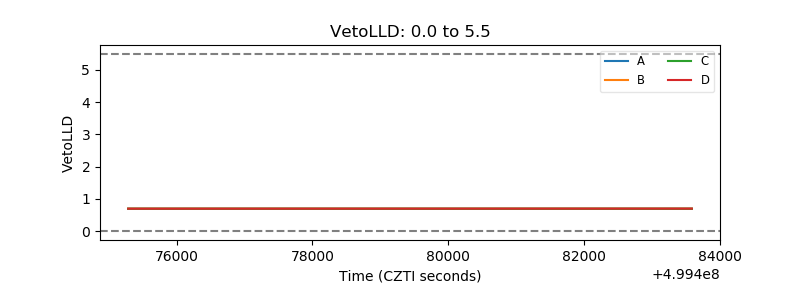 |
| Alpha Counter | 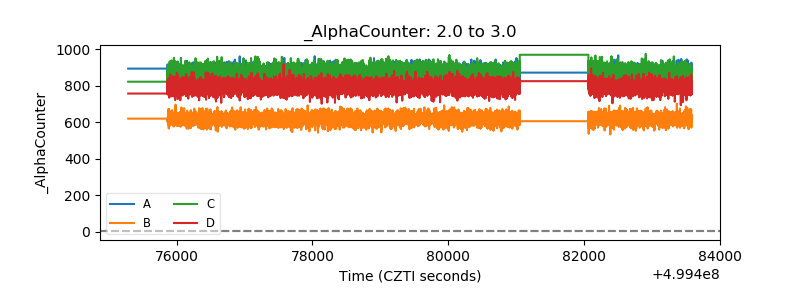 |
| _CPM_Rate | 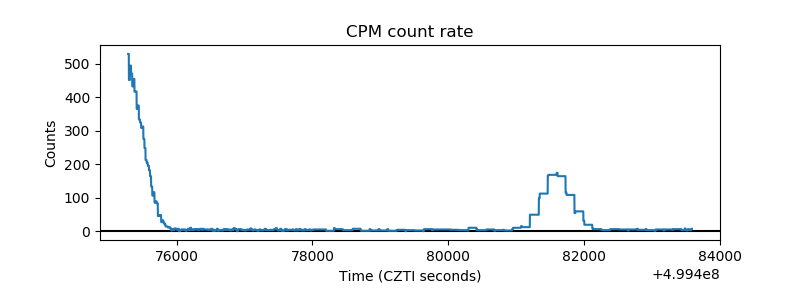 |
| CZT Counter | 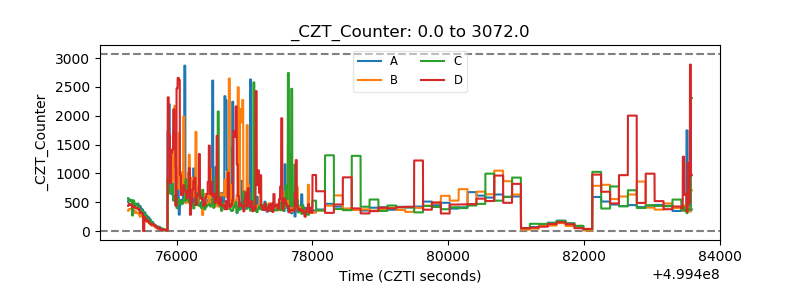 |
| +2.5 Volts monitor |  |
| +5 Volts monitor |  |
| _ROLL_ROT | 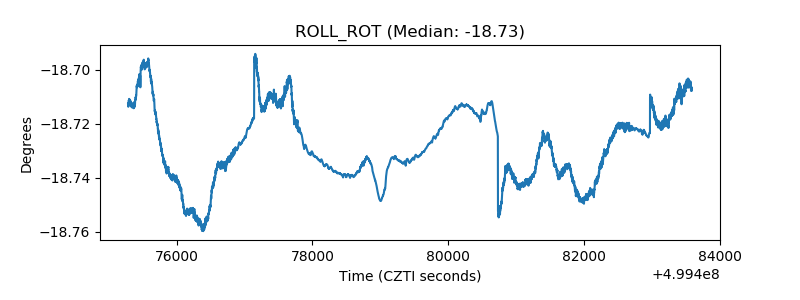 |
| _Roll_DEC | 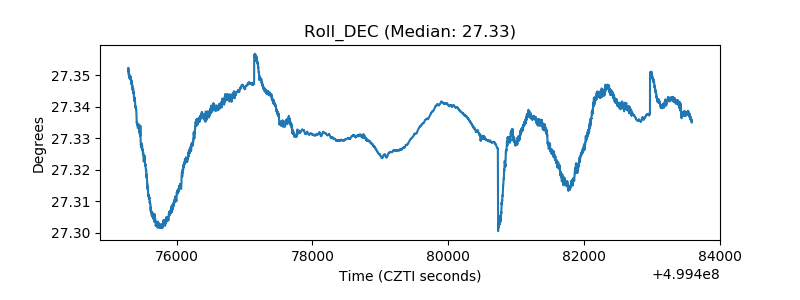 |
| _Roll_RA | 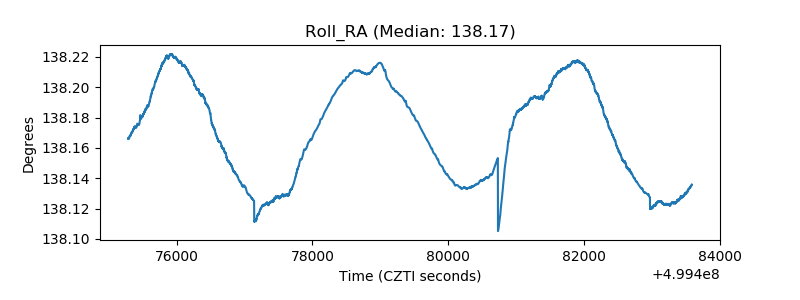 |
| Veto Counter | 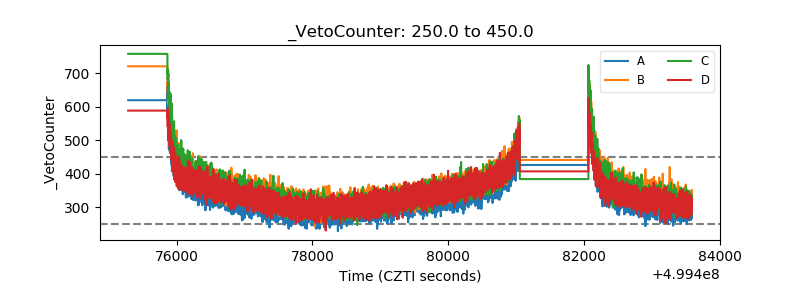 |