| Param | Original file | Final file |
|---|---|---|
| Filename | modeM0/AS1A14_127T09_9000006520_54577cztM0_level2.fits | modeM0/AS1A14_127T09_9000006520_54577cztM0_level2_quad_clean.evt |
| Size (bytes) | 587,419,200 | 102,208,320 |
| Size | 560.2 MB | 97.5 MB |
| Events in quadrant A | 4,625,101 | 692,023 |
| Events in quadrant B | 4,206,568 | 738,703 |
| Events in quadrant C | 7,788,358 | 531,254 |
| Events in quadrant D | 4,547,040 | 615,753 |
| Mode M0 | |||
|---|---|---|---|
| Quadrant | BADHDUFLAG | Total packets | Discarded packets |
| A | 0 | 18960 | 2 |
| B | 0 | 18046 | 2 |
| C | 0 | 28506 | 9 |
| D | 0 | 19047 | 2 |
| Mode SS | |||
|---|---|---|---|
| Quadrant | BADHDUFLAG | Total packets | Discarded packets |
| A | 0 | 150 | 0 |
| B | 0 | 150 | 0 |
| C | 0 | 150 | 0 |
| D | 0 | 150 | 0 |
| Mode M9 | |||
|---|---|---|---|
| Quadrant | BADHDUFLAG | Total packets | Discarded packets |
| A | 0 | 7 | 0 |
| B | 0 | 7 | 0 |
| C | 0 | 8 | 0 |
| D | 0 | 8 | 0 |
| Quadrant | Total seconds | Saturated seconds | Saturation percentage |
|---|---|---|---|
| A | 7428 | 365 | 4.913840% |
| B | 7428 | 311 | 4.186861% |
| C | 7427 | 1781 | 23.980073% |
| D | 7427 | 297 | 3.998923% |
Noise dominated data is calculated using 1-second bins in cleaned event files. If a bin has >2000 counts, and if more than 50% of those come from <1% of pixels, then it is considered to be noise-dominated and hence unusable.
| Quadrant | # 1 sec bins | Bins with >0 counts | Bins with >2000 counts | High rate bins dominated by noise | Noise dominated (total time) | Noise dominated (detector-on time) | Marked lightcurve |
|---|---|---|---|---|---|---|---|
| A | 8043 | 7429 | 258 | 258 | 3.21% | 3.47% | 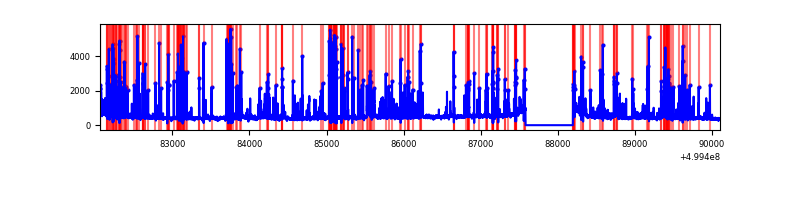 |
| B | 8043 | 7429 | 140 | 140 | 1.74% | 1.88% | 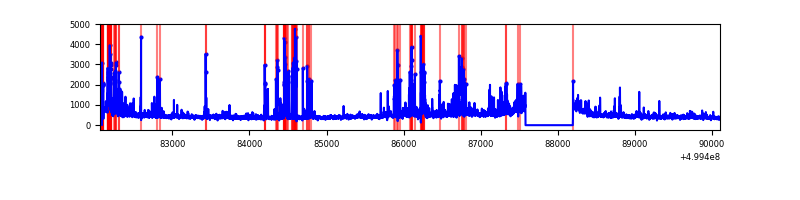 |
| C | 8042 | 7428 | 1626 | 1626 | 20.22% | 21.89% | 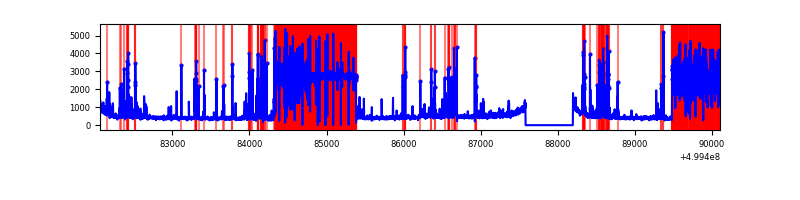 |
| D | 8042 | 7428 | 204 | 204 | 2.54% | 2.75% | 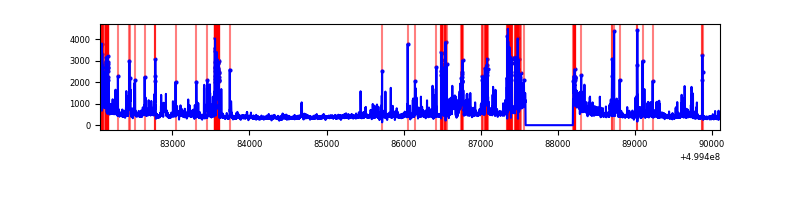 |
Top three noisy pixels from each quadrant. If the there are fewer than three noisy pixels in the level2.evt file, extra rows are filled as -1
| Pixel properties | Quadrant properties | ||||||
|---|---|---|---|---|---|---|---|
| Quadrant | DetID | PixID | Counts | Sigma | Mean | Median | Sigma |
| A | 11 | 3 | 936378 | 4753.11 | 789 | 772 | 196.8 |
| A | 0 | 8 | 231194 | 1170.6 | 789 | 772 | 196.8 |
| A | 14 | 235 | 124318 | 627.64 | 789 | 772 | 196.8 |
| B | 4 | 171 | 222338 | 1314.11 | 787 | 758 | 168.6 |
| B | 1 | 207 | 221677 | 1310.19 | 787 | 758 | 168.6 |
| B | 5 | 172 | 187899 | 1109.87 | 787 | 758 | 168.6 |
| C | 4 | 5 | 4027957 | 21034.78 | 684 | 677 | 191.5 |
| C | 13 | 3 | 751898 | 3923.68 | 684 | 677 | 191.5 |
| C | 15 | 230 | 115676 | 600.65 | 684 | 677 | 191.5 |
| D | 3 | 12 | 683783 | 3139.99 | 763 | 727 | 217.5 |
| D | 2 | 37 | 169680 | 776.67 | 763 | 727 | 217.5 |
| D | 1 | 3 | 143211 | 655.0 | 763 | 727 | 217.5 |
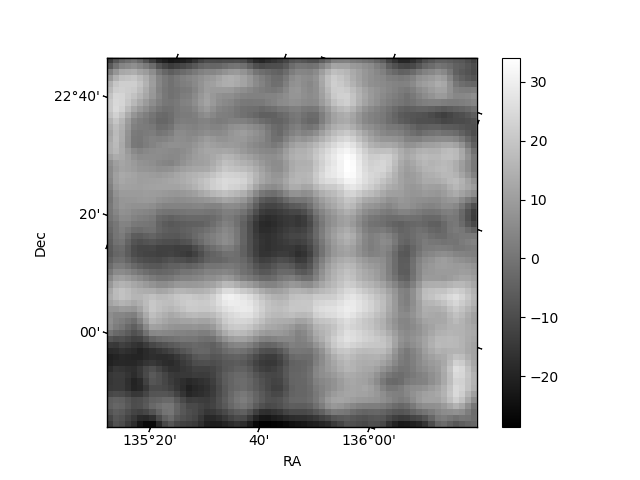
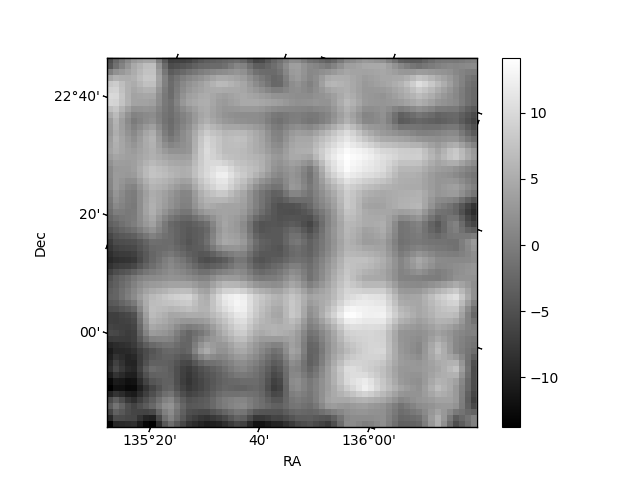
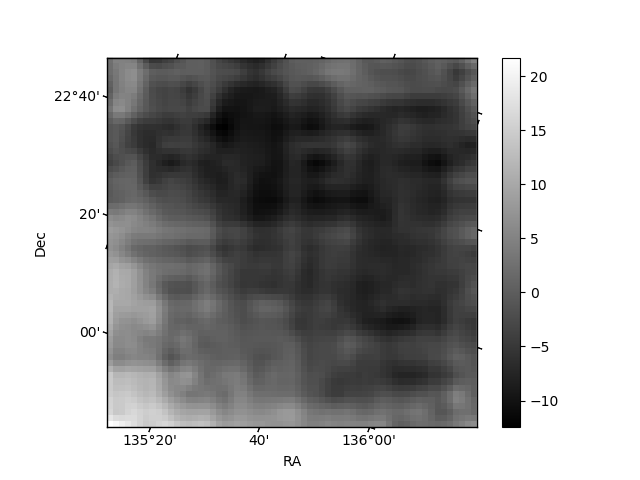
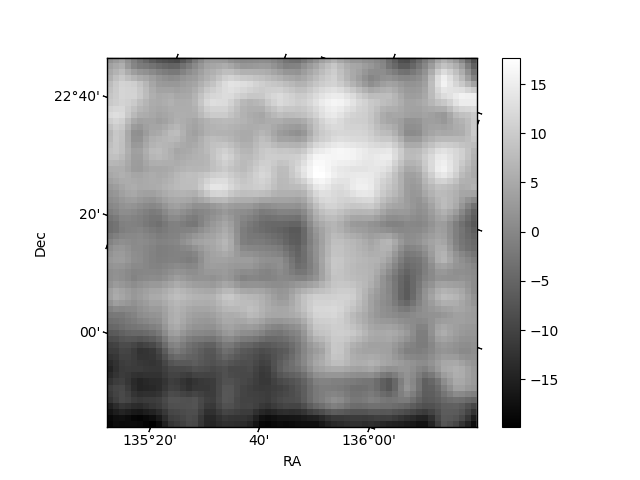
Histogram calculated using DETX and DETY for each event in the final _common_clean file
| Quadrant A | 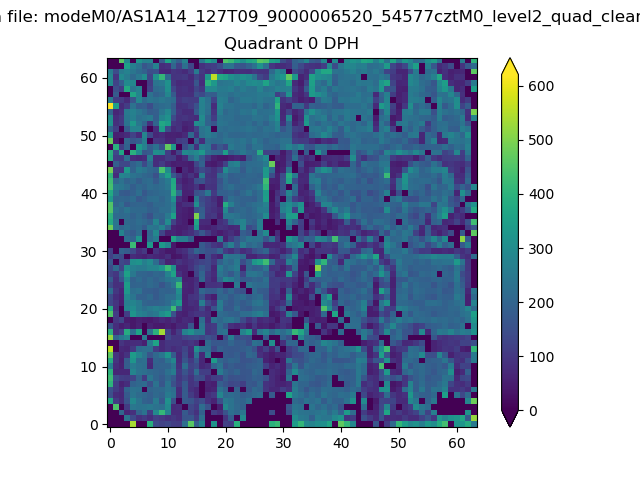 |
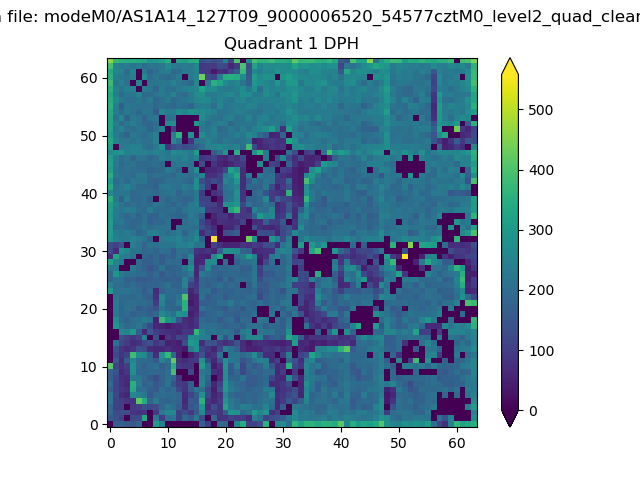 |
Quadrant B |
|---|---|---|---|
| Quadrant D | 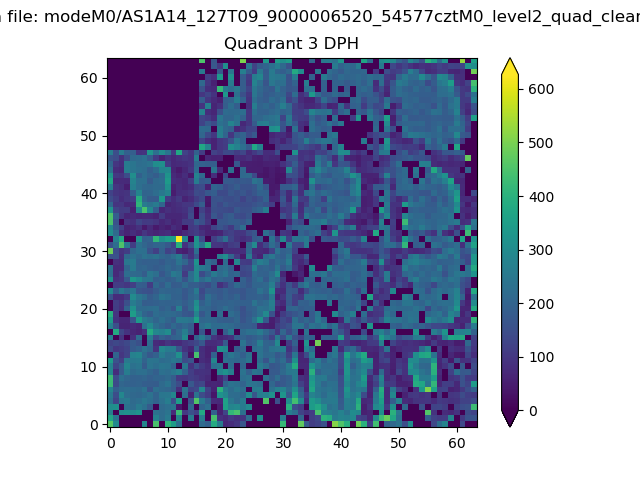 |
 |
Quadrant C |
| Plot type | Count rate plots | Images |
|---|---|---|
| Comparison with Poisson distribution Blue bars denote a histogram of data divided into 1 sec bins. Red curve is a Poisson curve with rate = median count rate of data. |
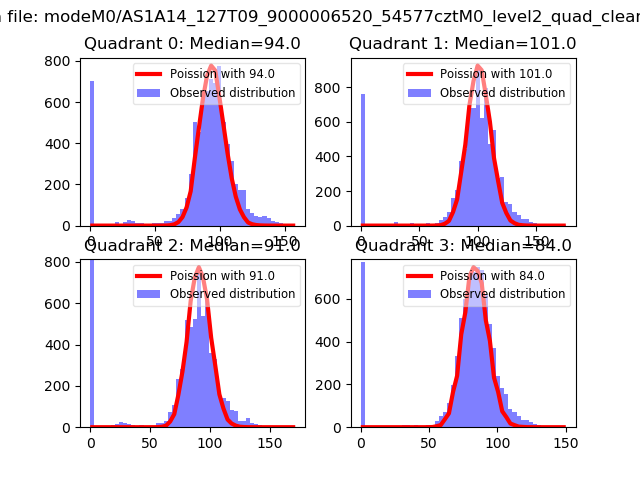 |
 |
| Quadrant-wise count rates Data is divided into 100 sec bins |
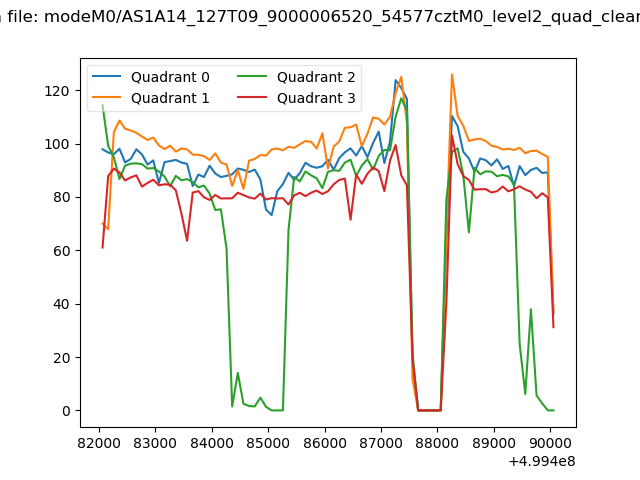 |
|
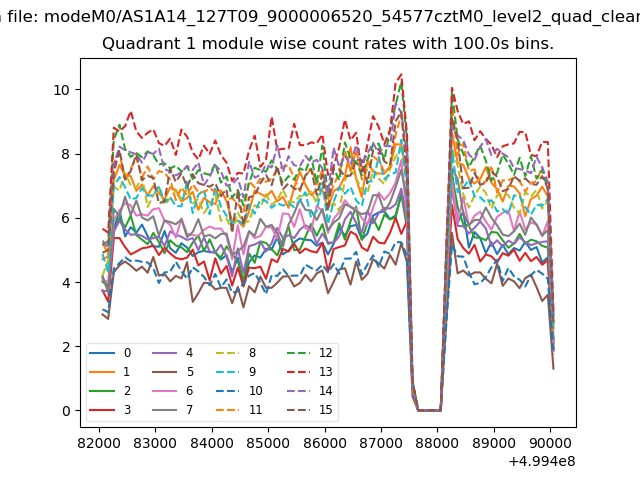
| Module-wise count rates for Quadrant A Data is divided into 100 sec bins |
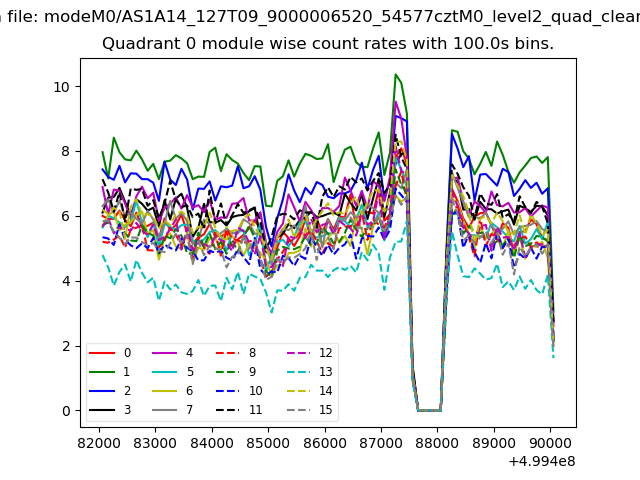 |
 |
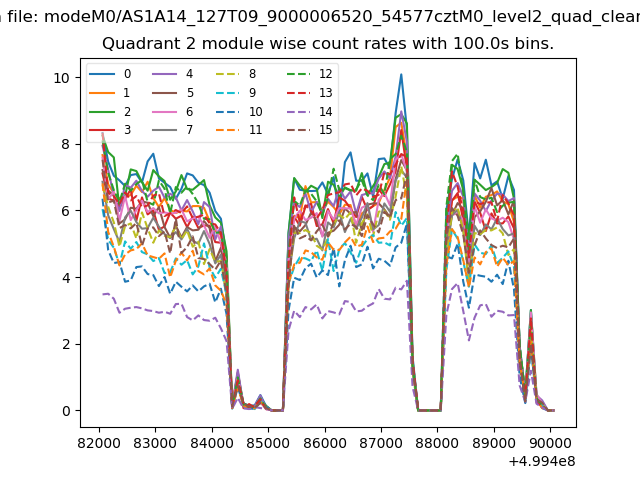
| Module-wise count rates for Quadrant B Data is divided into 100 sec bins |
 |
 |
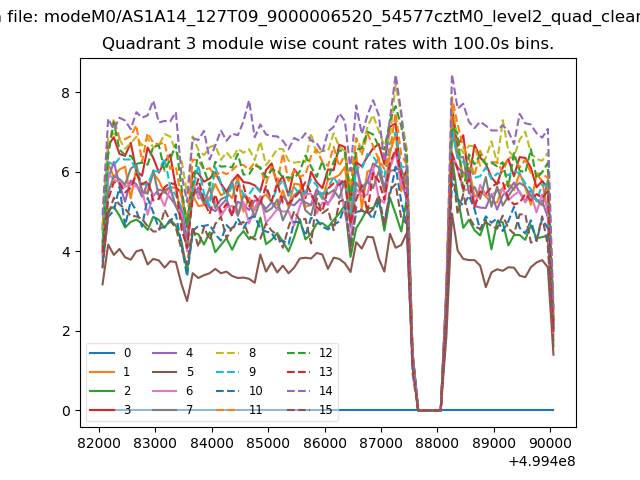
| Module-wise count rates for Quadrant C Data is divided into 100 sec bins |
 |
 |
| Module-wise count rates for Quadrant D Data is divided into 100 sec bins |
 |
 |
| Parameter | Plot |
|---|---|
| CZT HV Monitor | 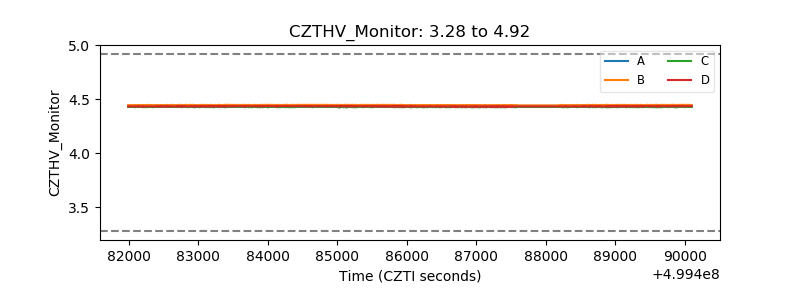 |
| D_VDD | 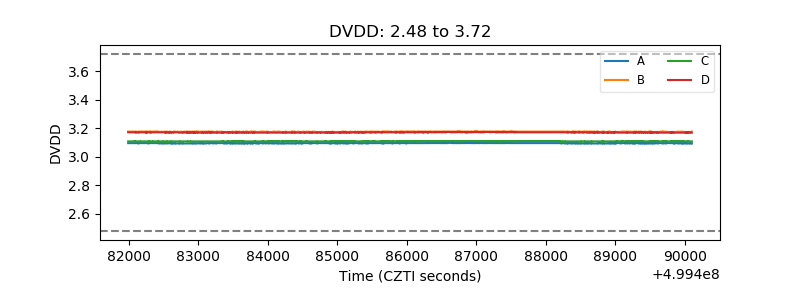 |
| Temperature 1 | 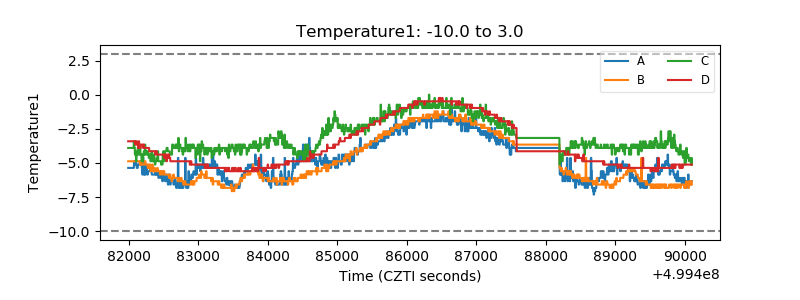 |
| Veto HV Monitor | 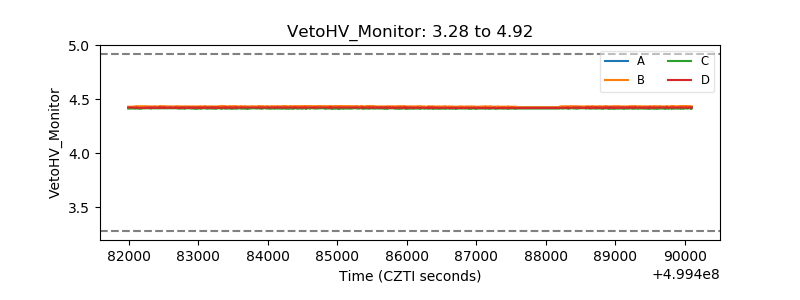 |
| Veto LLD | 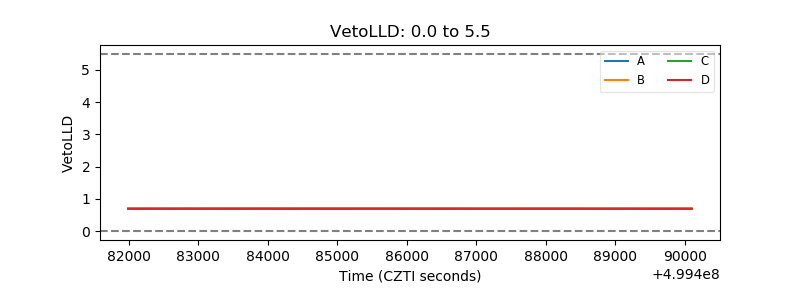 |
| Alpha Counter | 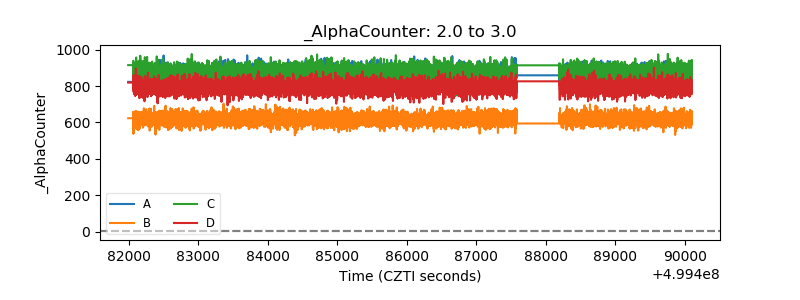 |
| _CPM_Rate | 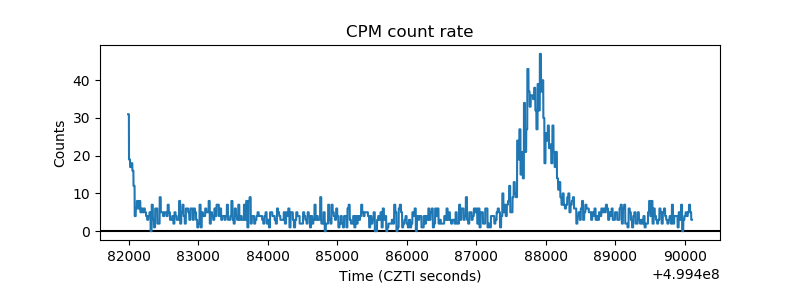 |
| CZT Counter | 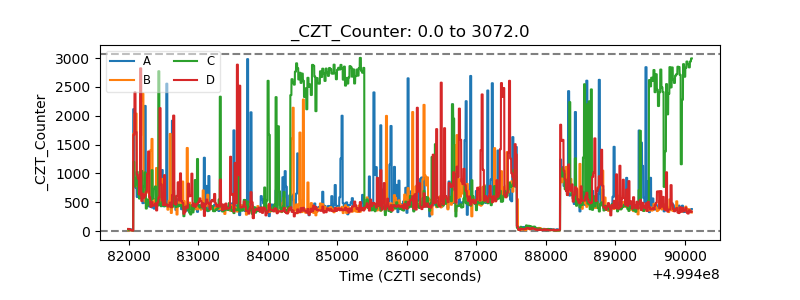 |
| +2.5 Volts monitor |  |
| +5 Volts monitor |  |
| _ROLL_ROT | 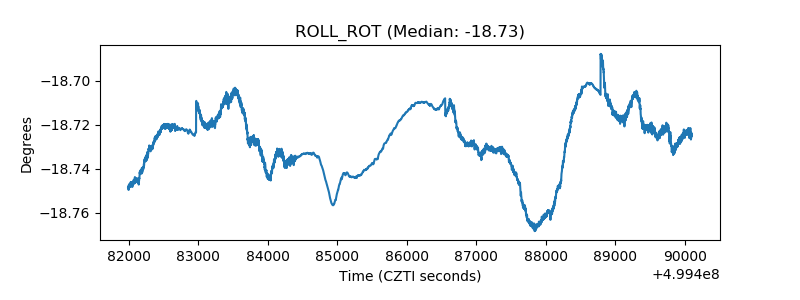 |
| _Roll_DEC | 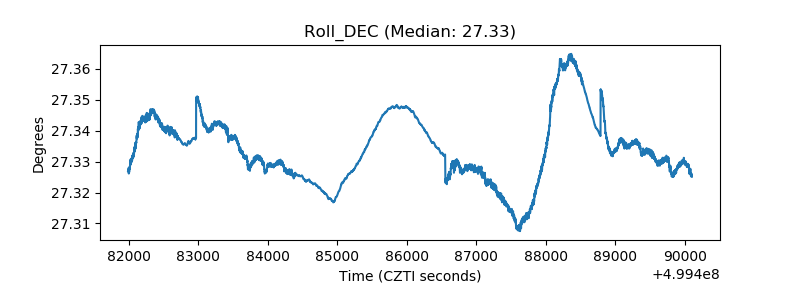 |
| _Roll_RA | 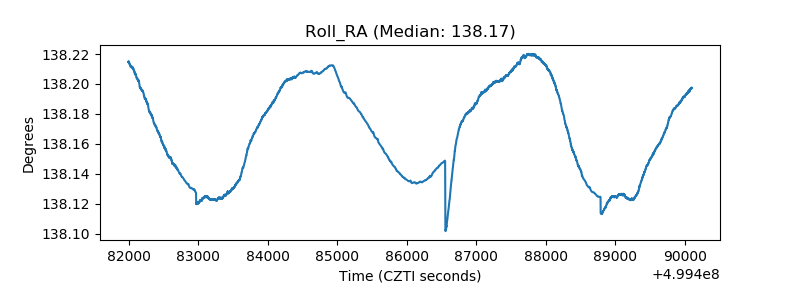 |
| Veto Counter | 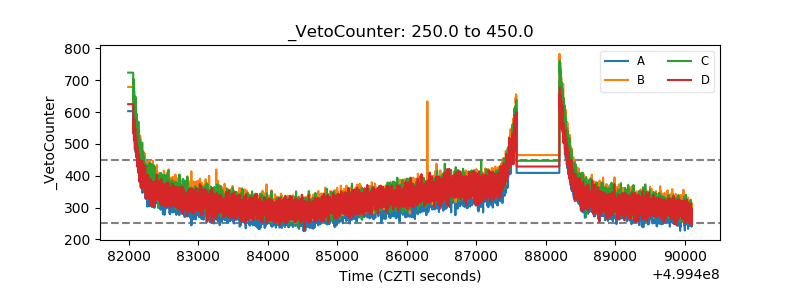 |