| Param | Original file | Final file |
|---|---|---|
| Filename | modeM0/AS1A14_127T09_9000006520_54579cztM0_level2.fits | modeM0/AS1A14_127T09_9000006520_54579cztM0_level2_quad_clean.evt |
| Size (bytes) | 541,362,240 | 98,455,680 |
| Size | 516.3 MB | 93.9 MB |
| Events in quadrant A | 4,087,825 | 689,121 |
| Events in quadrant B | 6,047,239 | 594,114 |
| Events in quadrant C | 5,843,717 | 560,540 |
| Events in quadrant D | 3,483,012 | 620,626 |
| Mode M0 | |||
|---|---|---|---|
| Quadrant | BADHDUFLAG | Total packets | Discarded packets |
| A | 0 | 17046 | 0 |
| B | 0 | 23509 | 0 |
| C | 0 | 22852 | 0 |
| D | 0 | 15930 | 0 |
| Mode SS | |||
|---|---|---|---|
| Quadrant | BADHDUFLAG | Total packets | Discarded packets |
| A | 0 | 148 | 0 |
| B | 0 | 148 | 0 |
| C | 0 | 148 | 0 |
| D | 0 | 148 | 0 |
| Quadrant | Total seconds | Saturated seconds | Saturation percentage |
|---|---|---|---|
| A | 7424 | 99 | 1.333513% |
| B | 7425 | 1479 | 19.919192% |
| C | 7425 | 1078 | 14.518519% |
| D | 7425 | 18 | 0.242424% |
Noise dominated data is calculated using 1-second bins in cleaned event files. If a bin has >2000 counts, and if more than 50% of those come from <1% of pixels, then it is considered to be noise-dominated and hence unusable.
| Quadrant | # 1 sec bins | Bins with >0 counts | Bins with >2000 counts | High rate bins dominated by noise | Noise dominated (total time) | Noise dominated (detector-on time) | Marked lightcurve |
|---|---|---|---|---|---|---|---|
| A | 7424 | 7424 | 84 | 84 | 1.13% | 1.13% | 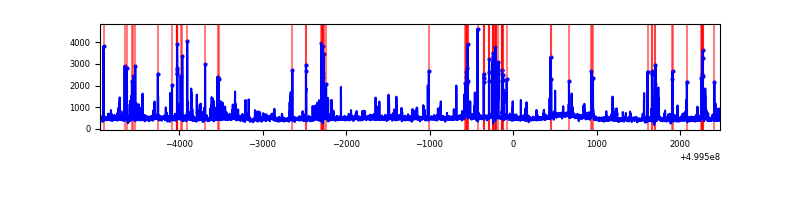 |
| B | 7425 | 7425 | 771 | 771 | 10.38% | 10.38% | 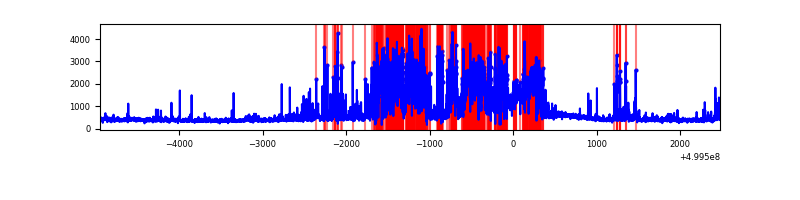 |
| C | 7425 | 7425 | 978 | 978 | 13.17% | 13.17% | 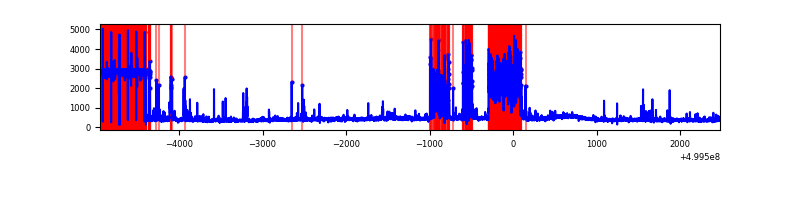 |
| D | 7425 | 7425 | 19 | 19 | 0.26% | 0.26% | 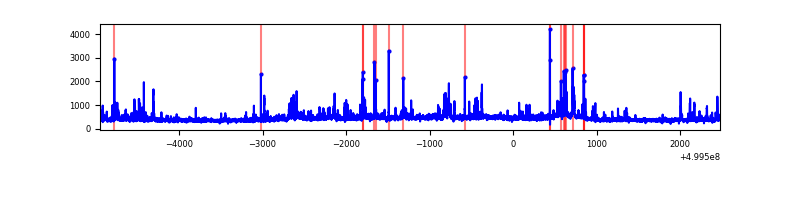 |
Top three noisy pixels from each quadrant. If the there are fewer than three noisy pixels in the level2.evt file, extra rows are filled as -1
| Pixel properties | Quadrant properties | ||||||
|---|---|---|---|---|---|---|---|
| Quadrant | DetID | PixID | Counts | Sigma | Mean | Median | Sigma |
| A | 3 | 14 | 358337 | 1855.78 | 776 | 755 | 192.7 |
| A | 11 | 3 | 290615 | 1504.31 | 776 | 755 | 192.7 |
| A | 3 | 62 | 132188 | 682.11 | 776 | 755 | 192.7 |
| B | 4 | 171 | 3012317 | 21073.78 | 661 | 637 | 142.9 |
| B | 10 | 14 | 136451 | 950.34 | 661 | 637 | 142.9 |
| B | 1 | 207 | 130279 | 907.15 | 661 | 637 | 142.9 |
| C | 4 | 5 | 1579849 | 8375.39 | 683 | 677 | 188.5 |
| C | 14 | 96 | 855658 | 4534.53 | 683 | 677 | 188.5 |
| C | 6 | 223 | 286913 | 1518.1 | 683 | 677 | 188.5 |
| D | 2 | 37 | 177903 | 822.63 | 748 | 711 | 215.4 |
| D | 3 | 12 | 123310 | 569.18 | 748 | 711 | 215.4 |
| D | 1 | 3 | 67526 | 310.19 | 748 | 711 | 215.4 |
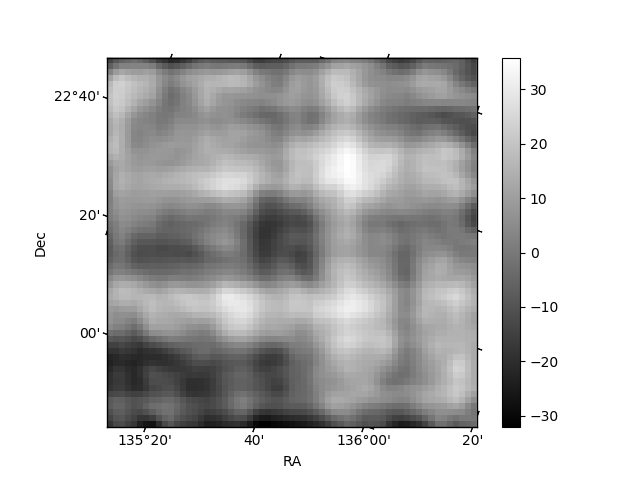
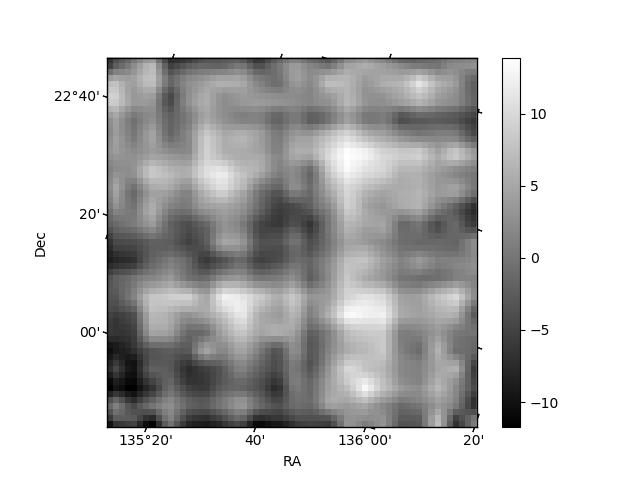
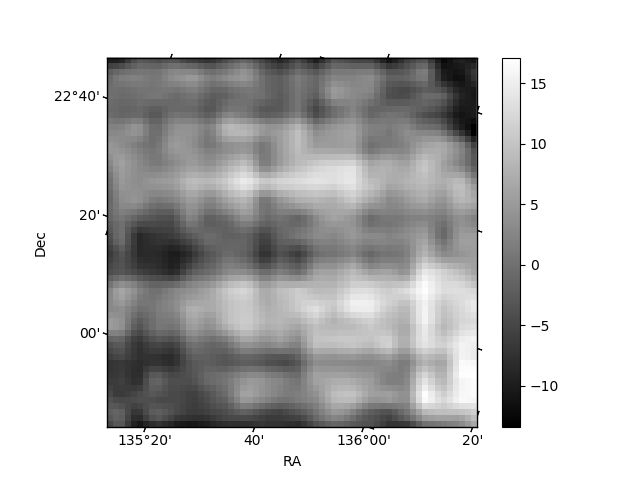
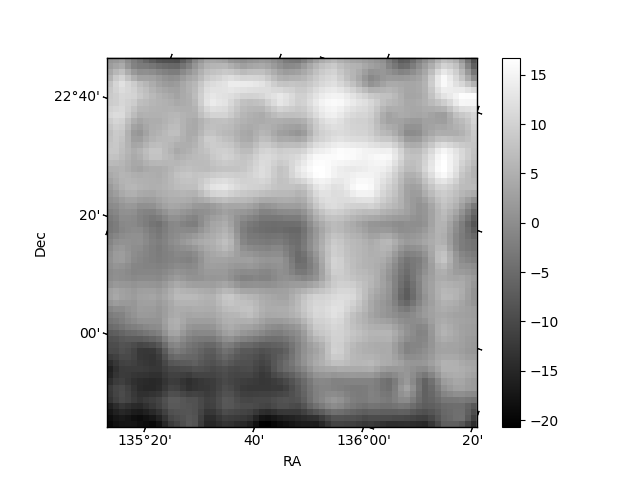
Histogram calculated using DETX and DETY for each event in the final _common_clean file
| Quadrant A | 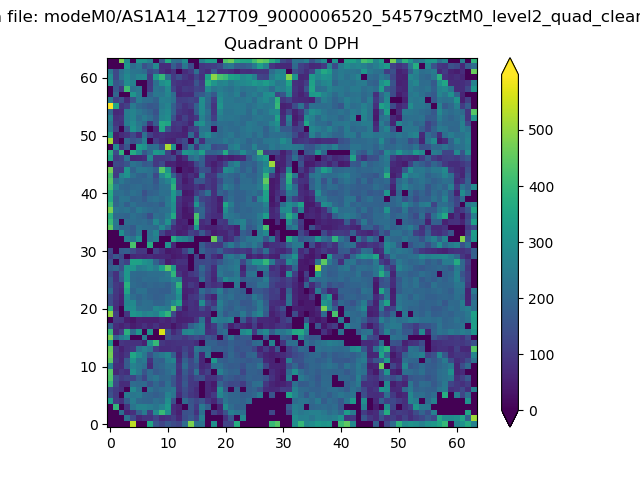 |
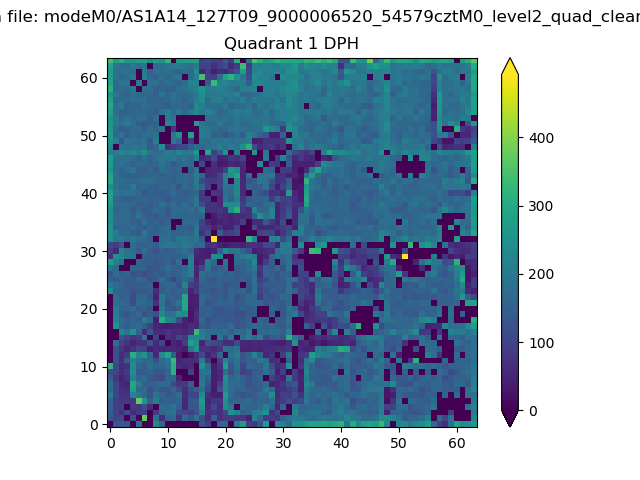 |
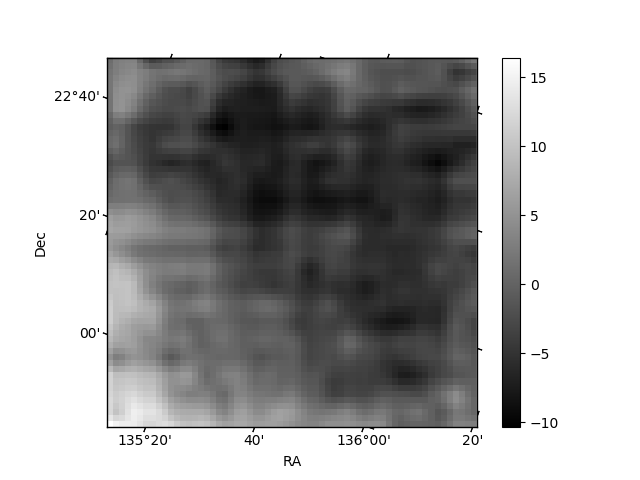
Quadrant B |
|---|---|---|---|
| Quadrant D | 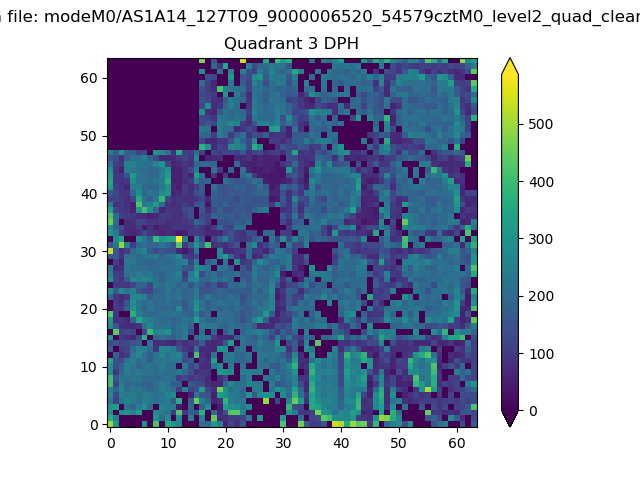 |
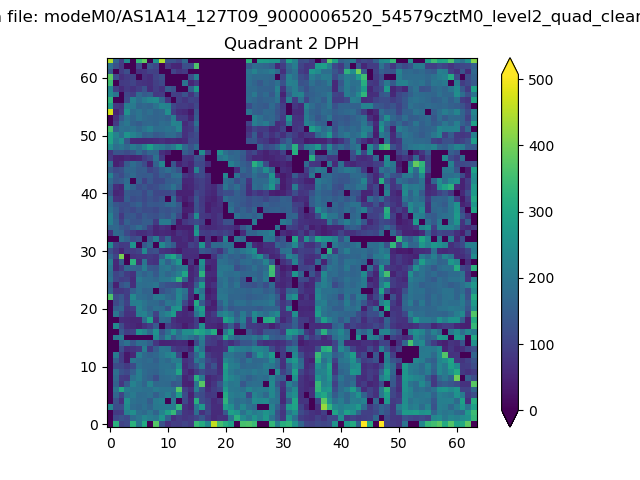 |
Quadrant C |
| Plot type | Count rate plots | Images |
|---|---|---|
| Comparison with Poisson distribution Blue bars denote a histogram of data divided into 1 sec bins. Red curve is a Poisson curve with rate = median count rate of data. |
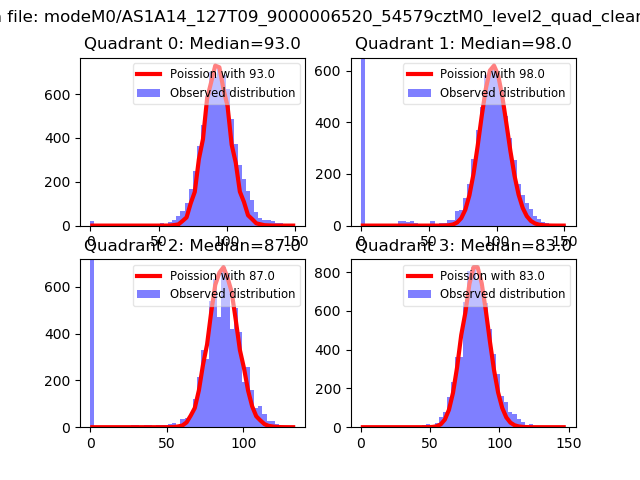 |
 |
| Quadrant-wise count rates Data is divided into 100 sec bins |
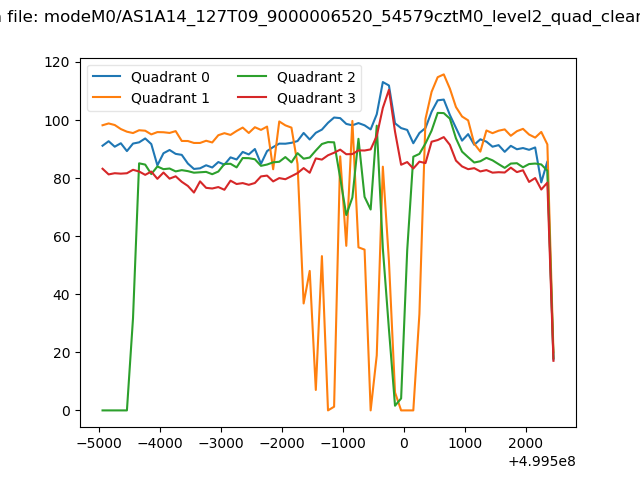 |
|
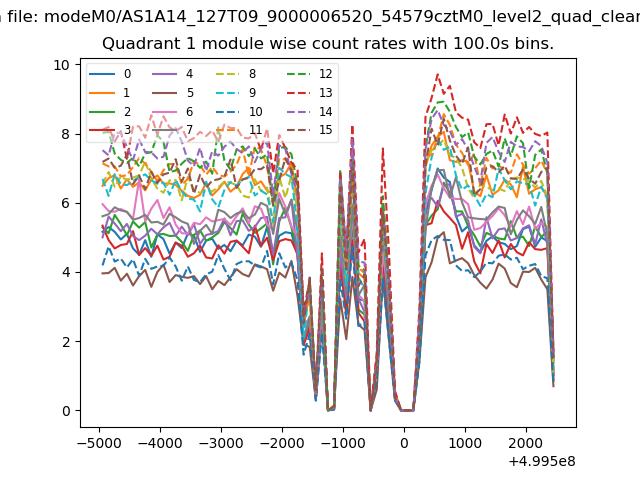
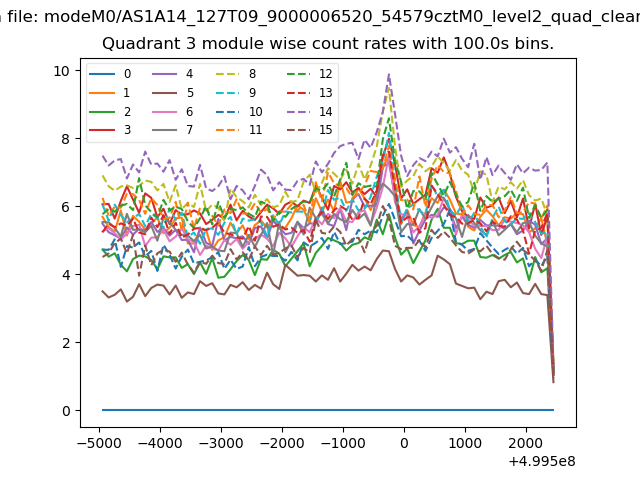
| Module-wise count rates for Quadrant A Data is divided into 100 sec bins |
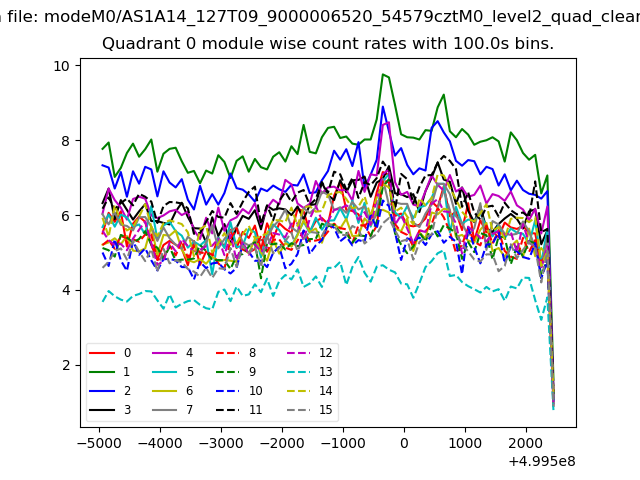 |
 |
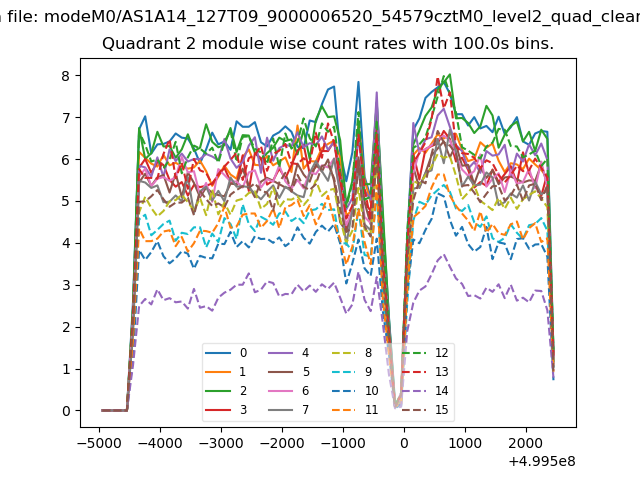
| Module-wise count rates for Quadrant B Data is divided into 100 sec bins |
 |
 |
| Module-wise count rates for Quadrant C Data is divided into 100 sec bins |
 |
 |
| Module-wise count rates for Quadrant D Data is divided into 100 sec bins |
 |
 |
| Parameter | Plot |
|---|---|
| CZT HV Monitor | 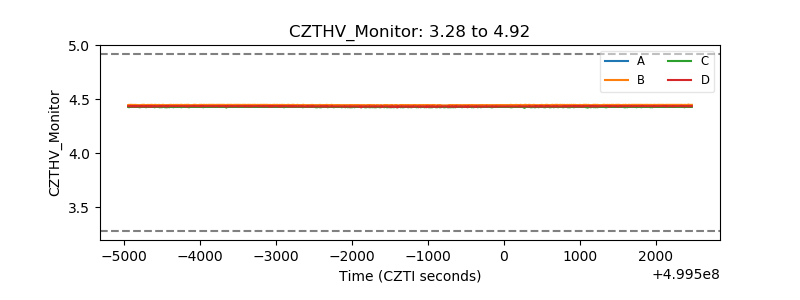 |
| D_VDD | 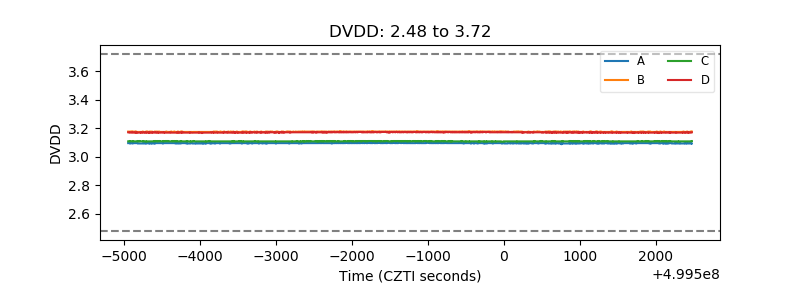 |
| Temperature 1 | 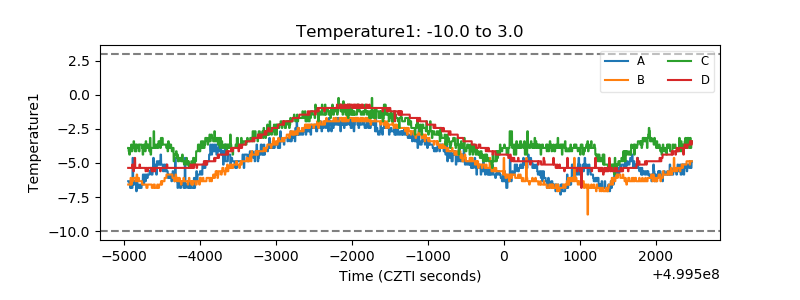 |
| Veto HV Monitor | 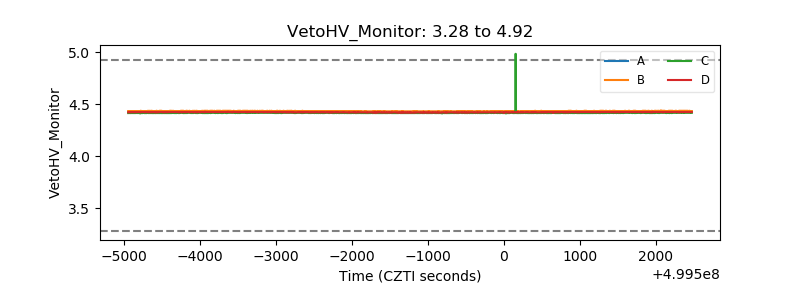 |
| Veto LLD | 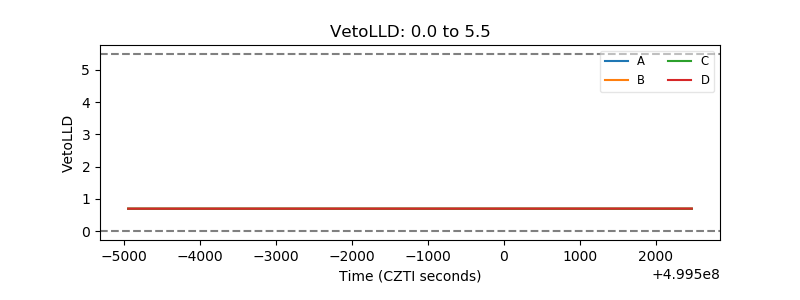 |
| Alpha Counter | 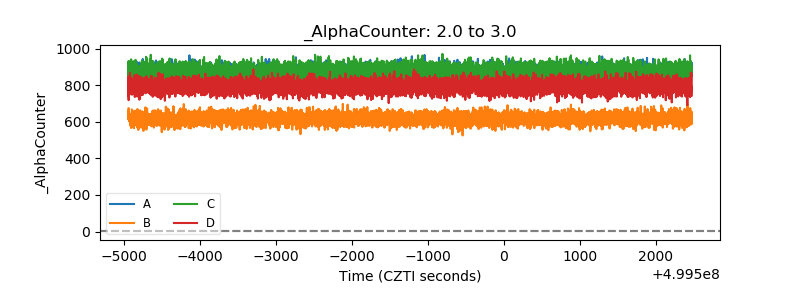 |
| _CPM_Rate | 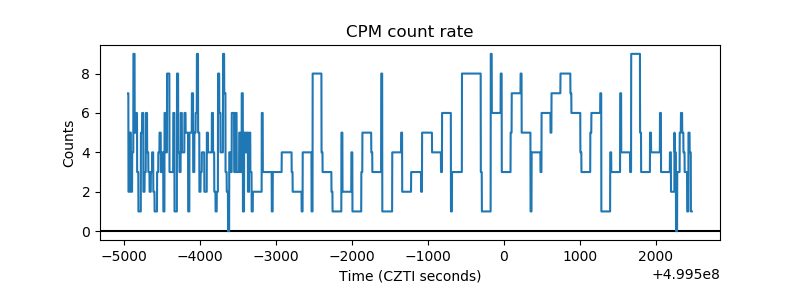 |
| CZT Counter | 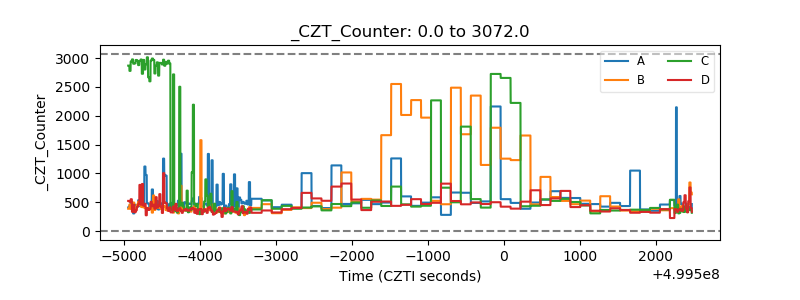 |
| +2.5 Volts monitor |  |
| +5 Volts monitor |  |
| _ROLL_ROT | 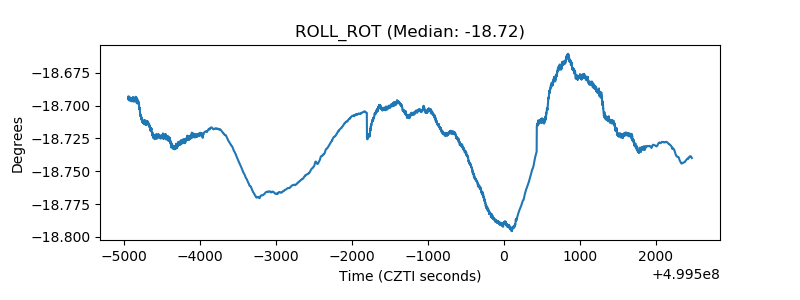 |
| _Roll_DEC | 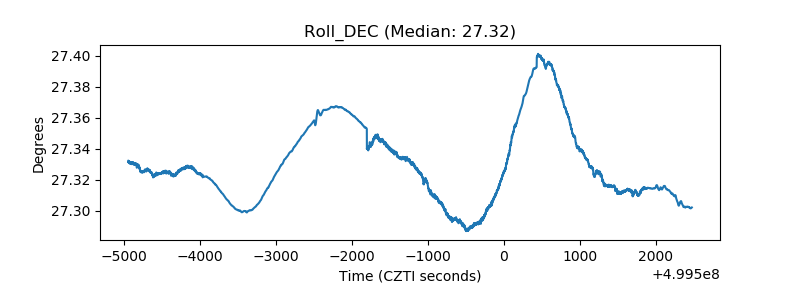 |
| _Roll_RA | 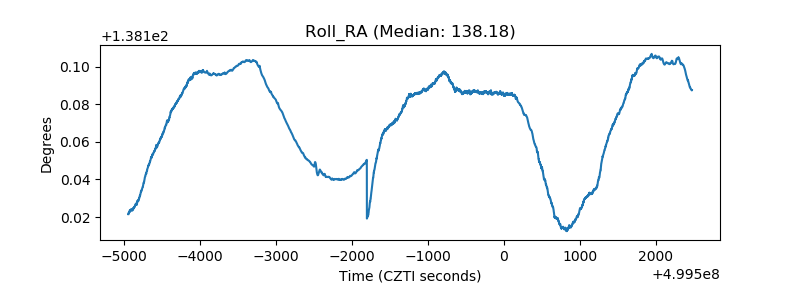 |
| Veto Counter | 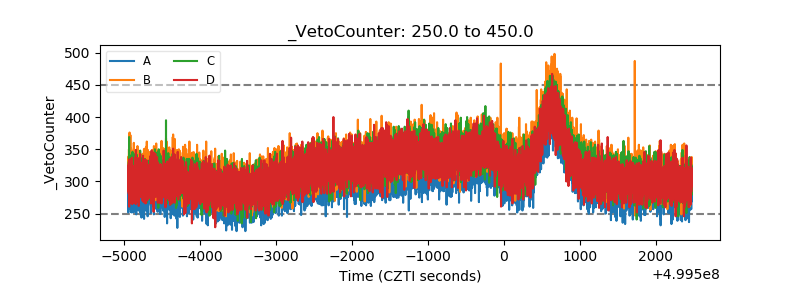 |