| Param | Original file | Final file |
|---|---|---|
| Filename | modeM0/AS1A14_127T09_9000006520_54580cztM0_level2.fits | modeM0/AS1A14_127T09_9000006520_54580cztM0_level2_quad_clean.evt |
| Size (bytes) | 510,871,680 | 111,870,720 |
| Size | 487.2 MB | 106.7 MB |
| Events in quadrant A | 6,529,437 | 710,258 |
| Events in quadrant B | 3,920,411 | 781,581 |
| Events in quadrant C | 3,984,053 | 688,023 |
| Events in quadrant D | 3,861,986 | 656,920 |
| Mode M0 | |||
|---|---|---|---|
| Quadrant | BADHDUFLAG | Total packets | Discarded packets |
| A | 0 | 25030 | 0 |
| B | 0 | 17386 | 0 |
| C | 0 | 17902 | 0 |
| D | 0 | 17419 | 0 |
| Mode SS | |||
|---|---|---|---|
| Quadrant | BADHDUFLAG | Total packets | Discarded packets |
| A | 0 | 158 | 0 |
| B | 0 | 158 | 0 |
| C | 0 | 158 | 0 |
| D | 0 | 158 | 0 |
| Quadrant | Total seconds | Saturated seconds | Saturation percentage |
|---|---|---|---|
| A | 7918 | 453 | 5.721142% |
| B | 7918 | 96 | 1.212427% |
| C | 7918 | 122 | 1.540793% |
| D | 7918 | 23 | 0.290477% |
Noise dominated data is calculated using 1-second bins in cleaned event files. If a bin has >2000 counts, and if more than 50% of those come from <1% of pixels, then it is considered to be noise-dominated and hence unusable.
| Quadrant | # 1 sec bins | Bins with >0 counts | Bins with >2000 counts | High rate bins dominated by noise | Noise dominated (total time) | Noise dominated (detector-on time) | Marked lightcurve |
|---|---|---|---|---|---|---|---|
| A | 7918 | 7918 | 397 | 397 | 5.01% | 5.01% | 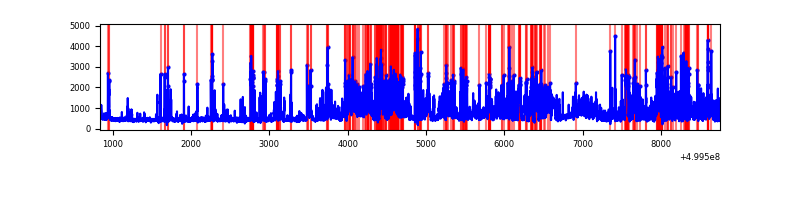 |
| B | 7918 | 7918 | 56 | 56 | 0.71% | 0.71% | 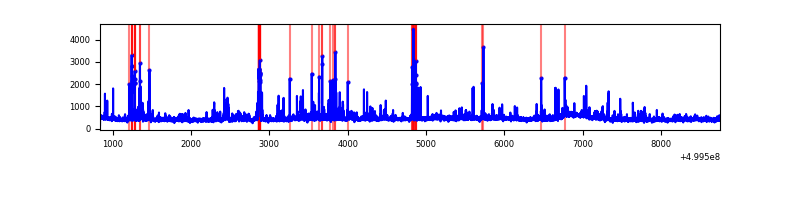 |
| C | 7918 | 7918 | 86 | 86 | 1.09% | 1.09% | 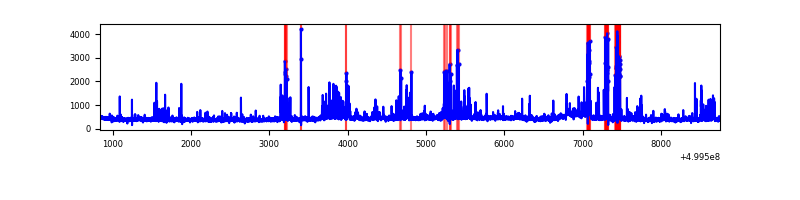 |
| D | 7918 | 7918 | 18 | 18 | 0.23% | 0.23% | 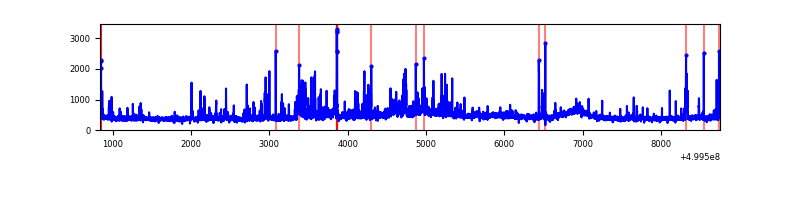 |
Top three noisy pixels from each quadrant. If the there are fewer than three noisy pixels in the level2.evt file, extra rows are filled as -1
| Pixel properties | Quadrant properties | ||||||
|---|---|---|---|---|---|---|---|
| Quadrant | DetID | PixID | Counts | Sigma | Mean | Median | Sigma |
| A | 3 | 14 | 1735949 | 8564.93 | 819 | 799 | 202.6 |
| A | 11 | 3 | 720915 | 3554.59 | 819 | 799 | 202.6 |
| A | 3 | 62 | 255226 | 1255.89 | 819 | 799 | 202.6 |
| B | 4 | 171 | 298642 | 1677.67 | 821 | 792 | 177.5 |
| B | 0 | 213 | 119321 | 667.63 | 821 | 792 | 177.5 |
| B | 10 | 14 | 95764 | 534.94 | 821 | 792 | 177.5 |
| C | 6 | 223 | 421106 | 1896.58 | 803 | 796 | 221.6 |
| C | 13 | 3 | 173123 | 777.6 | 803 | 796 | 221.6 |
| C | 14 | 254 | 130938 | 587.25 | 803 | 796 | 221.6 |
| D | 2 | 37 | 274273 | 1215.57 | 799 | 764 | 225.0 |
| D | 2 | 172 | 88787 | 391.21 | 799 | 764 | 225.0 |
| D | 2 | 120 | 76468 | 336.46 | 799 | 764 | 225.0 |
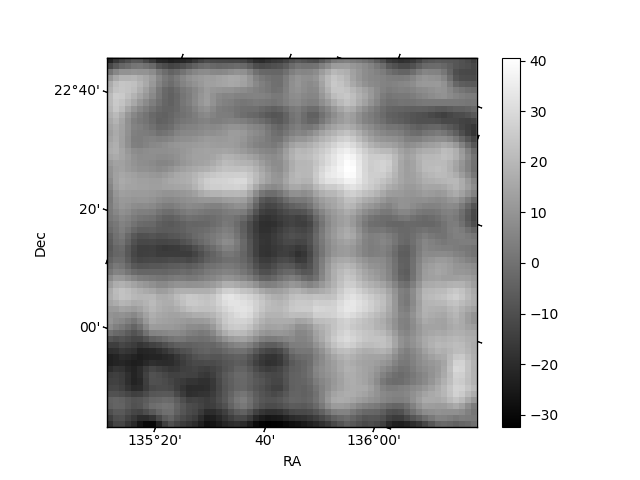
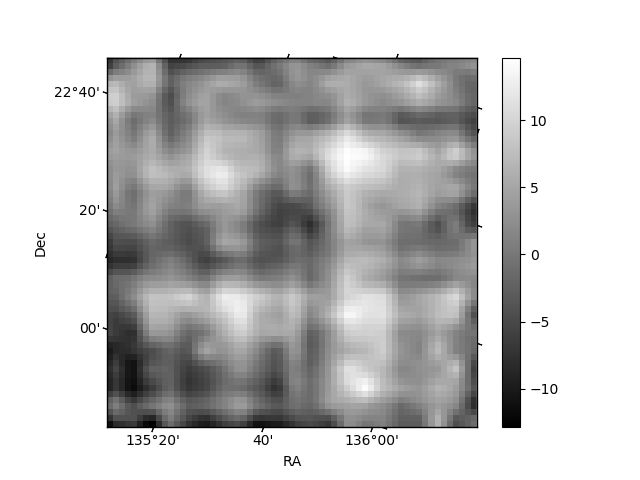
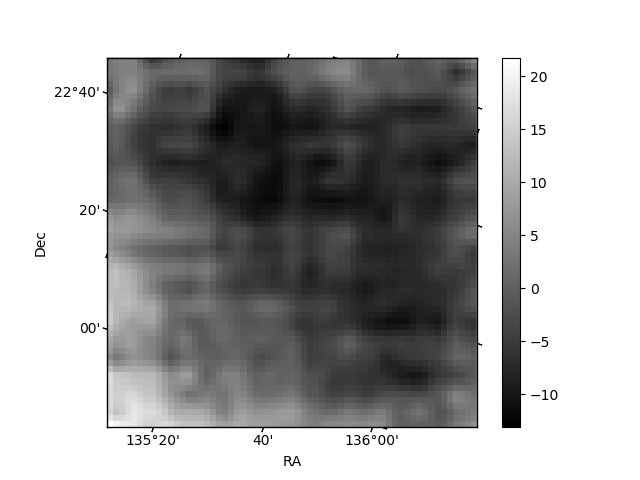
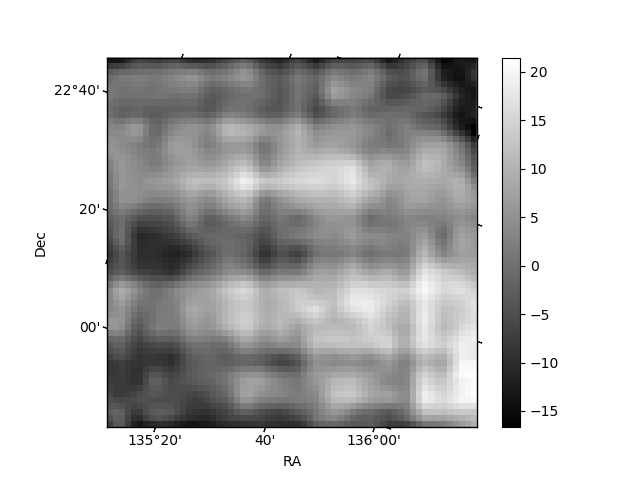
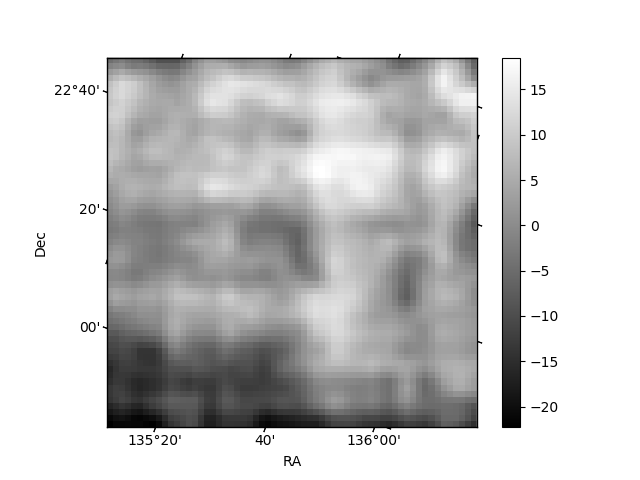
Histogram calculated using DETX and DETY for each event in the final _common_clean file
| Quadrant A | 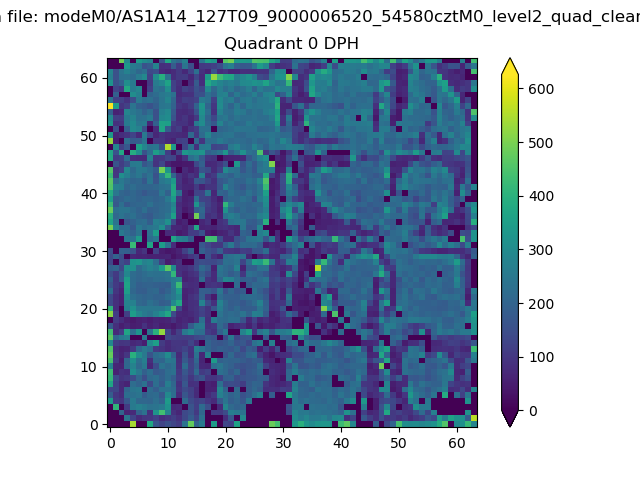 |
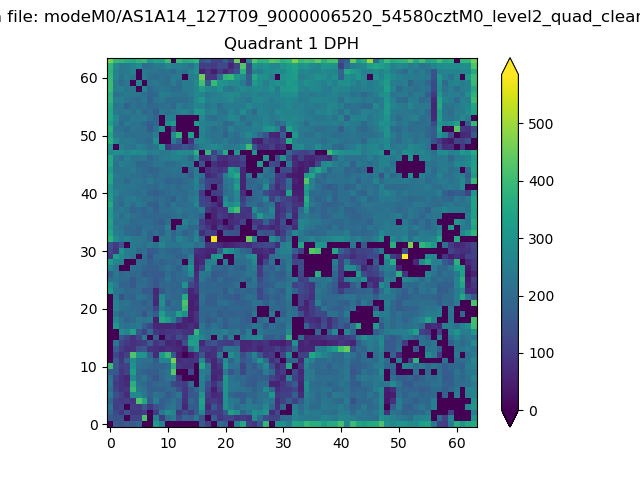 |
Quadrant B |
|---|---|---|---|
| Quadrant D | 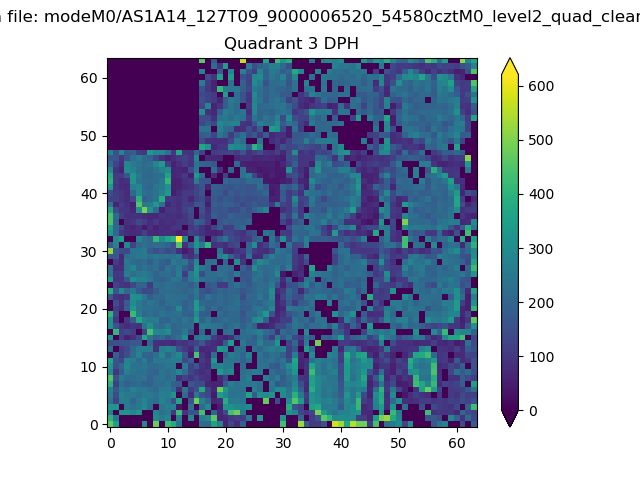 |
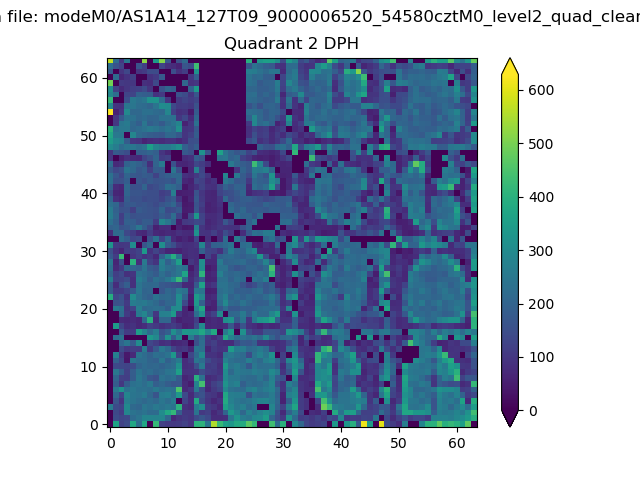 |
Quadrant C |
| Plot type | Count rate plots | Images |
|---|---|---|
| Comparison with Poisson distribution Blue bars denote a histogram of data divided into 1 sec bins. Red curve is a Poisson curve with rate = median count rate of data. |
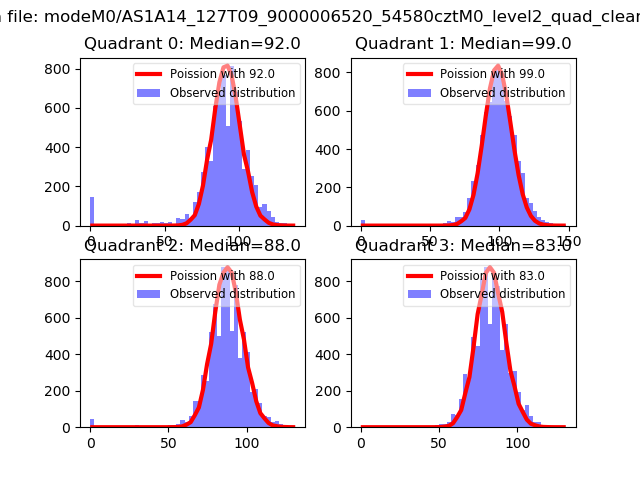 |
 |
| Quadrant-wise count rates Data is divided into 100 sec bins |
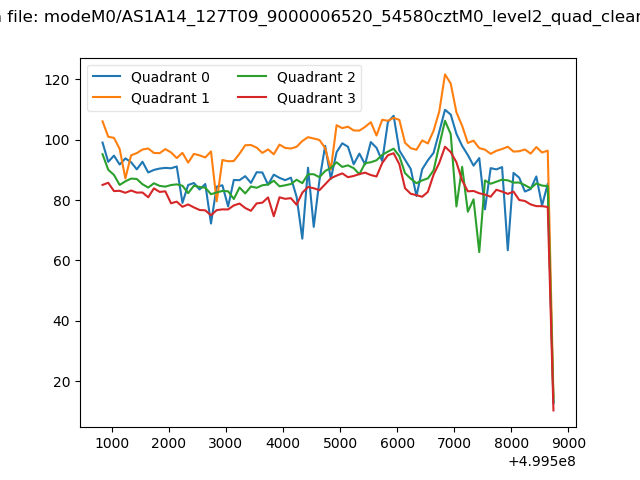 |
|
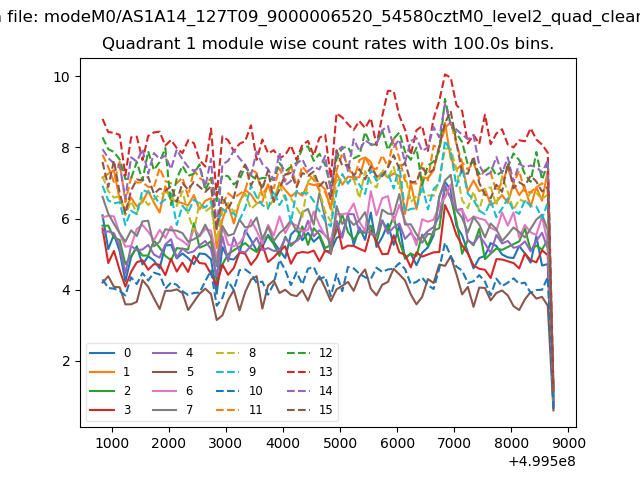
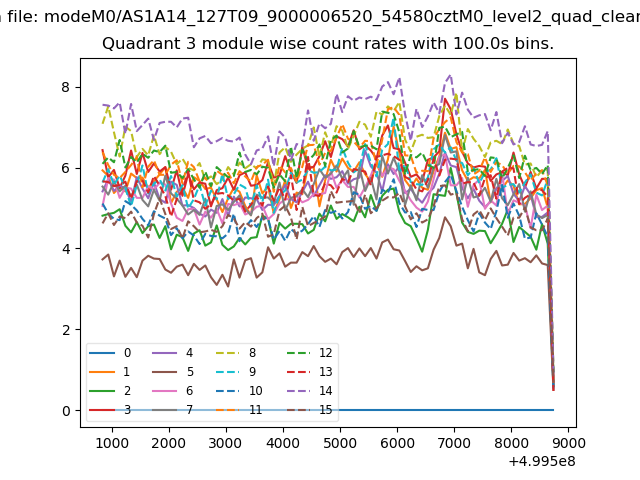
| Module-wise count rates for Quadrant A Data is divided into 100 sec bins |
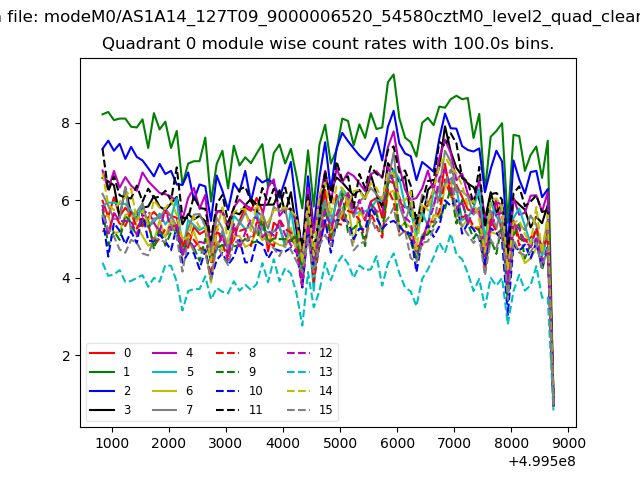 |
 |
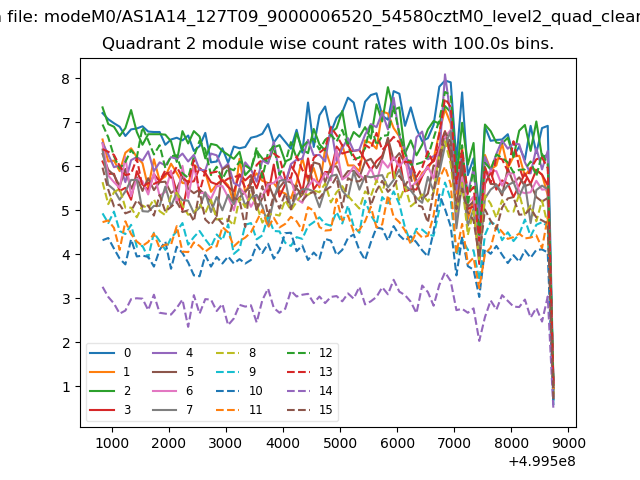
| Module-wise count rates for Quadrant B Data is divided into 100 sec bins |
 |
 |
| Module-wise count rates for Quadrant C Data is divided into 100 sec bins |
 |
 |
| Module-wise count rates for Quadrant D Data is divided into 100 sec bins |
 |
 |
| Parameter | Plot |
|---|---|
| CZT HV Monitor | 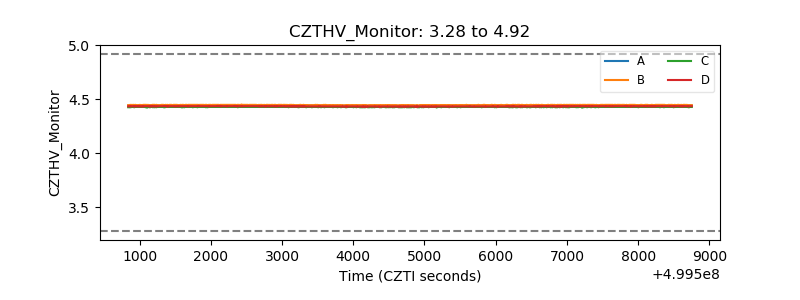 |
| D_VDD | 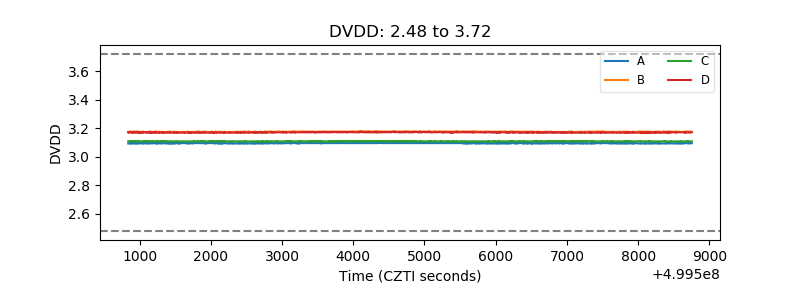 |
| Temperature 1 | 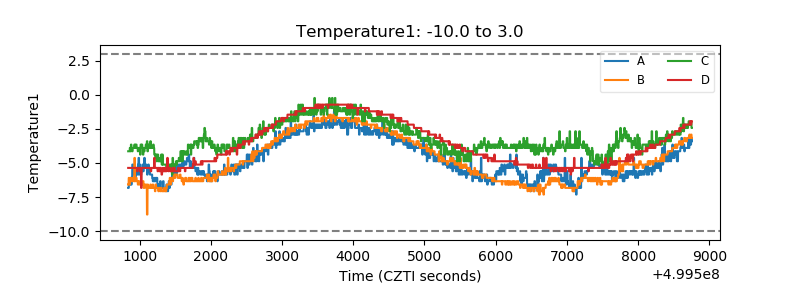 |
| Veto HV Monitor | 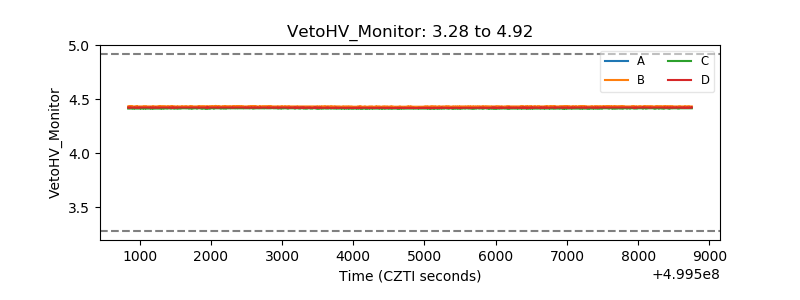 |
| Veto LLD | 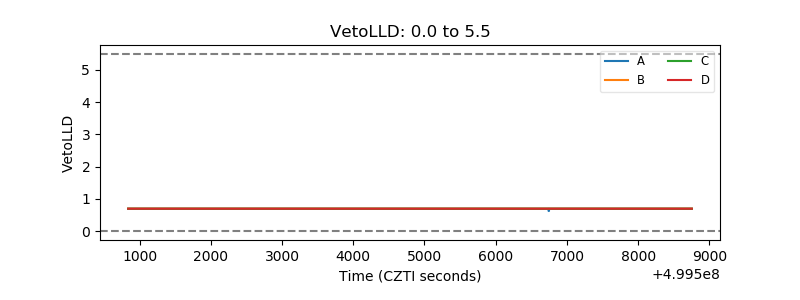 |
| Alpha Counter | 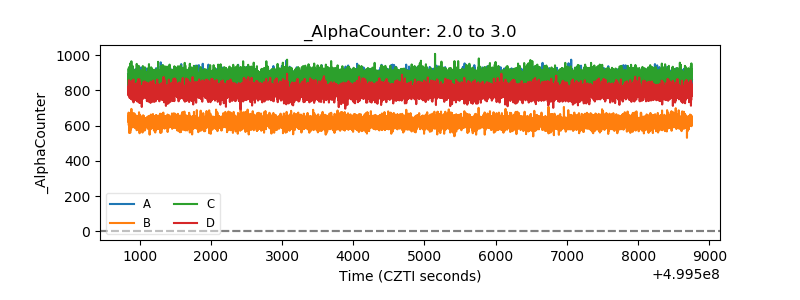 |
| _CPM_Rate | 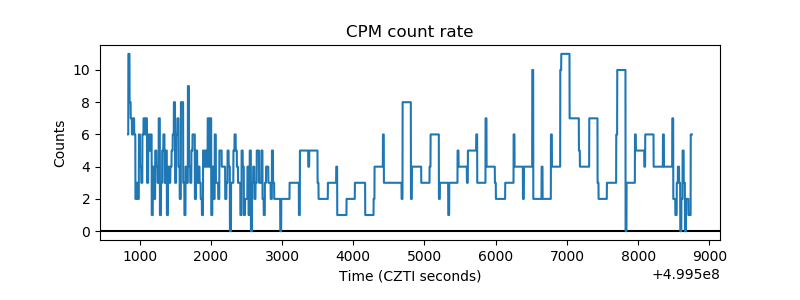 |
| CZT Counter | 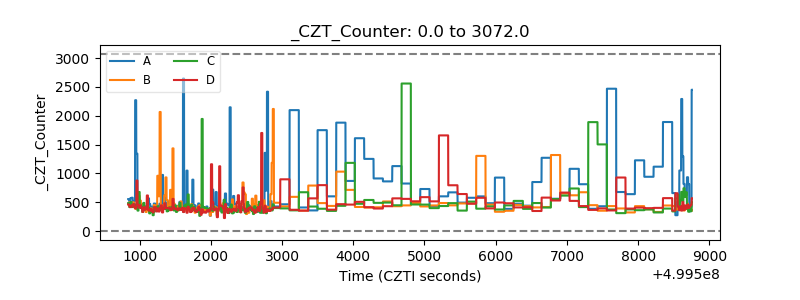 |
| +2.5 Volts monitor |  |
| +5 Volts monitor |  |
| _ROLL_ROT | 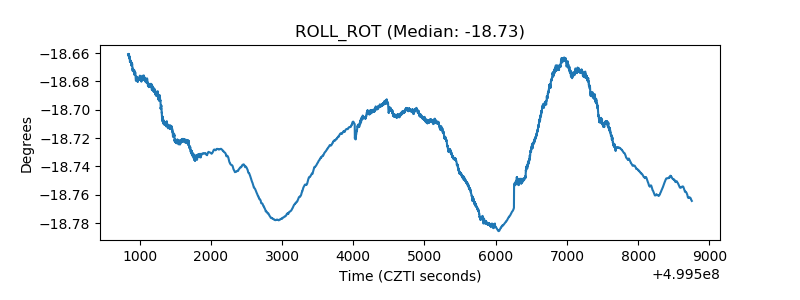 |
| _Roll_DEC | 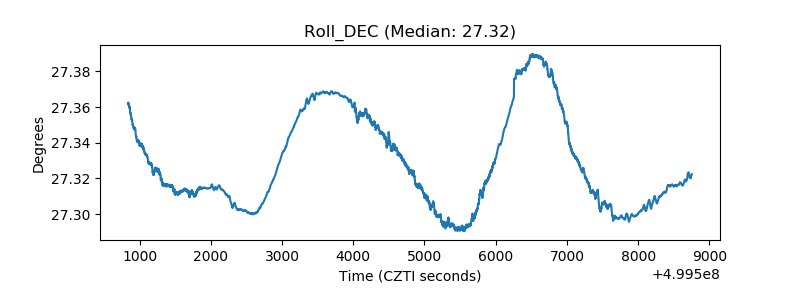 |
| _Roll_RA | 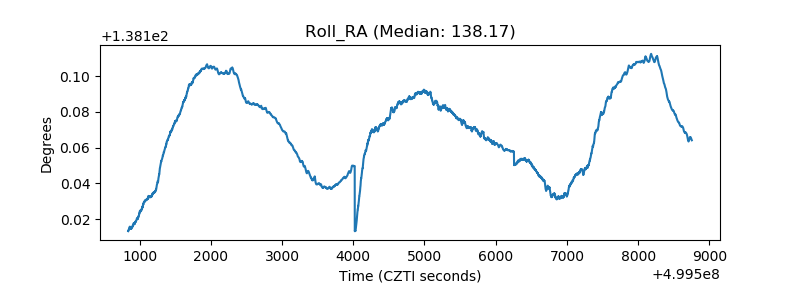 |
| Veto Counter | 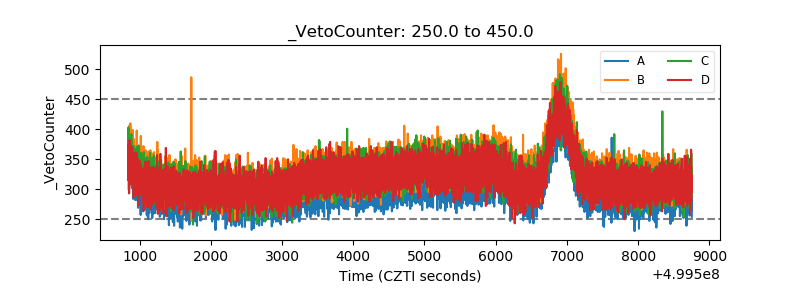 |