| Param | Original file | Final file |
|---|---|---|
| Filename | modeM0/AS1A14_127T09_9000006520_54583cztM0_level2.fits | modeM0/AS1A14_127T09_9000006520_54583cztM0_level2_quad_clean.evt |
| Size (bytes) | 1,403,596,800 | 270,195,840 |
| Size | 1.3 GB | 257.7 MB |
| Events in quadrant A | 15,645,446 | 1,746,058 |
| Events in quadrant B | 9,934,889 | 1,895,401 |
| Events in quadrant C | 11,185,366 | 1,675,154 |
| Events in quadrant D | 13,695,274 | 1,530,961 |
| Mode M0 | |||
|---|---|---|---|
| Quadrant | BADHDUFLAG | Total packets | Discarded packets |
| A | 0 | 59613 | 2 |
| B | 0 | 43168 | 2 |
| C | 0 | 47177 | 2 |
| D | 0 | 54056 | 2 |
| Mode SS | |||
|---|---|---|---|
| Quadrant | BADHDUFLAG | Total packets | Discarded packets |
| A | 0 | 392 | 0 |
| B | 0 | 392 | 0 |
| C | 0 | 392 | 0 |
| D | 0 | 392 | 0 |
| Mode M9 | |||
|---|---|---|---|
| Quadrant | BADHDUFLAG | Total packets | Discarded packets |
| A | 0 | 10 | 0 |
| B | 0 | 10 | 0 |
| C | 0 | 10 | 0 |
| D | 0 | 10 | 0 |
| Quadrant | Total seconds | Saturated seconds | Saturation percentage |
|---|---|---|---|
| A | 19340 | 1431 | 7.399173% |
| B | 19340 | 577 | 2.983454% |
| C | 19341 | 717 | 3.707151% |
| D | 19340 | 1187 | 6.137539% |
Noise dominated data is calculated using 1-second bins in cleaned event files. If a bin has >2000 counts, and if more than 50% of those come from <1% of pixels, then it is considered to be noise-dominated and hence unusable.
| Quadrant | # 1 sec bins | Bins with >0 counts | Bins with >2000 counts | High rate bins dominated by noise | Noise dominated (total time) | Noise dominated (detector-on time) | Marked lightcurve |
|---|---|---|---|---|---|---|---|
| A | 20410 | 19342 | 826 | 826 | 4.05% | 4.27% | 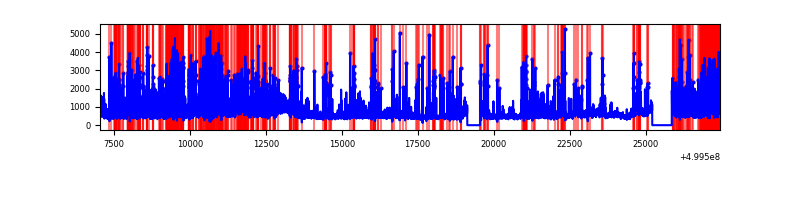 |
| B | 20410 | 19342 | 134 | 134 | 0.66% | 0.69% | 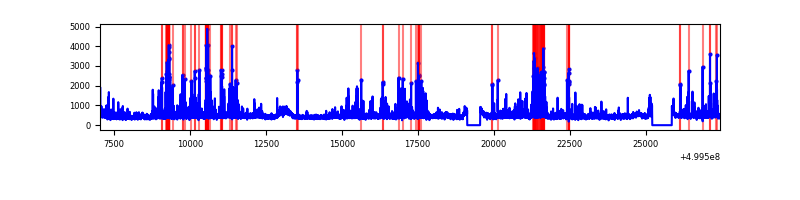 |
| C | 20411 | 19343 | 363 | 363 | 1.78% | 1.88% | 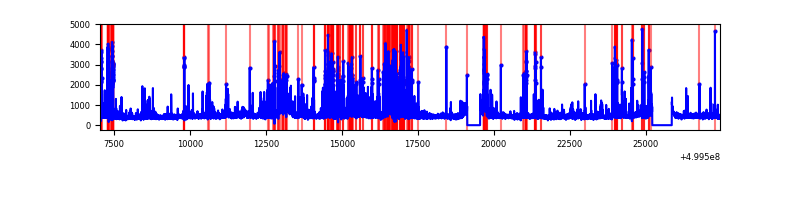 |
| D | 20410 | 19342 | 803 | 803 | 3.93% | 4.15% | 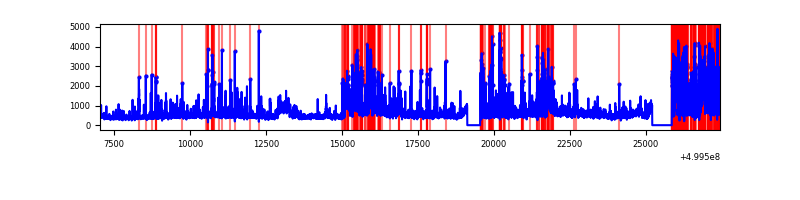 |
Top three noisy pixels from each quadrant. If the there are fewer than three noisy pixels in the level2.evt file, extra rows are filled as -1
| Pixel properties | Quadrant properties | ||||||
|---|---|---|---|---|---|---|---|
| Quadrant | DetID | PixID | Counts | Sigma | Mean | Median | Sigma |
| A | 3 | 14 | 4287907 | 8200.22 | 2095 | 2039 | 522.7 |
| A | 11 | 3 | 1006188 | 1921.26 | 2095 | 2039 | 522.7 |
| A | 14 | 235 | 904043 | 1725.82 | 2095 | 2039 | 522.7 |
| B | 10 | 14 | 464395 | 1029.51 | 2089 | 2015 | 449.1 |
| B | 0 | 213 | 287705 | 636.1 | 2089 | 2015 | 449.1 |
| B | 2 | 249 | 159041 | 349.62 | 2089 | 2015 | 449.1 |
| C | 4 | 5 | 865388 | 1538.11 | 2045 | 2028 | 561.3 |
| C | 15 | 157 | 550294 | 976.76 | 2045 | 2028 | 561.3 |
| C | 13 | 3 | 423957 | 751.68 | 2045 | 2028 | 561.3 |
| D | 7 | 70 | 1187085 | 2081.42 | 2017 | 1926 | 569.4 |
| D | 15 | 94 | 1085285 | 1902.63 | 2017 | 1926 | 569.4 |
| D | 3 | 12 | 1045228 | 1832.28 | 2017 | 1926 | 569.4 |
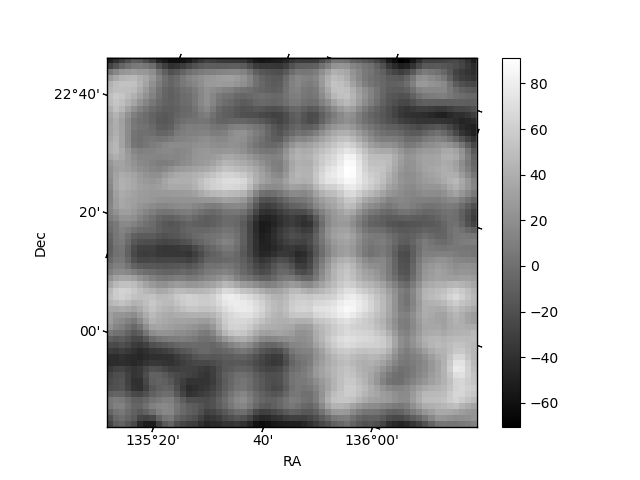
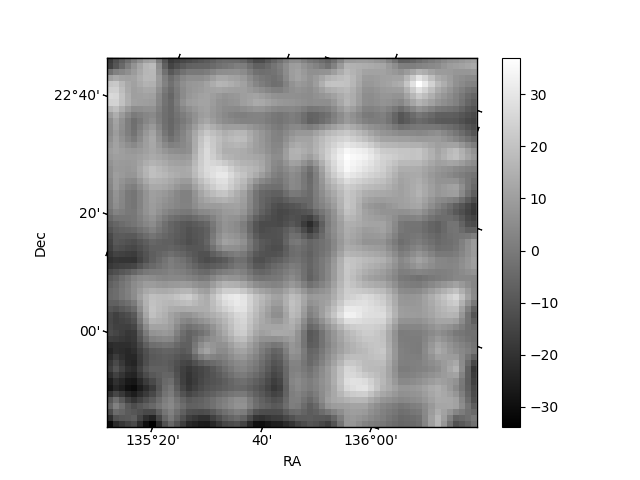
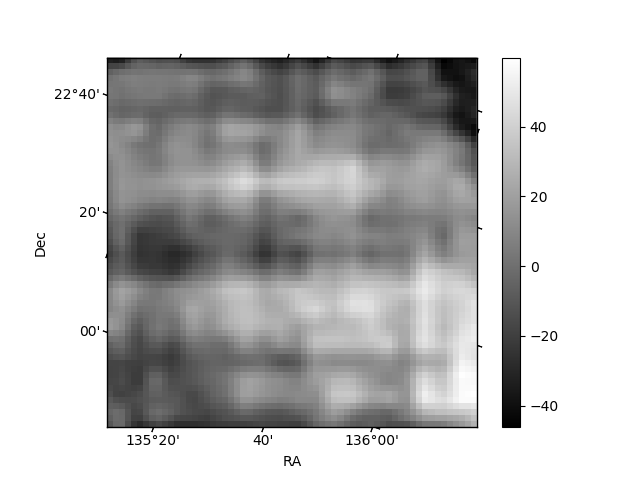
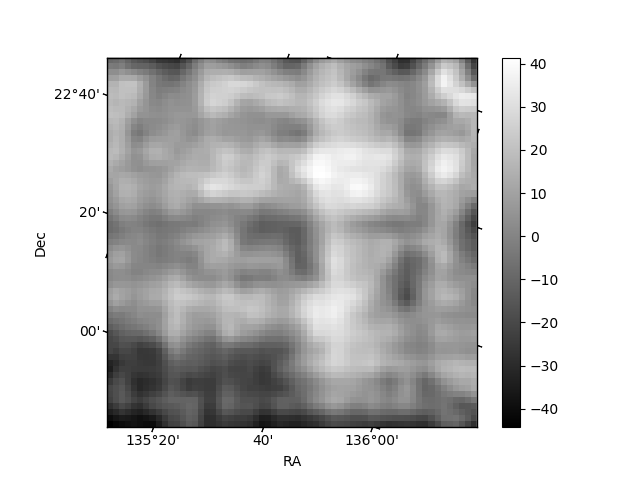
Histogram calculated using DETX and DETY for each event in the final _common_clean file
| Quadrant A | 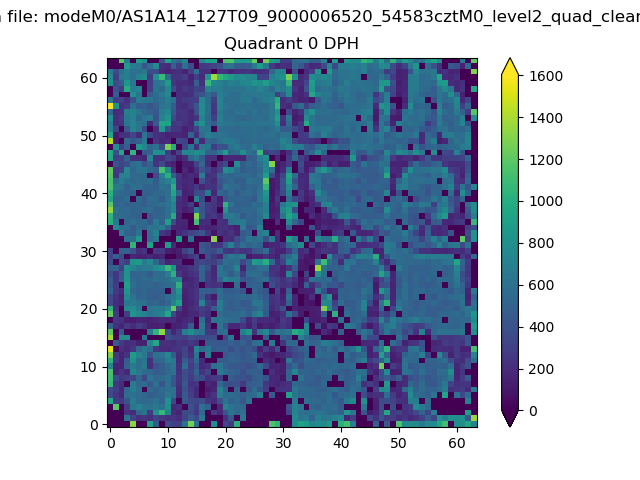 |
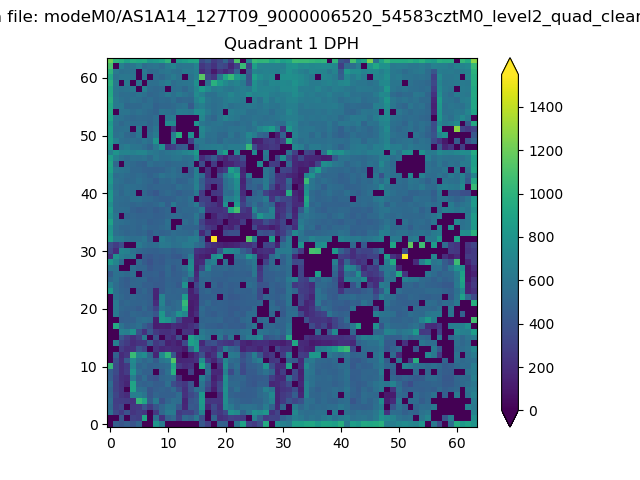 |
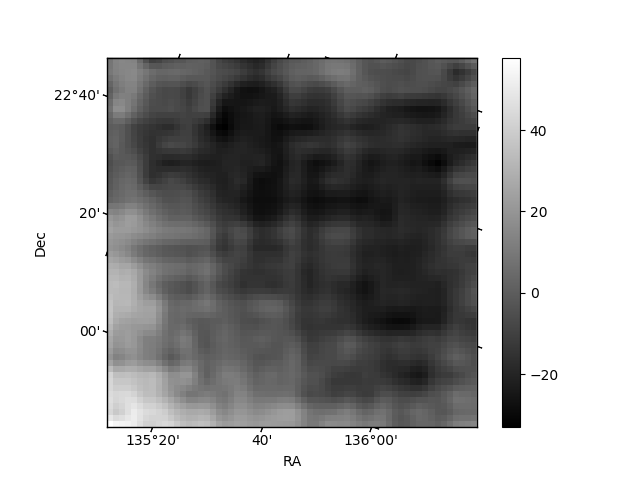
Quadrant B |
|---|---|---|---|
| Quadrant D | 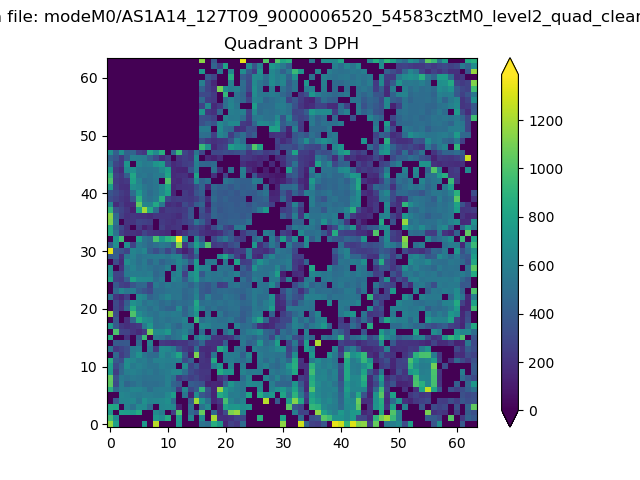 |
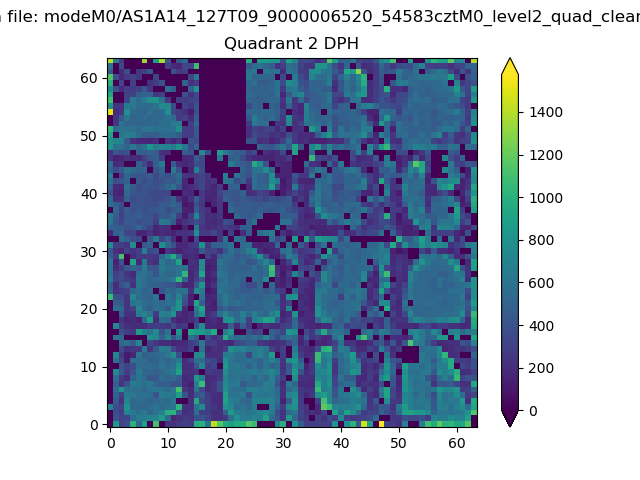 |
Quadrant C |
| Plot type | Count rate plots | Images |
|---|---|---|
| Comparison with Poisson distribution Blue bars denote a histogram of data divided into 1 sec bins. Red curve is a Poisson curve with rate = median count rate of data. |
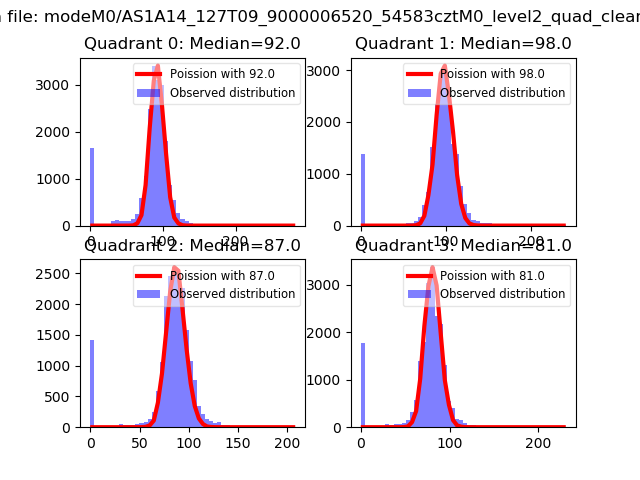 |
 |
| Quadrant-wise count rates Data is divided into 100 sec bins |
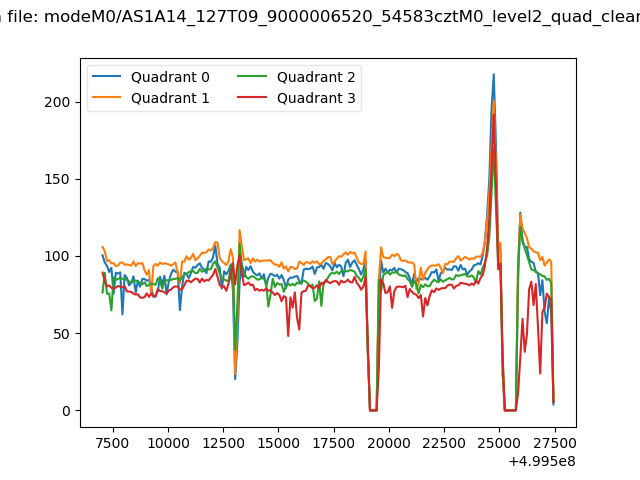 |
|
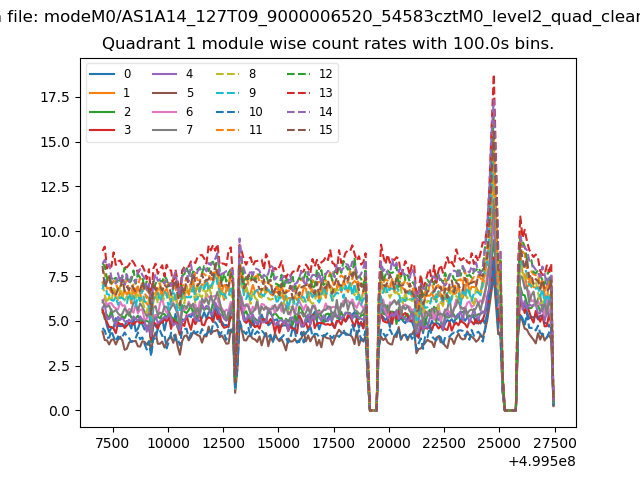
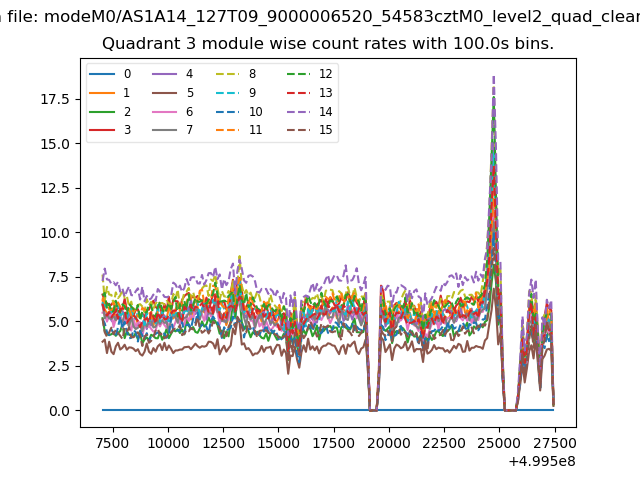
| Module-wise count rates for Quadrant A Data is divided into 100 sec bins |
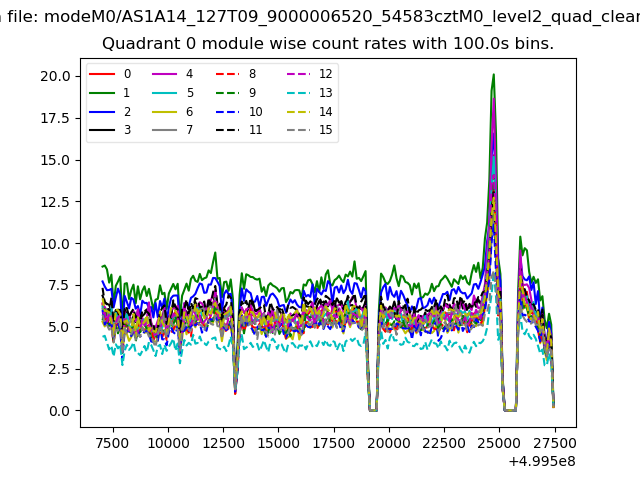 |
 |
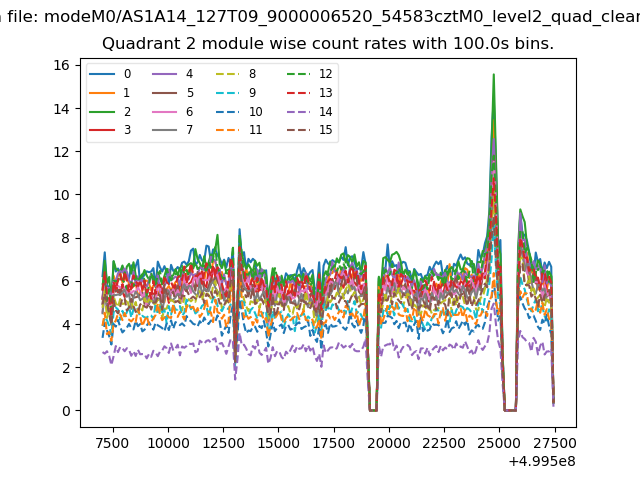
| Module-wise count rates for Quadrant B Data is divided into 100 sec bins |
 |
 |
| Module-wise count rates for Quadrant C Data is divided into 100 sec bins |
 |
 |
| Module-wise count rates for Quadrant D Data is divided into 100 sec bins |
 |
 |
| Parameter | Plot |
|---|---|
| CZT HV Monitor | 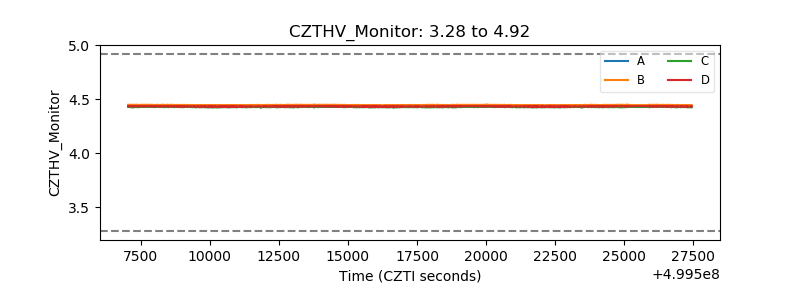 |
| D_VDD | 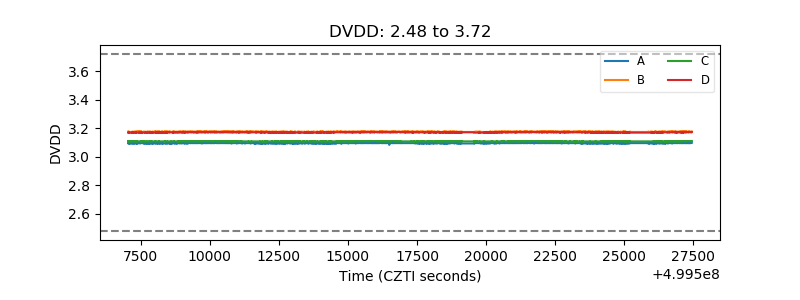 |
| Temperature 1 | 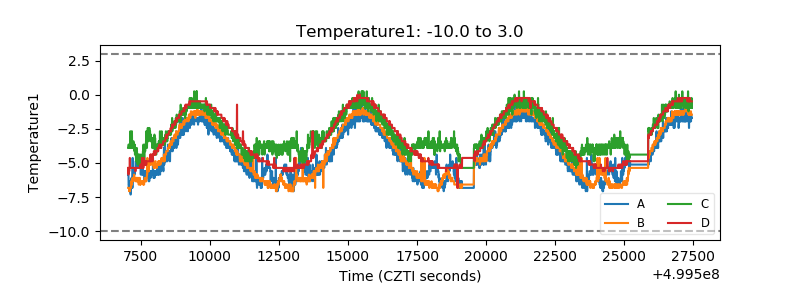 |
| Veto HV Monitor | 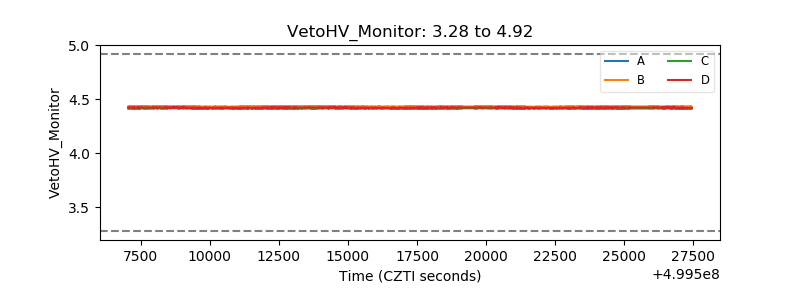 |
| Veto LLD | 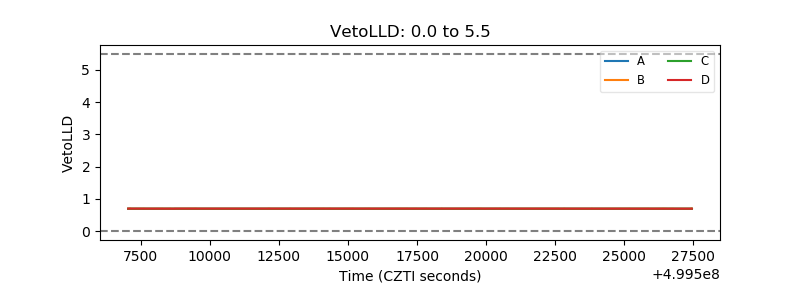 |
| Alpha Counter | 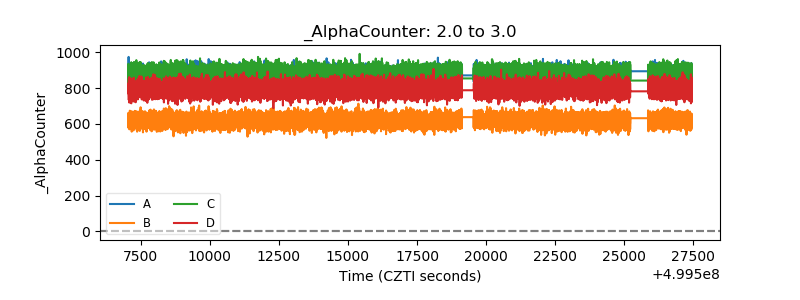 |
| _CPM_Rate | 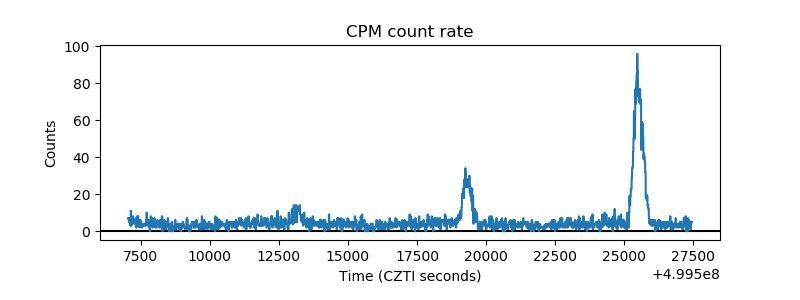 |
| CZT Counter | 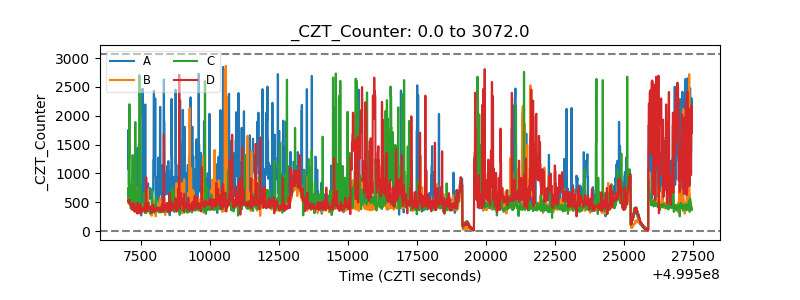 |
| +2.5 Volts monitor |  |
| +5 Volts monitor |  |
| _ROLL_ROT | 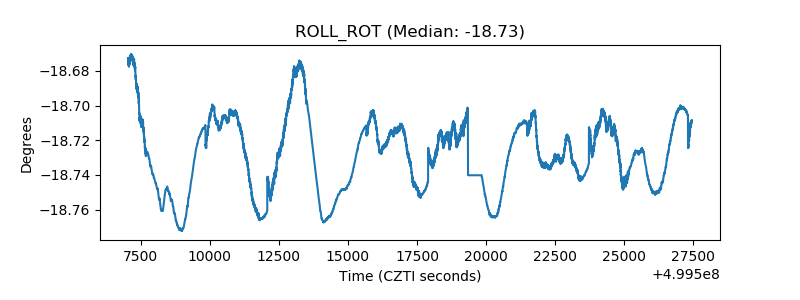 |
| _Roll_DEC | 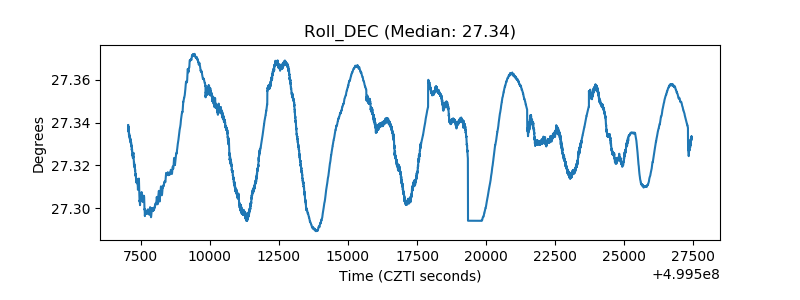 |
| _Roll_RA | 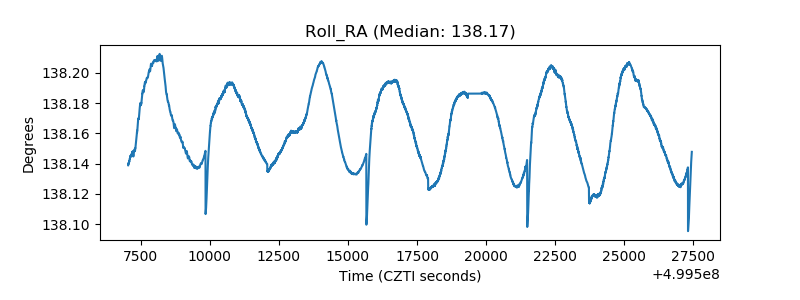 |
| Veto Counter | 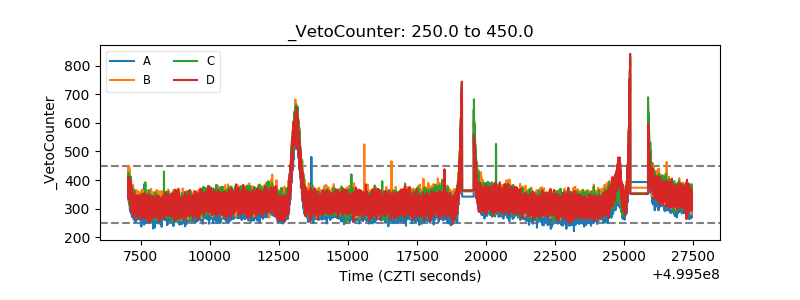 |