| Param | Original file | Final file |
|---|---|---|
| Filename | modeM0/AS1A14_127T09_9000006520_54584cztM0_level2.fits | modeM0/AS1A14_127T09_9000006520_54584cztM0_level2_quad_clean.evt |
| Size (bytes) | 726,837,120 | 90,760,320 |
| Size | 693.2 MB | 86.6 MB |
| Events in quadrant A | 8,523,028 | 572,095 |
| Events in quadrant B | 3,744,841 | 691,586 |
| Events in quadrant C | 3,273,368 | 617,882 |
| Events in quadrant D | 10,831,572 | 387,195 |
| Mode M0 | |||
|---|---|---|---|
| Quadrant | BADHDUFLAG | Total packets | Discarded packets |
| A | 0 | 30082 | 1 |
| B | 0 | 15856 | 1 |
| C | 0 | 14757 | 1 |
| D | 0 | 36940 | 1 |
| Mode SS | |||
|---|---|---|---|
| Quadrant | BADHDUFLAG | Total packets | Discarded packets |
| A | 0 | 140 | 0 |
| B | 0 | 140 | 0 |
| C | 0 | 140 | 0 |
| D | 0 | 140 | 0 |
| Mode M9 | |||
|---|---|---|---|
| Quadrant | BADHDUFLAG | Total packets | Discarded packets |
| A | 0 | 8 | 0 |
| B | 0 | 8 | 0 |
| C | 0 | 8 | 0 |
| D | 0 | 8 | 0 |
| Quadrant | Total seconds | Saturated seconds | Saturation percentage |
|---|---|---|---|
| A | 6870 | 1429 | 20.800582% |
| B | 6871 | 167 | 2.430505% |
| C | 6871 | 114 | 1.659147% |
| D | 6871 | 2549 | 37.097948% |
Noise dominated data is calculated using 1-second bins in cleaned event files. If a bin has >2000 counts, and if more than 50% of those come from <1% of pixels, then it is considered to be noise-dominated and hence unusable.
| Quadrant | # 1 sec bins | Bins with >0 counts | Bins with >2000 counts | High rate bins dominated by noise | Noise dominated (total time) | Noise dominated (detector-on time) | Marked lightcurve |
|---|---|---|---|---|---|---|---|
| A | 7695 | 6871 | 1200 | 1200 | 15.59% | 17.46% | 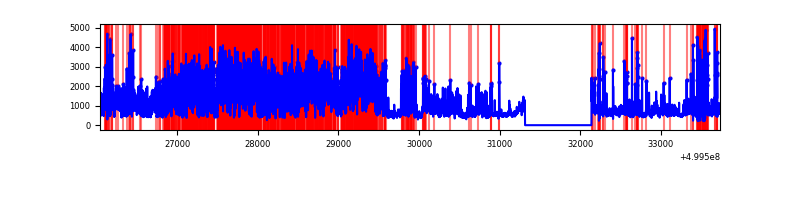 |
| B | 7696 | 6872 | 61 | 61 | 0.79% | 0.89% | 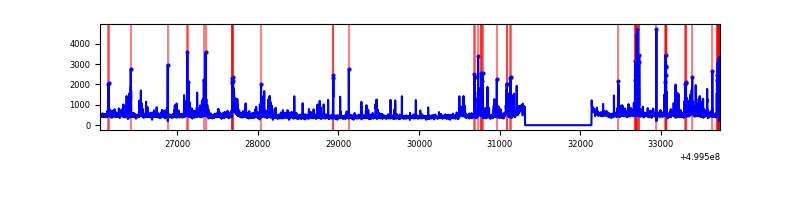 |
| C | 7696 | 6872 | 34 | 34 | 0.44% | 0.49% | 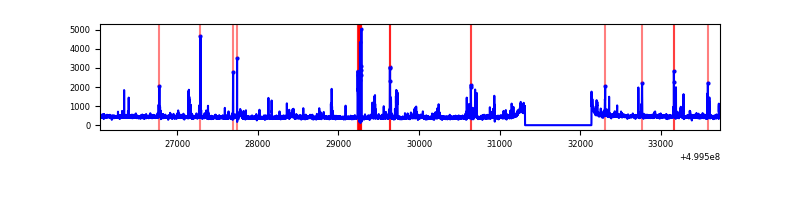 |
| D | 7696 | 6871 | 2474 | 2474 | 32.15% | 36.01% | 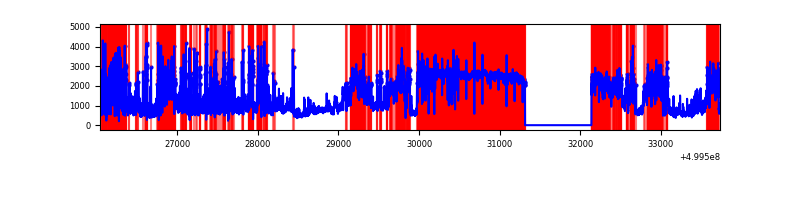 |
Top three noisy pixels from each quadrant. If the there are fewer than three noisy pixels in the level2.evt file, extra rows are filled as -1
| Pixel properties | Quadrant properties | ||||||
|---|---|---|---|---|---|---|---|
| Quadrant | DetID | PixID | Counts | Sigma | Mean | Median | Sigma |
| A | 3 | 14 | 4728399 | 26393.87 | 722 | 703 | 179.1 |
| A | 11 | 3 | 504233 | 2811.12 | 722 | 703 | 179.1 |
| A | 14 | 235 | 250512 | 1394.64 | 722 | 703 | 179.1 |
| B | 8 | 234 | 317261 | 1964.44 | 747 | 722 | 161.1 |
| B | 10 | 14 | 189629 | 1172.35 | 747 | 722 | 161.1 |
| B | 2 | 249 | 54135 | 331.48 | 747 | 722 | 161.1 |
| C | 4 | 5 | 127612 | 631.57 | 737 | 731 | 200.9 |
| C | 12 | 250 | 57198 | 281.07 | 737 | 731 | 200.9 |
| C | 13 | 3 | 39754 | 194.24 | 737 | 731 | 200.9 |
| D | 7 | 70 | 6835611 | 40955.04 | 583 | 555 | 166.9 |
| D | 15 | 94 | 495674 | 2966.71 | 583 | 555 | 166.9 |
| D | 3 | 12 | 213995 | 1278.91 | 583 | 555 | 166.9 |
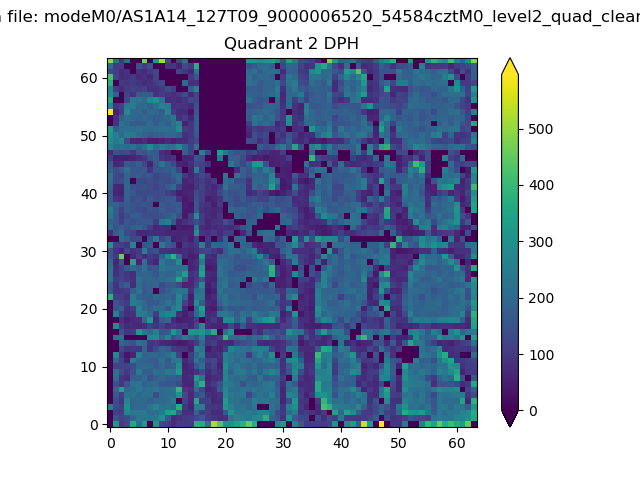
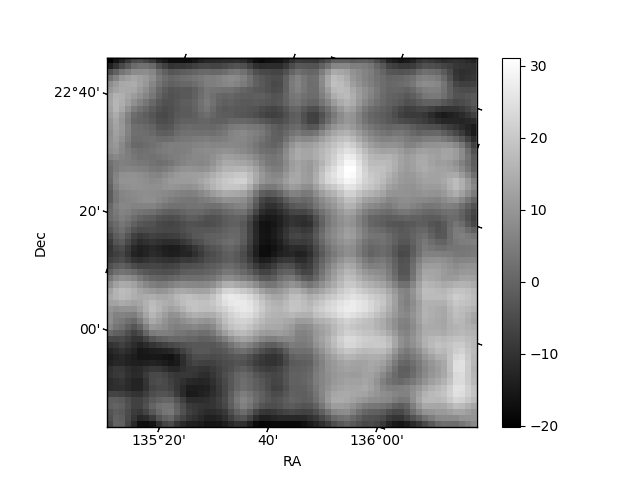
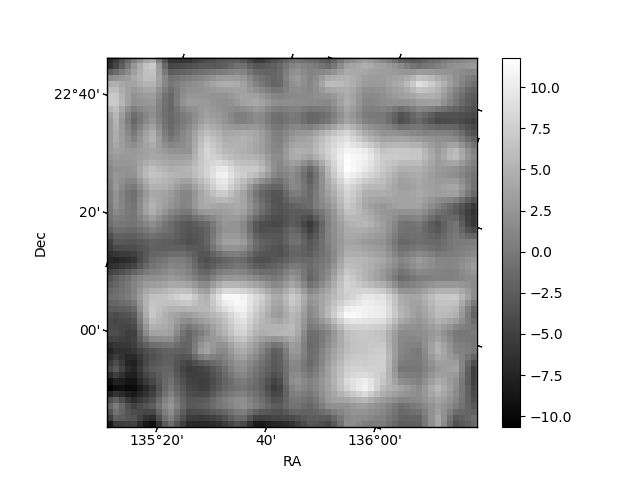
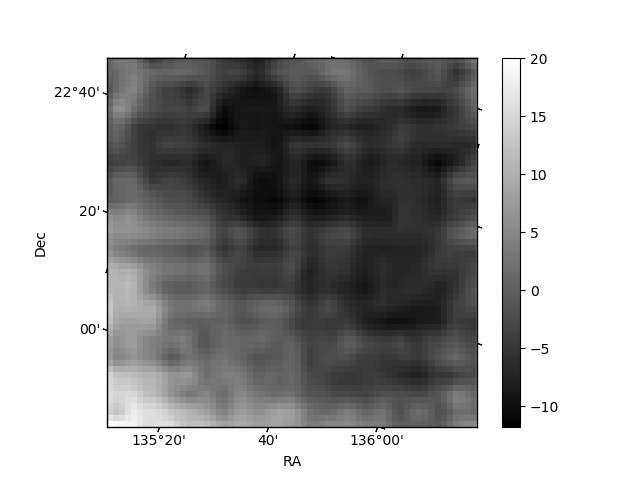
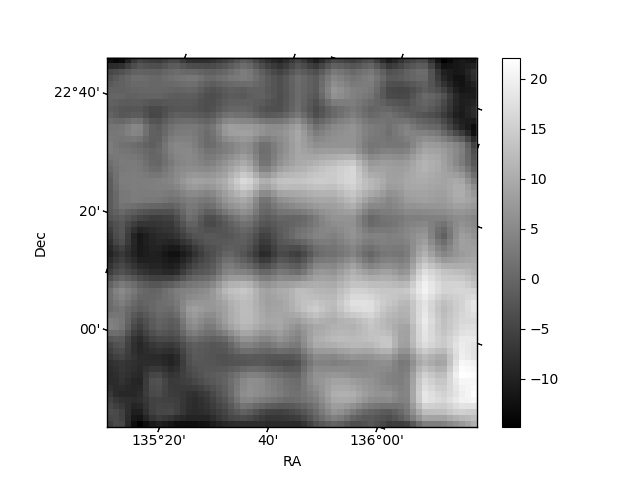
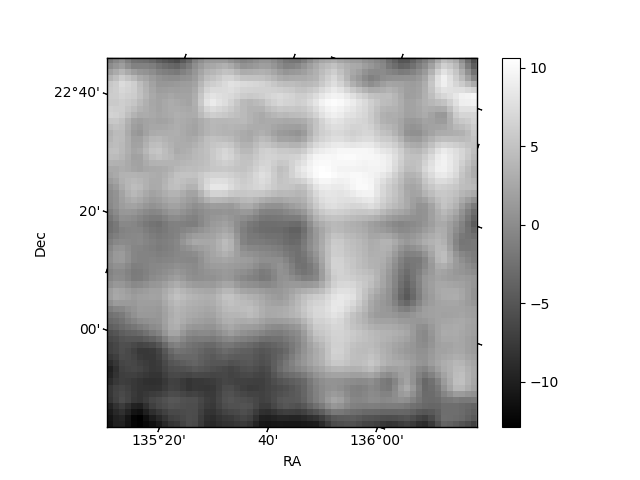
Histogram calculated using DETX and DETY for each event in the final _common_clean file
| Quadrant A | 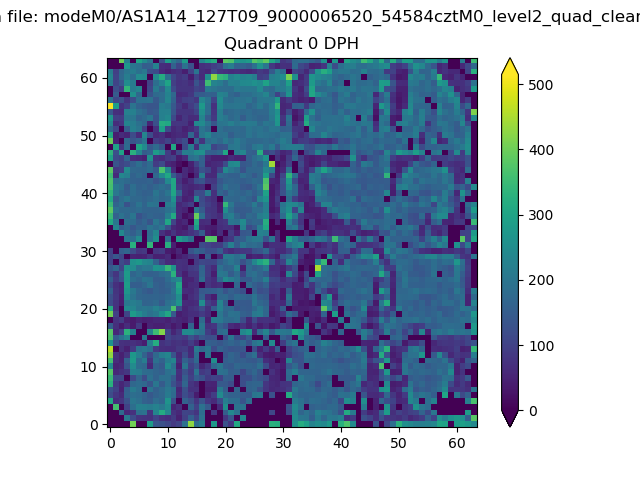 |
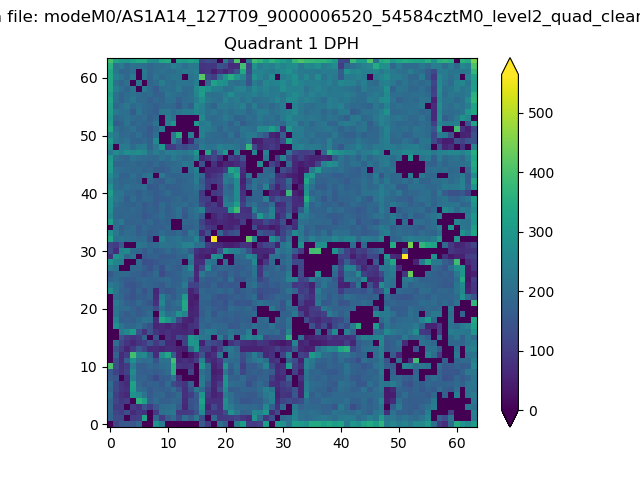 |
Quadrant B |
|---|---|---|---|
| Quadrant D | 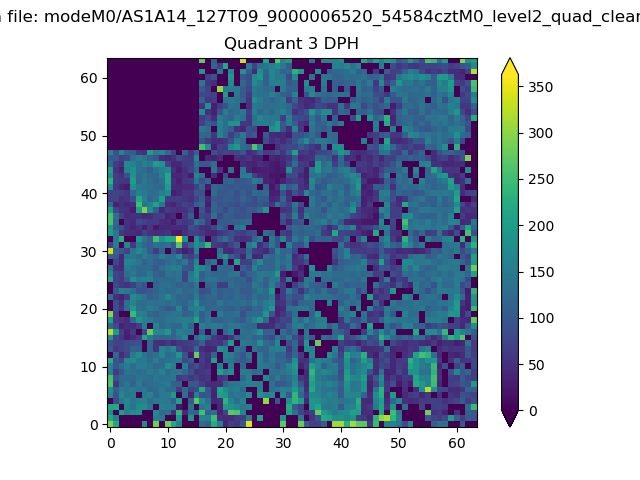 |
 |
Quadrant C |
| Plot type | Count rate plots | Images |
|---|---|---|
| Comparison with Poisson distribution Blue bars denote a histogram of data divided into 1 sec bins. Red curve is a Poisson curve with rate = median count rate of data. |
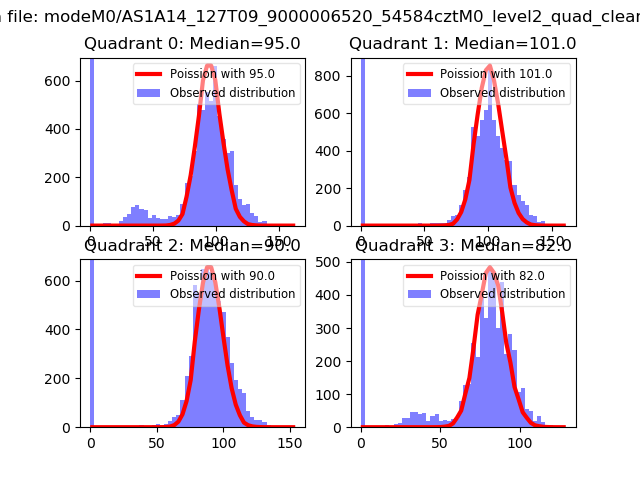 |
 |
| Quadrant-wise count rates Data is divided into 100 sec bins |
 |
|
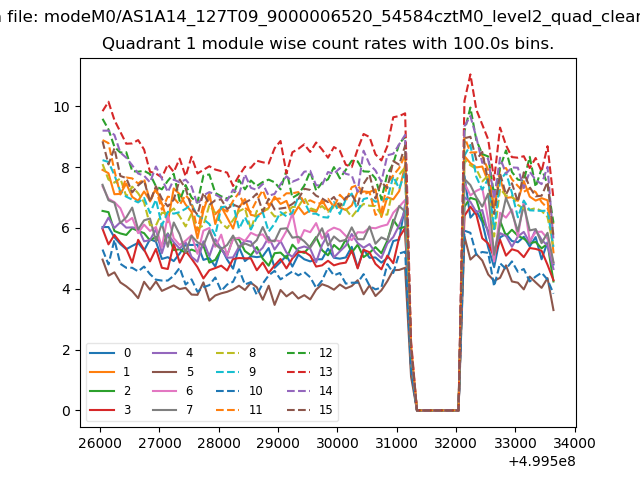
| Module-wise count rates for Quadrant A Data is divided into 100 sec bins |
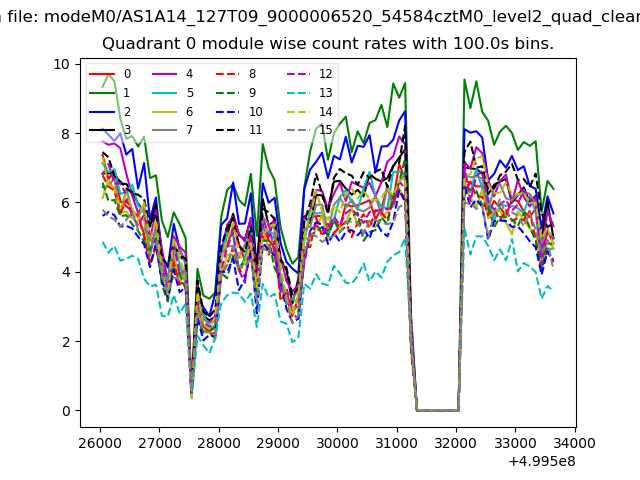 |
 |
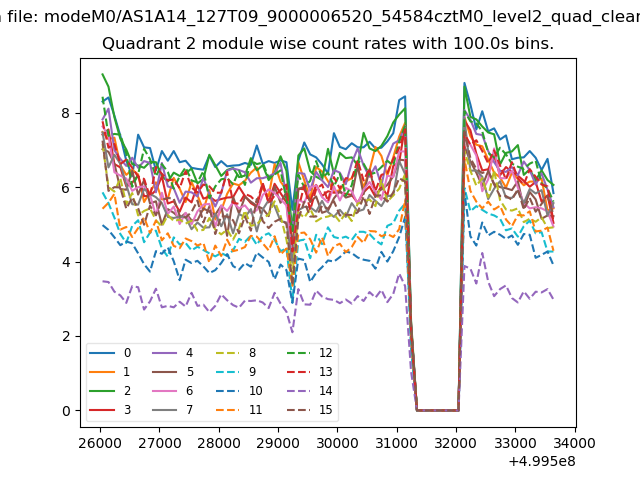
| Module-wise count rates for Quadrant B Data is divided into 100 sec bins |
 |
 |
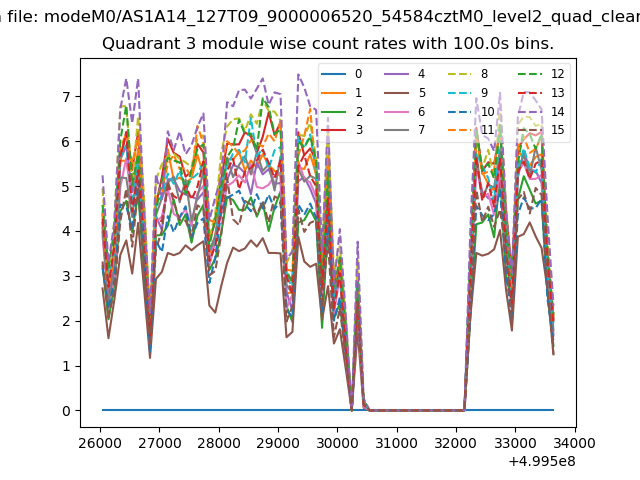
| Module-wise count rates for Quadrant C Data is divided into 100 sec bins |
 |
 |
| Module-wise count rates for Quadrant D Data is divided into 100 sec bins |
 |
 |
| Parameter | Plot |
|---|---|
| CZT HV Monitor | 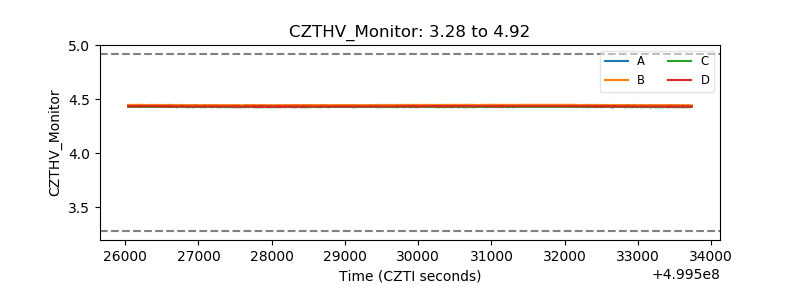 |
| D_VDD | 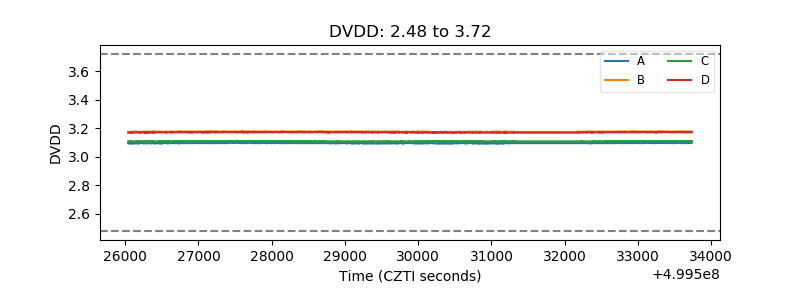 |
| Temperature 1 | 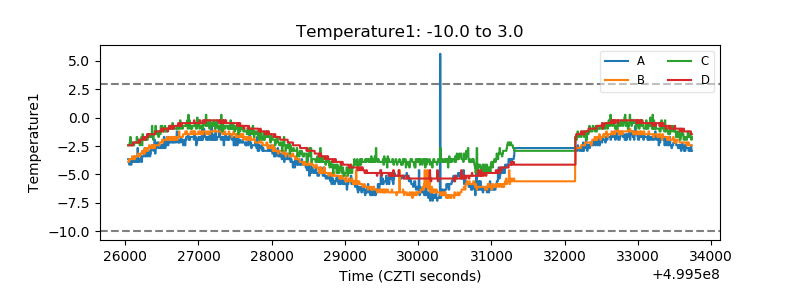 |
| Veto HV Monitor | 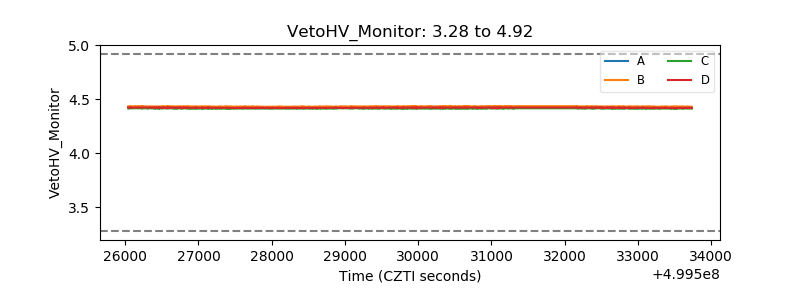 |
| Veto LLD | 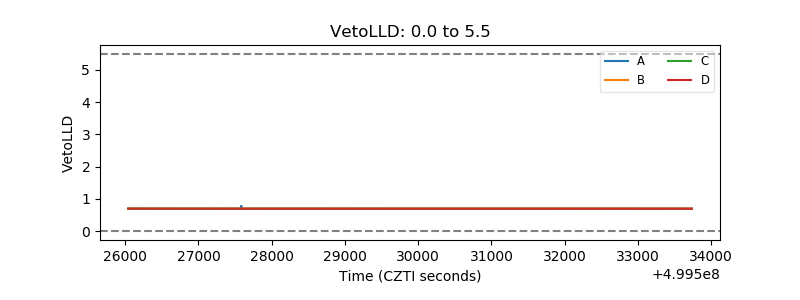 |
| Alpha Counter | 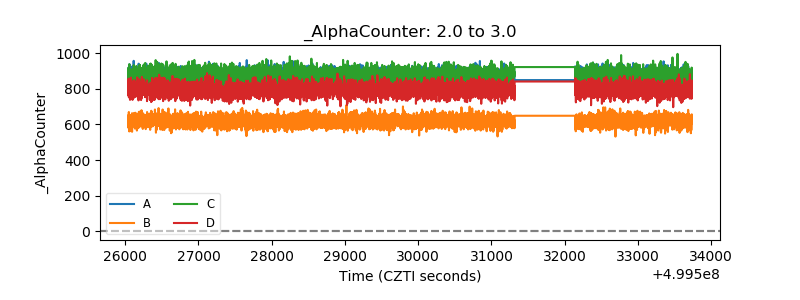 |
| _CPM_Rate | 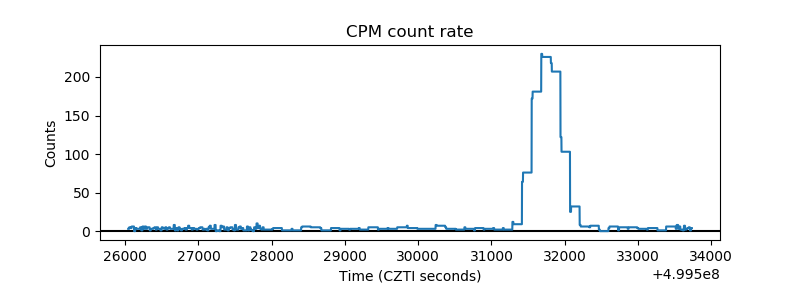 |
| CZT Counter | 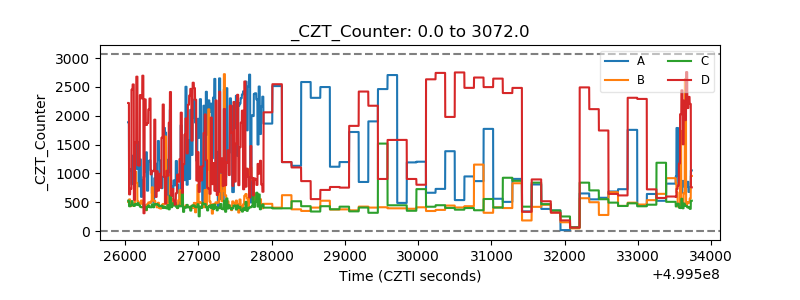 |
| +2.5 Volts monitor | 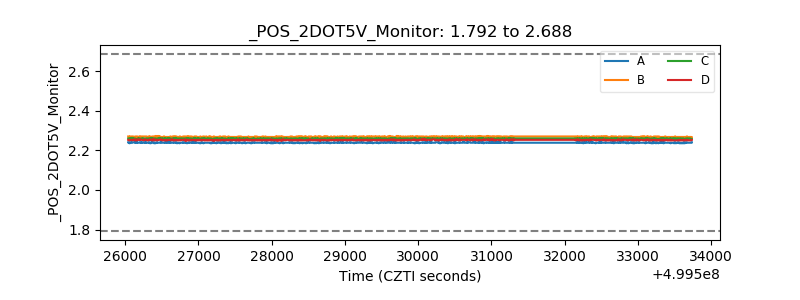 |
| +5 Volts monitor | 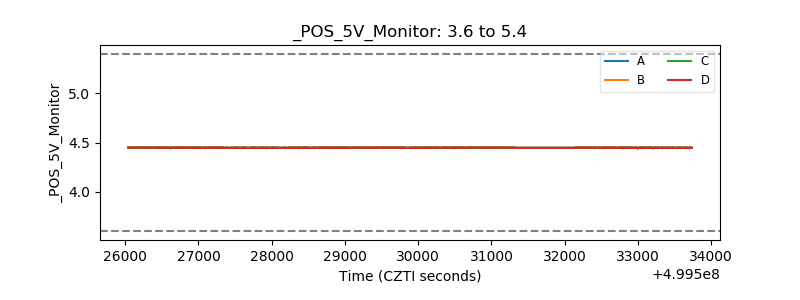 |
| _ROLL_ROT | 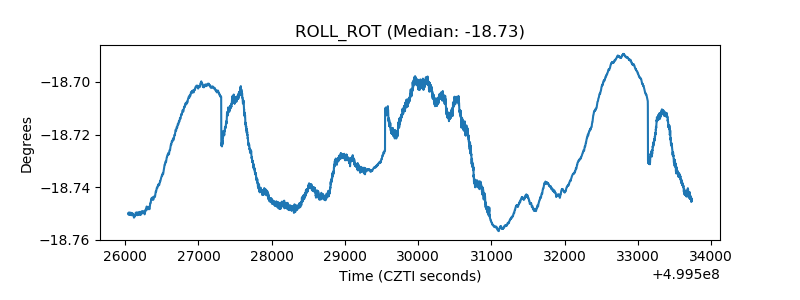 |
| _Roll_DEC | 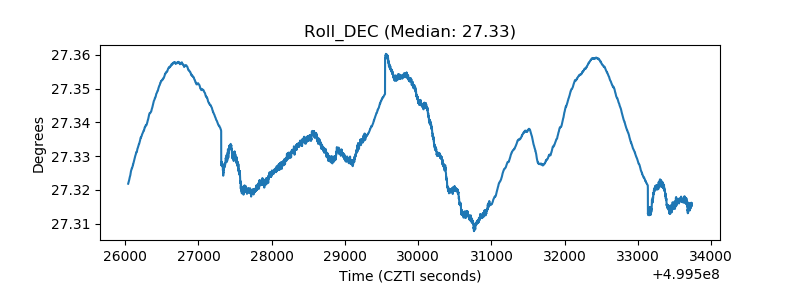 |
| _Roll_RA | 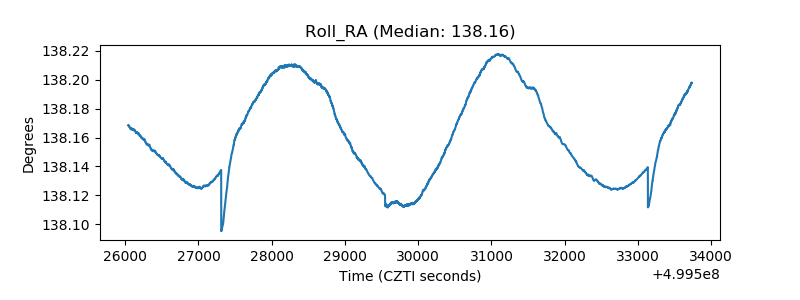 |
| Veto Counter | 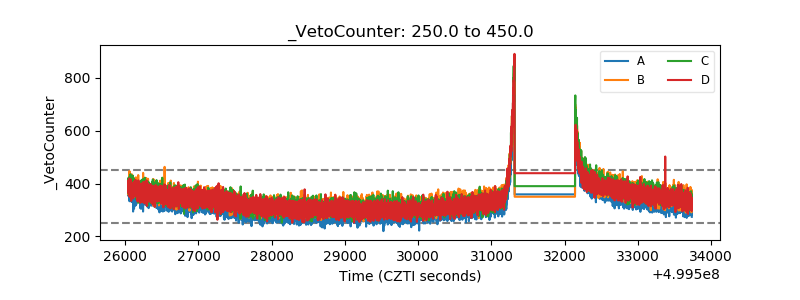 |