| Param | Original file | Final file |
|---|---|---|
| Filename | modeM0/AS1A14_127T09_9000006520_54586cztM0_level2.fits | modeM0/AS1A14_127T09_9000006520_54586cztM0_level2_quad_clean.evt |
| Size (bytes) | 510,940,800 | 93,911,040 |
| Size | 487.3 MB | 89.6 MB |
| Events in quadrant A | 4,707,224 | 633,378 |
| Events in quadrant B | 3,794,517 | 667,203 |
| Events in quadrant C | 3,373,643 | 597,957 |
| Events in quadrant D | 6,542,879 | 499,326 |
| Mode M0 | |||
|---|---|---|---|
| Quadrant | BADHDUFLAG | Total packets | Discarded packets |
| A | 0 | 18389 | 1 |
| B | 0 | 15792 | 1 |
| C | 0 | 14571 | 1 |
| D | 0 | 23879 | 1 |
| Mode SS | |||
|---|---|---|---|
| Quadrant | BADHDUFLAG | Total packets | Discarded packets |
| A | 0 | 132 | 0 |
| B | 0 | 132 | 0 |
| C | 0 | 132 | 0 |
| D | 0 | 132 | 0 |
| Mode M9 | |||
|---|---|---|---|
| Quadrant | BADHDUFLAG | Total packets | Discarded packets |
| A | 0 | 10 | 0 |
| B | 0 | 10 | 0 |
| C | 0 | 10 | 0 |
| D | 0 | 10 | 0 |
| Quadrant | Total seconds | Saturated seconds | Saturation percentage |
|---|---|---|---|
| A | 6378 | 251 | 3.935403% |
| B | 6378 | 224 | 3.512073% |
| C | 6379 | 142 | 2.226054% |
| D | 6379 | 887 | 13.905001% |
Noise dominated data is calculated using 1-second bins in cleaned event files. If a bin has >2000 counts, and if more than 50% of those come from <1% of pixels, then it is considered to be noise-dominated and hence unusable.
| Quadrant | # 1 sec bins | Bins with >0 counts | Bins with >2000 counts | High rate bins dominated by noise | Noise dominated (total time) | Noise dominated (detector-on time) | Marked lightcurve |
|---|---|---|---|---|---|---|---|
| A | 7413 | 6379 | 163 | 163 | 2.20% | 2.56% | 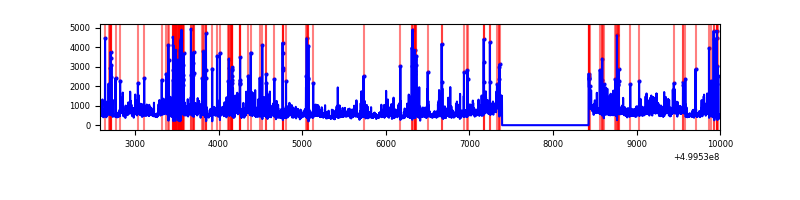 |
| B | 7413 | 6379 | 114 | 114 | 1.54% | 1.79% | 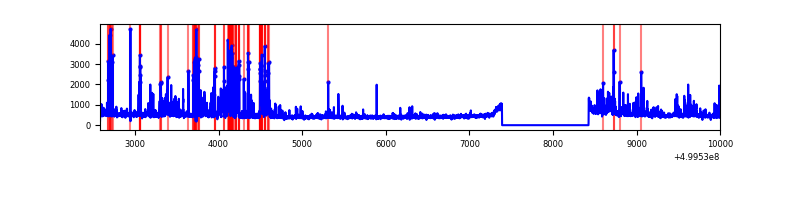 |
| C | 7414 | 6380 | 102 | 102 | 1.38% | 1.60% | 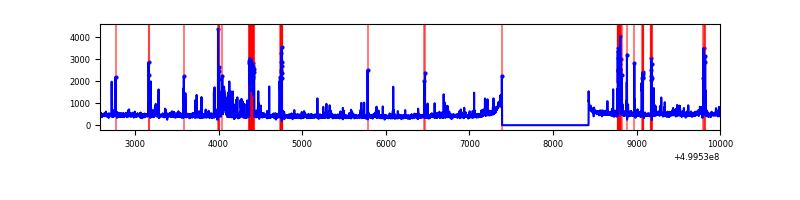 |
| D | 7414 | 6380 | 800 | 800 | 10.79% | 12.54% | 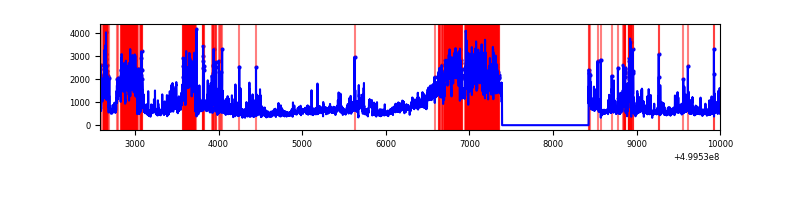 |
Top three noisy pixels from each quadrant. If the there are fewer than three noisy pixels in the level2.evt file, extra rows are filled as -1
| Pixel properties | Quadrant properties | ||||||
|---|---|---|---|---|---|---|---|
| Quadrant | DetID | PixID | Counts | Sigma | Mean | Median | Sigma |
| A | 3 | 14 | 1124620 | 6343.8 | 704 | 687 | 177.2 |
| A | 11 | 3 | 525174 | 2960.36 | 704 | 687 | 177.2 |
| A | 4 | 249 | 130801 | 734.4 | 704 | 687 | 177.2 |
| B | 8 | 234 | 279393 | 1860.42 | 695 | 670 | 149.8 |
| B | 10 | 14 | 206236 | 1372.11 | 695 | 670 | 149.8 |
| B | 9 | 251 | 164286 | 1092.1 | 695 | 670 | 149.8 |
| C | 4 | 5 | 310282 | 1623.97 | 688 | 681 | 190.6 |
| C | 12 | 249 | 133147 | 694.83 | 688 | 681 | 190.6 |
| C | 12 | 250 | 40139 | 206.97 | 688 | 681 | 190.6 |
| D | 7 | 70 | 2879480 | 15304.46 | 661 | 631 | 188.1 |
| D | 6 | 239 | 254062 | 1347.28 | 661 | 631 | 188.1 |
| D | 2 | 172 | 191275 | 1013.5 | 661 | 631 | 188.1 |
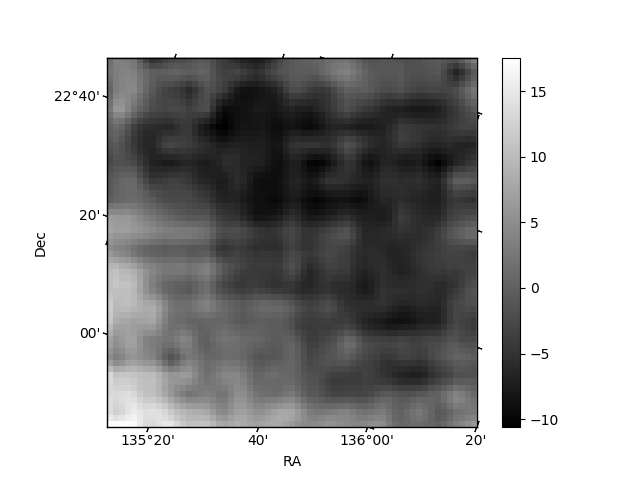
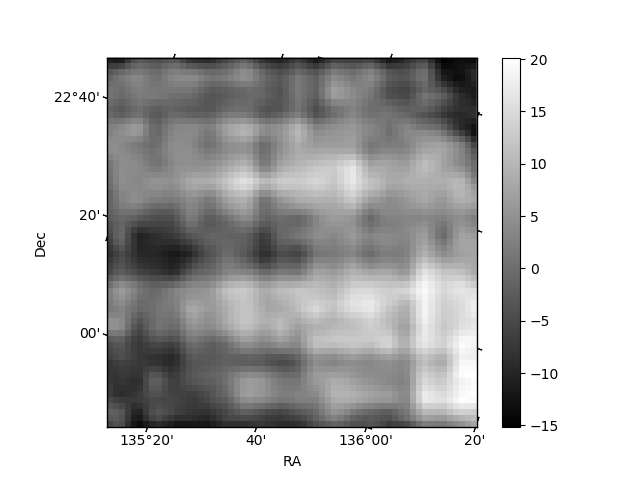
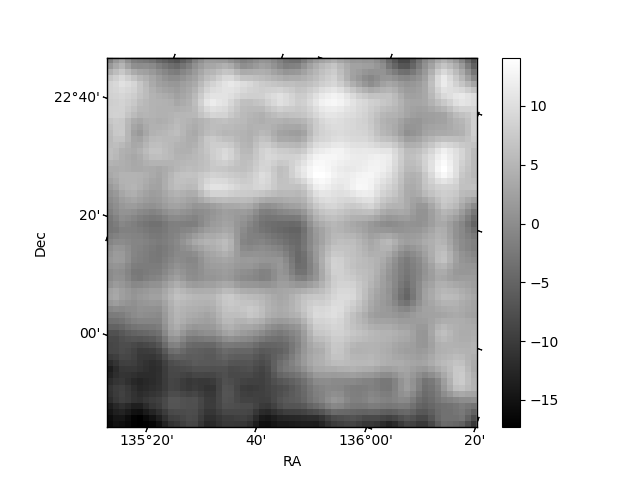
Histogram calculated using DETX and DETY for each event in the final _common_clean file
| Quadrant A | 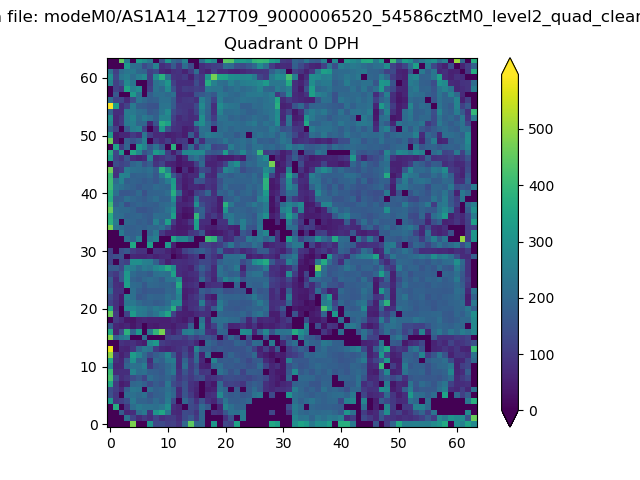 |
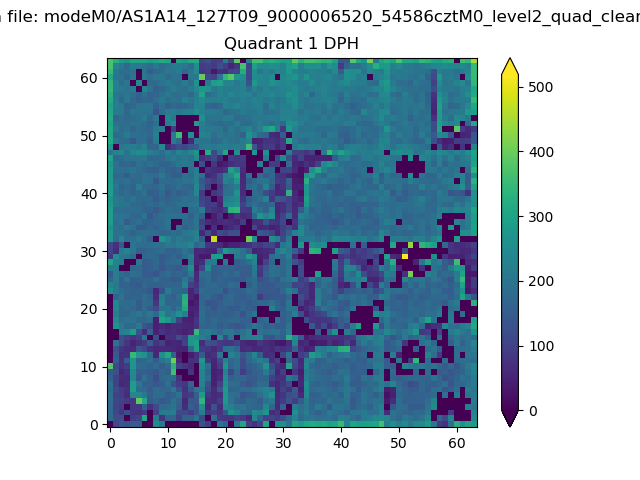 |
Quadrant B |
|---|---|---|---|
| Quadrant D | 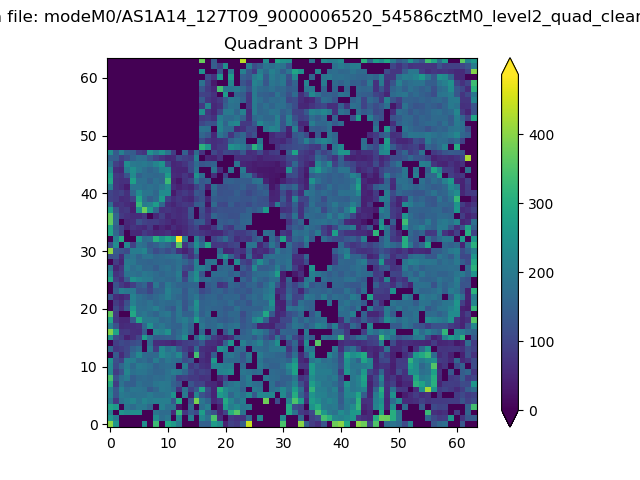 |
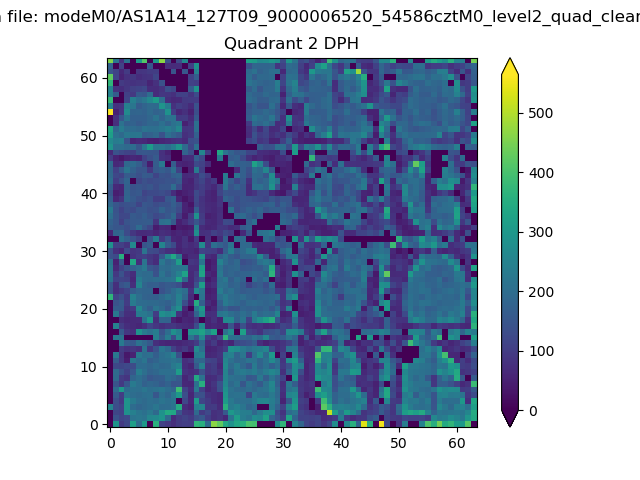 |
Quadrant C |
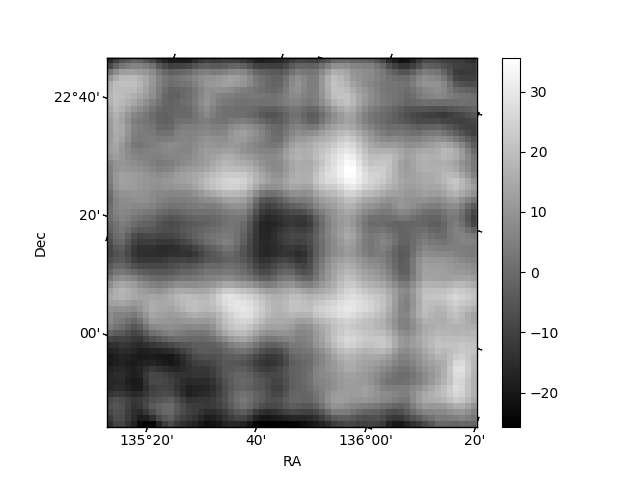
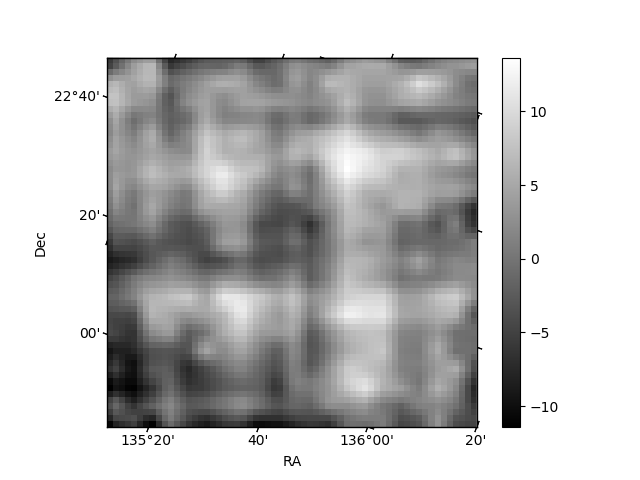
| Plot type | Count rate plots | Images |
|---|---|---|
| Comparison with Poisson distribution Blue bars denote a histogram of data divided into 1 sec bins. Red curve is a Poisson curve with rate = median count rate of data. |
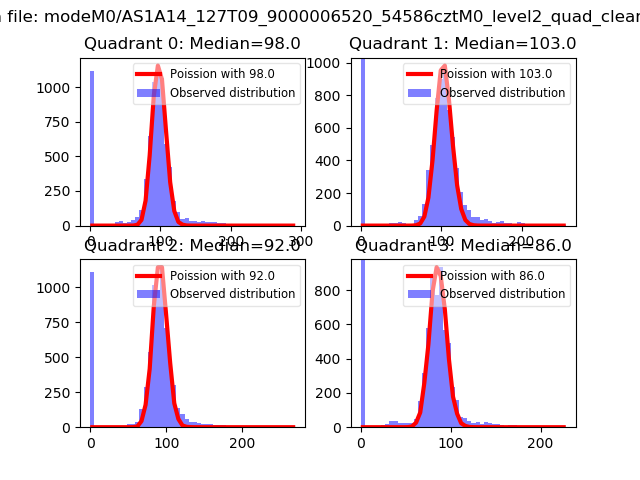 |
 |
| Quadrant-wise count rates Data is divided into 100 sec bins |
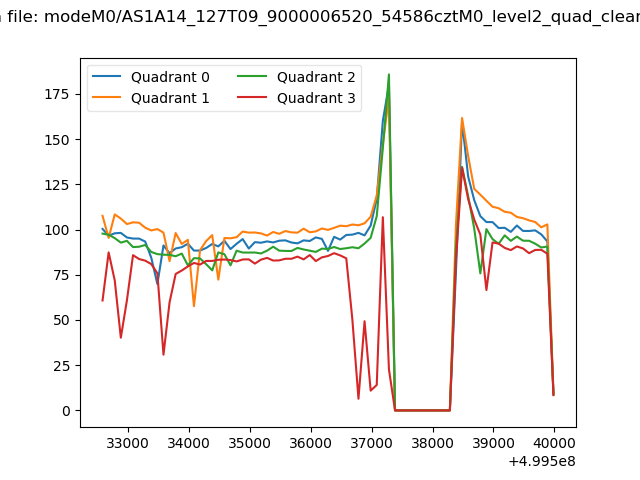 |
|
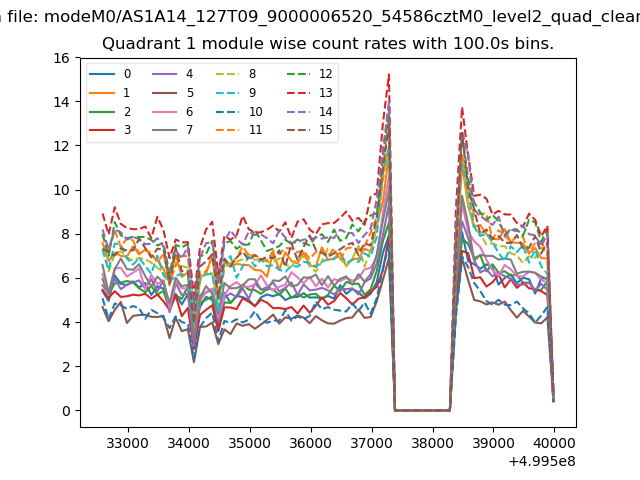
| Module-wise count rates for Quadrant A Data is divided into 100 sec bins |
 |
 |
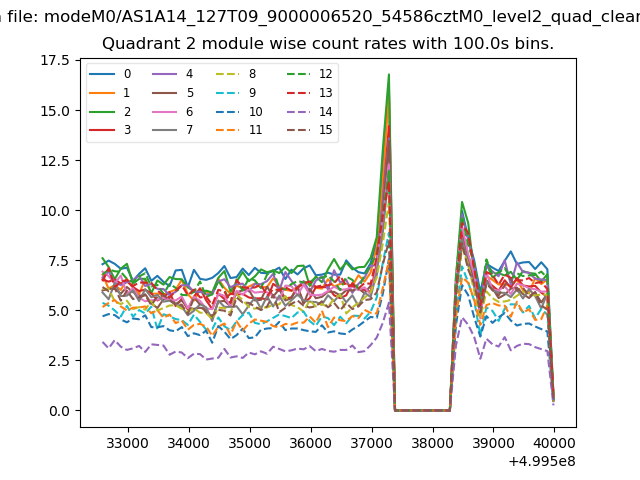
| Module-wise count rates for Quadrant B Data is divided into 100 sec bins |
 |
 |
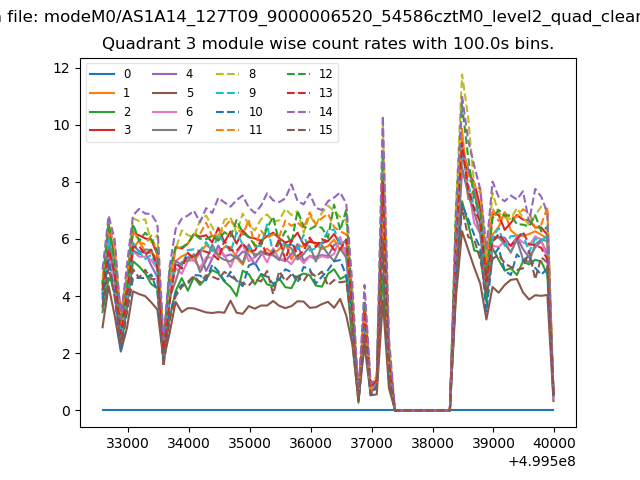
| Module-wise count rates for Quadrant C Data is divided into 100 sec bins |
 |
 |
| Module-wise count rates for Quadrant D Data is divided into 100 sec bins |
 |
 |
| Parameter | Plot |
|---|---|
| CZT HV Monitor | 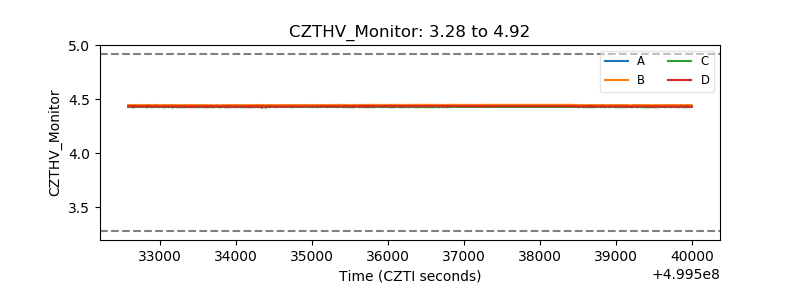 |
| D_VDD | 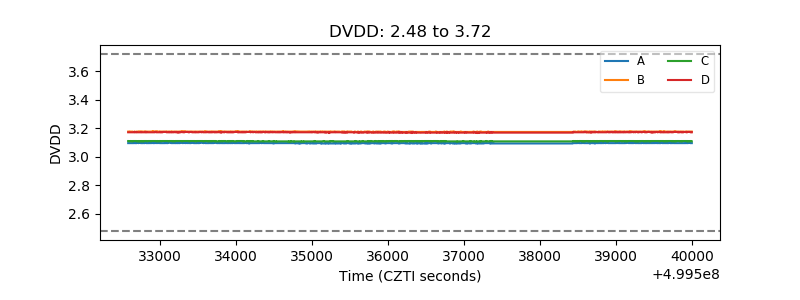 |
| Temperature 1 | 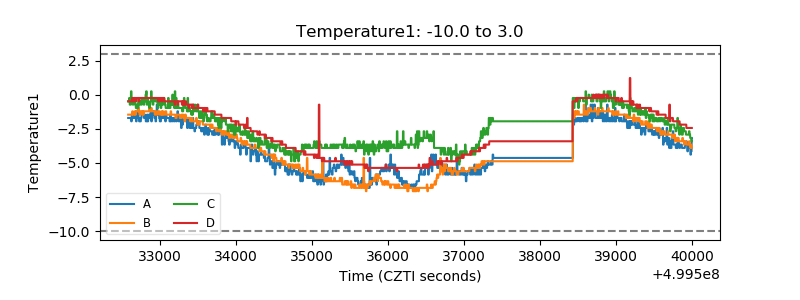 |
| Veto HV Monitor |  |
| Veto LLD | 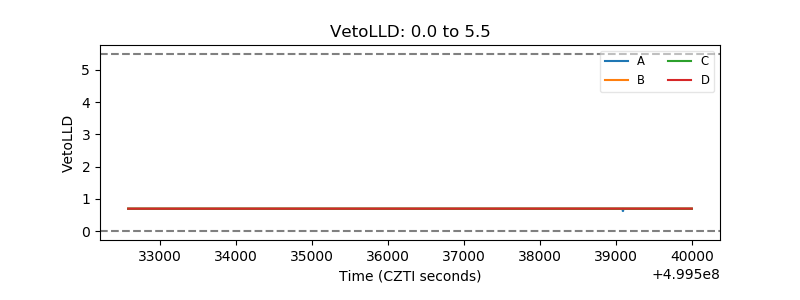 |
| Alpha Counter | 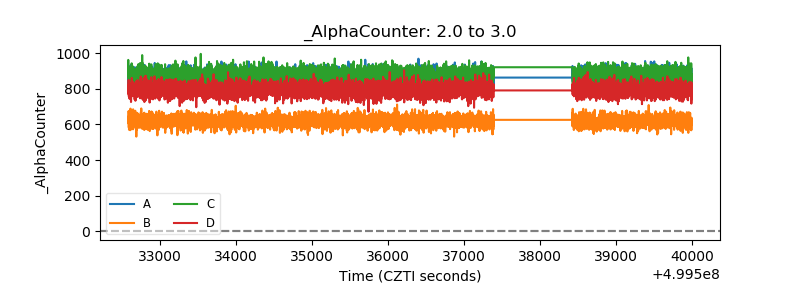 |
| _CPM_Rate | 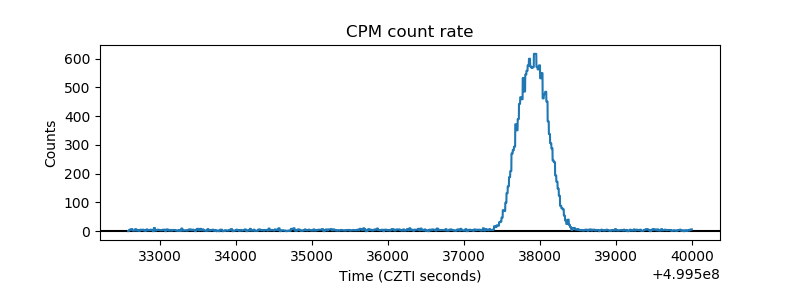 |
| CZT Counter | 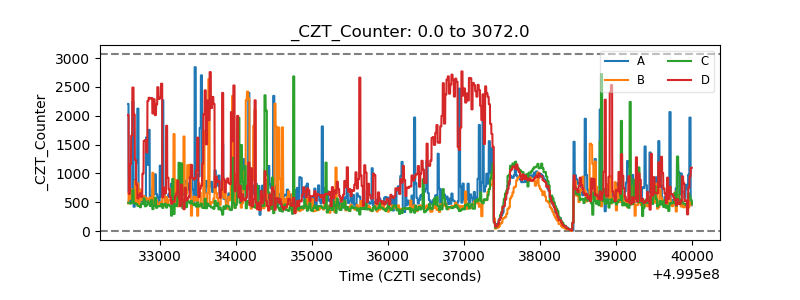 |
| +2.5 Volts monitor | 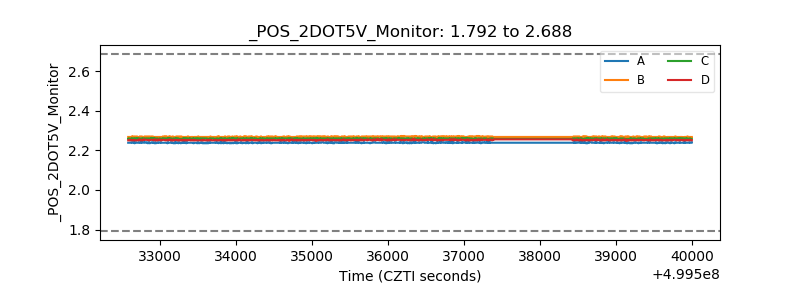 |
| +5 Volts monitor | 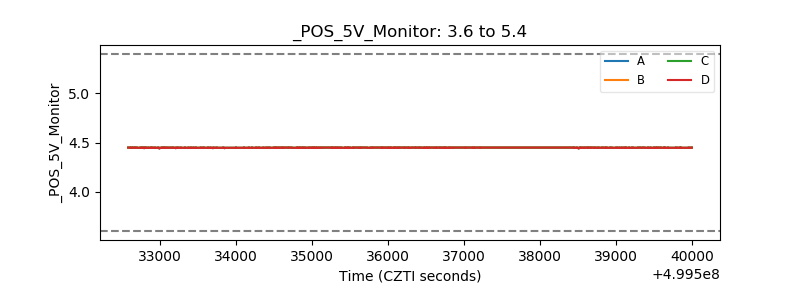 |
| _ROLL_ROT | 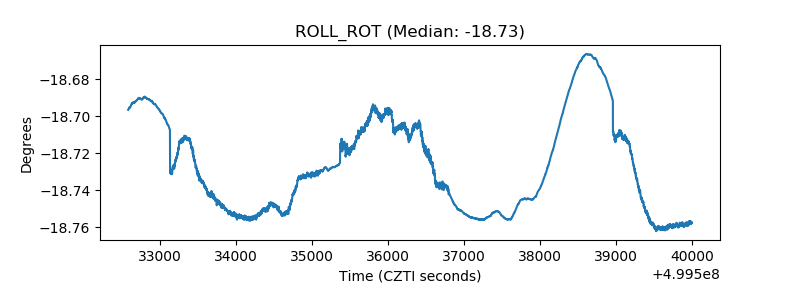 |
| _Roll_DEC | 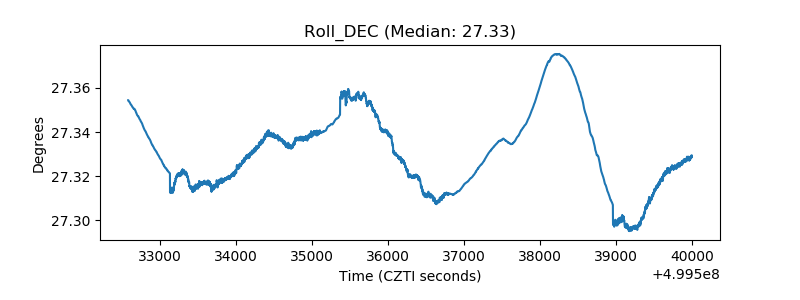 |
| _Roll_RA | 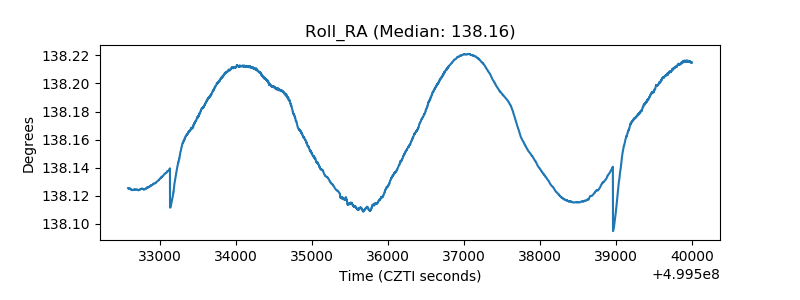 |
| Veto Counter | 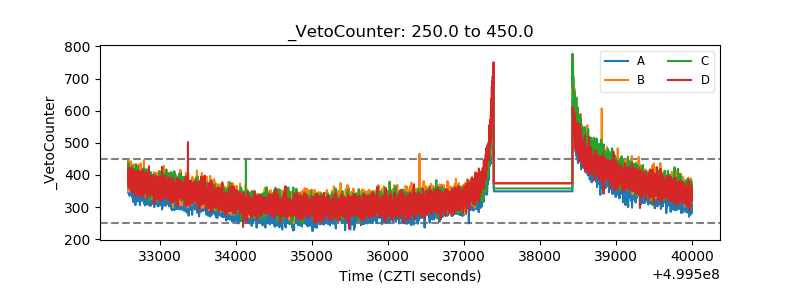 |