| Param | Original file | Final file |
|---|---|---|
| Filename | modeM0/AS1A14_127T09_9000006520_54587cztM0_level2.fits | modeM0/AS1A14_127T09_9000006520_54587cztM0_level2_quad_clean.evt |
| Size (bytes) | 469,056,960 | 98,945,280 |
| Size | 447.3 MB | 94.4 MB |
| Events in quadrant A | 4,434,123 | 660,747 |
| Events in quadrant B | 3,545,074 | 705,943 |
| Events in quadrant C | 3,523,630 | 619,989 |
| Events in quadrant D | 5,356,114 | 556,743 |
| Mode M0 | |||
|---|---|---|---|
| Quadrant | BADHDUFLAG | Total packets | Discarded packets |
| A | 0 | 17627 | 2 |
| B | 0 | 15220 | 2 |
| C | 0 | 14933 | 2 |
| D | 0 | 20453 | 2 |
| Mode SS | |||
|---|---|---|---|
| Quadrant | BADHDUFLAG | Total packets | Discarded packets |
| A | 0 | 132 | 0 |
| B | 0 | 134 | 0 |
| C | 0 | 134 | 0 |
| D | 0 | 134 | 0 |
| Mode M9 | |||
|---|---|---|---|
| Quadrant | BADHDUFLAG | Total packets | Discarded packets |
| A | 0 | 20 | 0 |
| B | 0 | 21 | 0 |
| C | 0 | 21 | 0 |
| D | 0 | 21 | 0 |
| Quadrant | Total seconds | Saturated seconds | Saturation percentage |
|---|---|---|---|
| A | 6487 | 179 | 2.759365% |
| B | 6487 | 116 | 1.788192% |
| C | 6487 | 165 | 2.543549% |
| D | 6487 | 535 | 8.247264% |
Noise dominated data is calculated using 1-second bins in cleaned event files. If a bin has >2000 counts, and if more than 50% of those come from <1% of pixels, then it is considered to be noise-dominated and hence unusable.
| Quadrant | # 1 sec bins | Bins with >0 counts | Bins with >2000 counts | High rate bins dominated by noise | Noise dominated (total time) | Noise dominated (detector-on time) | Marked lightcurve |
|---|---|---|---|---|---|---|---|
| A | 7578 | 6488 | 90 | 90 | 1.19% | 1.39% | 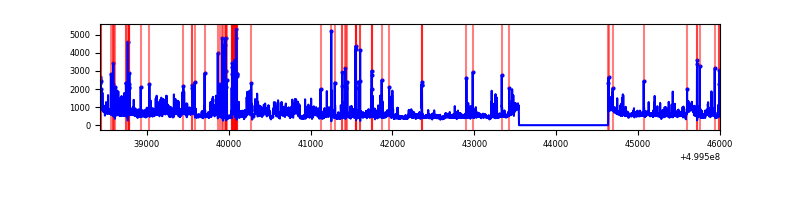 |
| B | 7578 | 6488 | 19 | 19 | 0.25% | 0.29% | 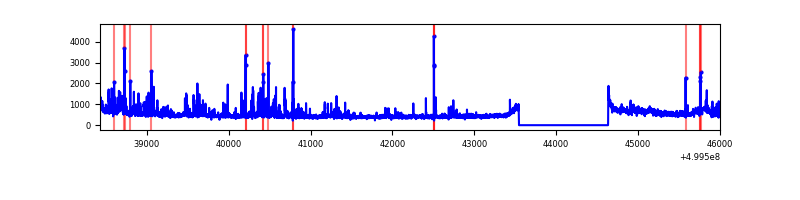 |
| C | 7578 | 6488 | 88 | 88 | 1.16% | 1.36% | 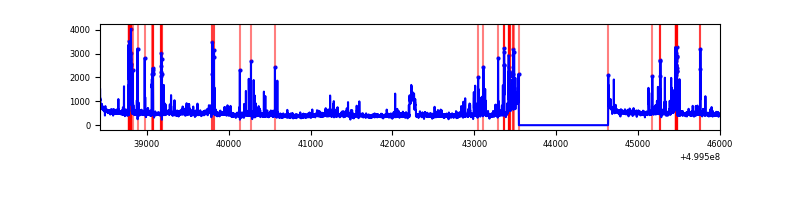 |
| D | 7578 | 6488 | 487 | 487 | 6.43% | 7.51% | 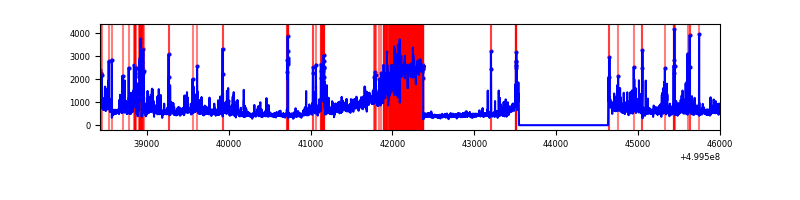 |
Top three noisy pixels from each quadrant. If the there are fewer than three noisy pixels in the level2.evt file, extra rows are filled as -1
| Pixel properties | Quadrant properties | ||||||
|---|---|---|---|---|---|---|---|
| Quadrant | DetID | PixID | Counts | Sigma | Mean | Median | Sigma |
| A | 3 | 14 | 976100 | 5267.51 | 740 | 723 | 185.2 |
| A | 11 | 3 | 324255 | 1747.23 | 740 | 723 | 185.2 |
| A | 4 | 3 | 75321 | 402.87 | 740 | 723 | 185.2 |
| B | 10 | 14 | 194008 | 1227.55 | 734 | 709 | 157.5 |
| B | 5 | 172 | 134321 | 848.5 | 734 | 709 | 157.5 |
| B | 8 | 234 | 82080 | 516.75 | 734 | 709 | 157.5 |
| C | 4 | 5 | 246286 | 1238.6 | 718 | 714 | 198.3 |
| C | 13 | 3 | 159291 | 799.82 | 718 | 714 | 198.3 |
| C | 12 | 249 | 132647 | 665.43 | 718 | 714 | 198.3 |
| D | 7 | 70 | 1398368 | 7013.95 | 696 | 663 | 199.3 |
| D | 3 | 12 | 248697 | 1244.68 | 696 | 663 | 199.3 |
| D | 2 | 172 | 225683 | 1129.19 | 696 | 663 | 199.3 |
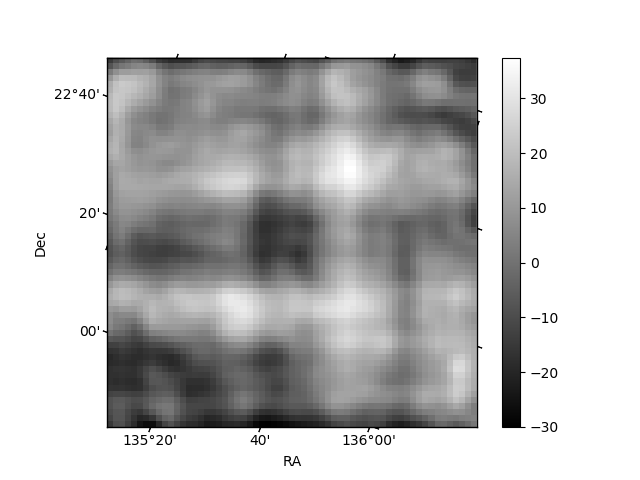
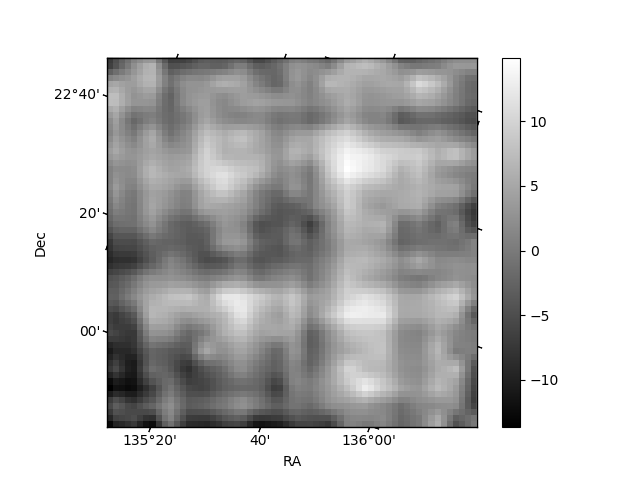
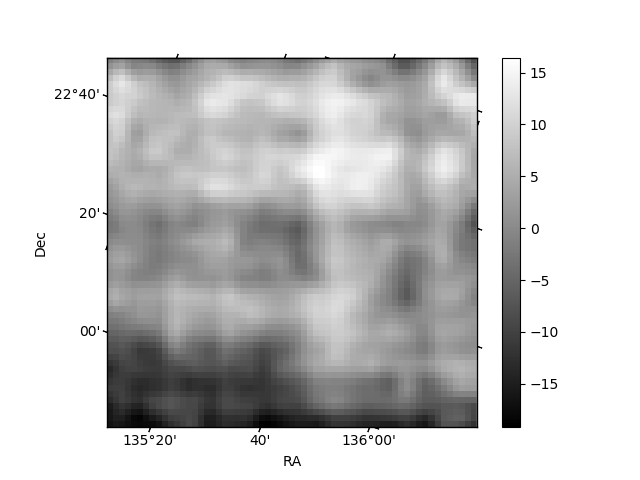
Histogram calculated using DETX and DETY for each event in the final _common_clean file
| Quadrant A | 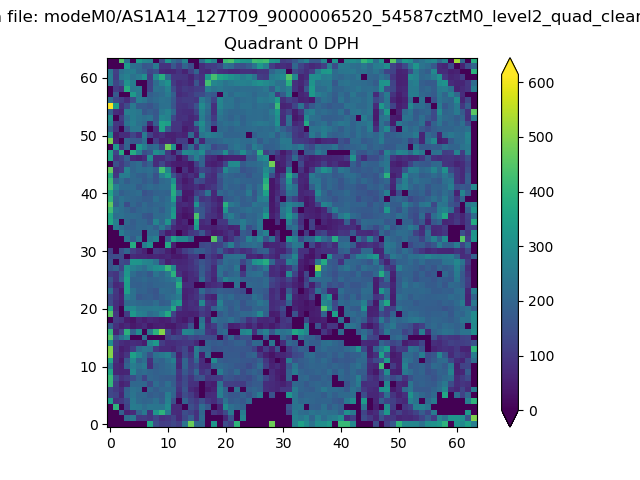 |
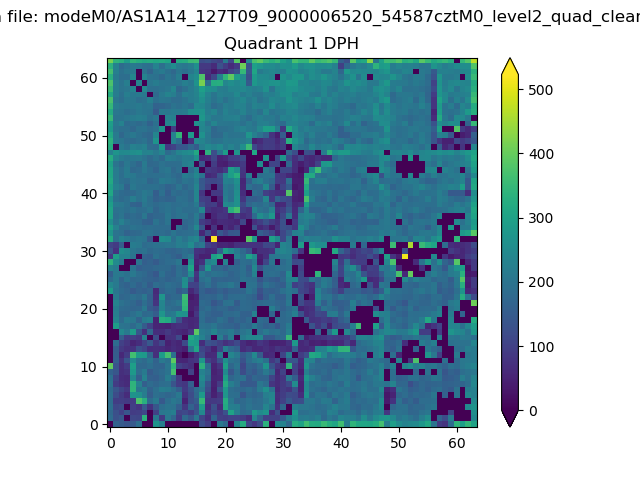 |
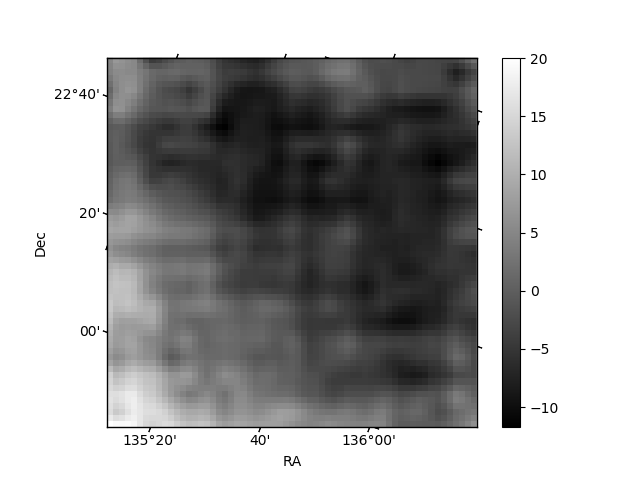
Quadrant B |
|---|---|---|---|
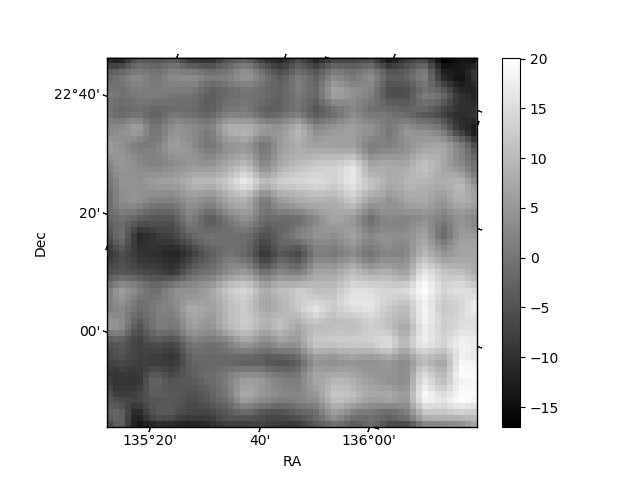
| Quadrant D | 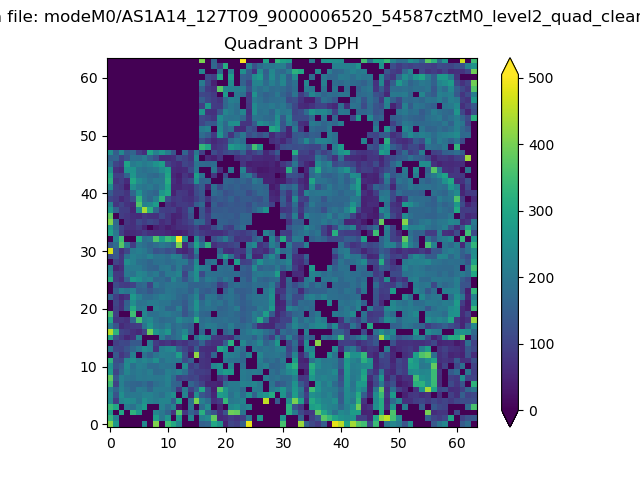 |
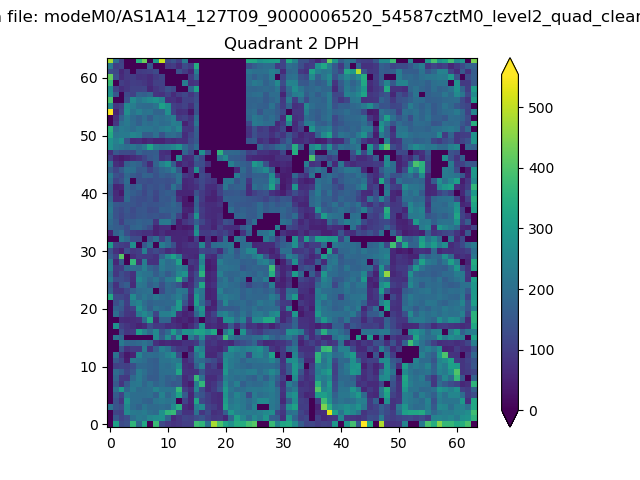 |
Quadrant C |
| Plot type | Count rate plots | Images |
|---|---|---|
| Comparison with Poisson distribution Blue bars denote a histogram of data divided into 1 sec bins. Red curve is a Poisson curve with rate = median count rate of data. |
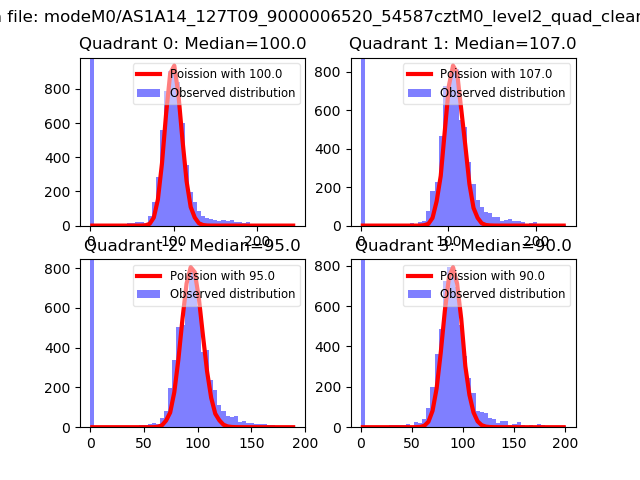 |
 |
| Quadrant-wise count rates Data is divided into 100 sec bins |
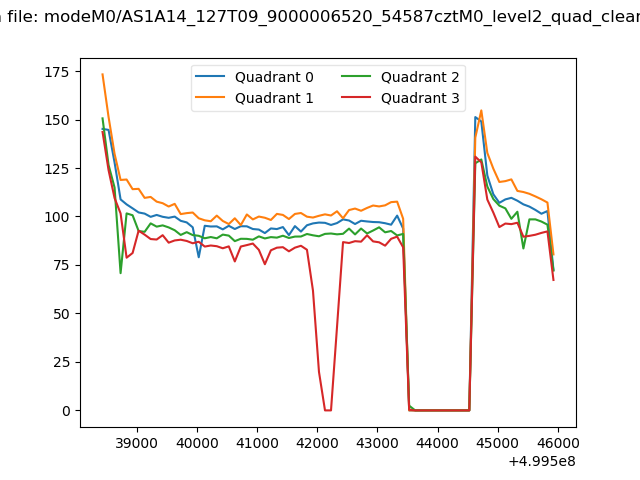 |
|
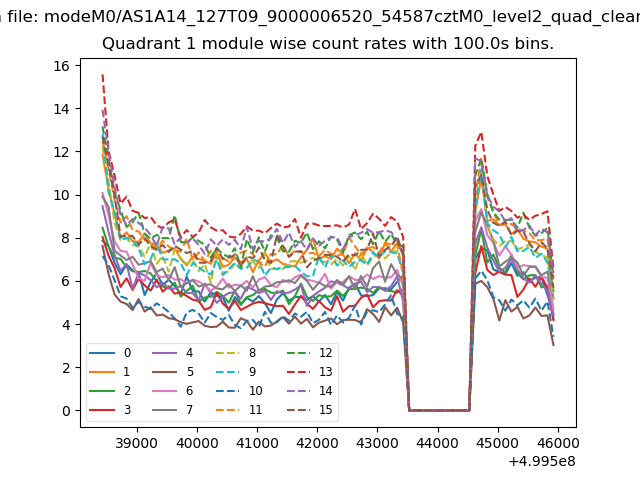
| Module-wise count rates for Quadrant A Data is divided into 100 sec bins |
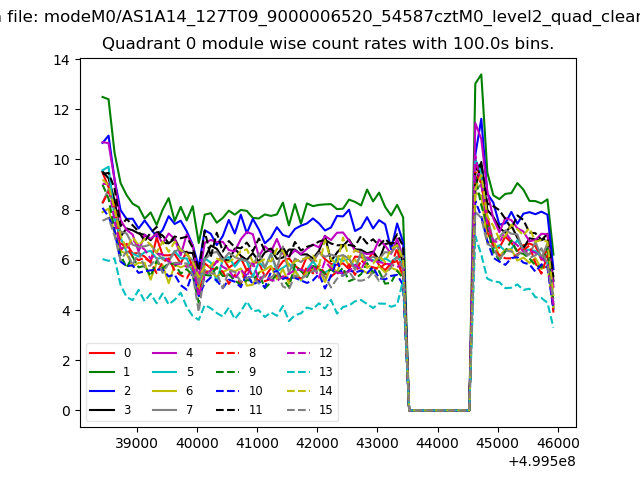 |
 |
| Module-wise count rates for Quadrant B Data is divided into 100 sec bins |
 |
 |
| Module-wise count rates for Quadrant C Data is divided into 100 sec bins |
 |
 |
| Module-wise count rates for Quadrant D Data is divided into 100 sec bins |
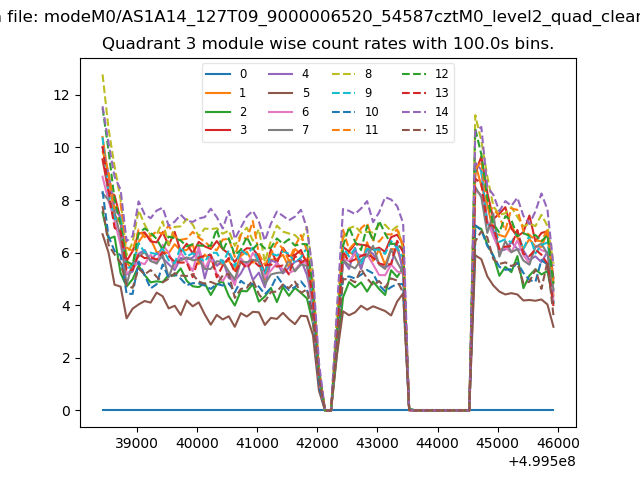 |
 |
| Parameter | Plot |
|---|---|
| CZT HV Monitor |  |
| D_VDD | 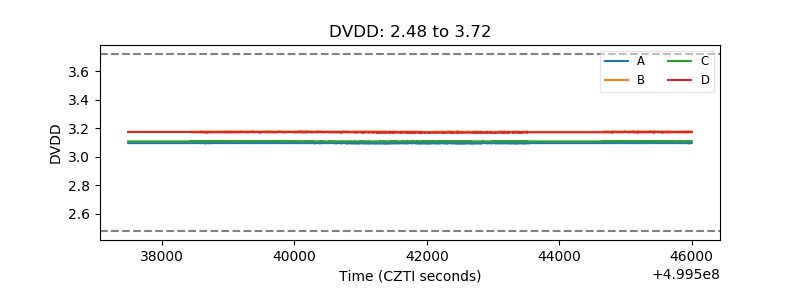 |
| Temperature 1 | 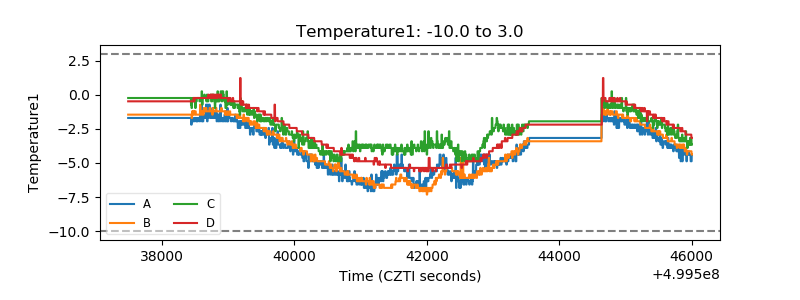 |
| Veto HV Monitor | 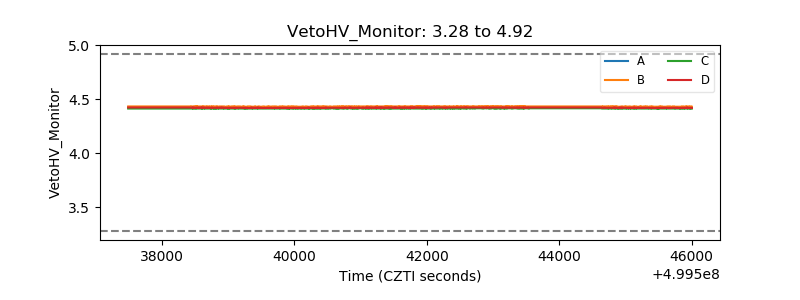 |
| Veto LLD | 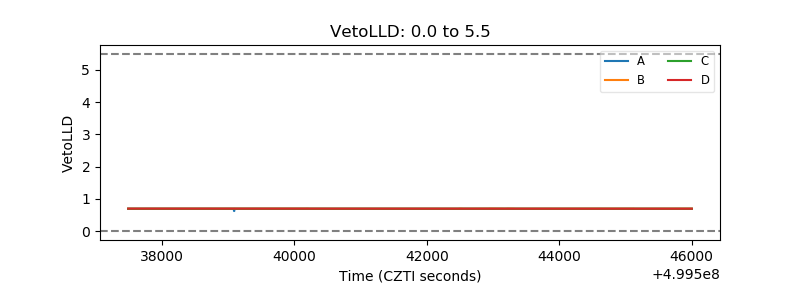 |
| Alpha Counter | 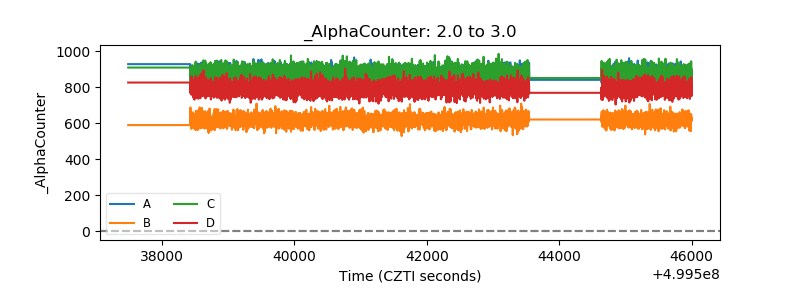 |
| _CPM_Rate | 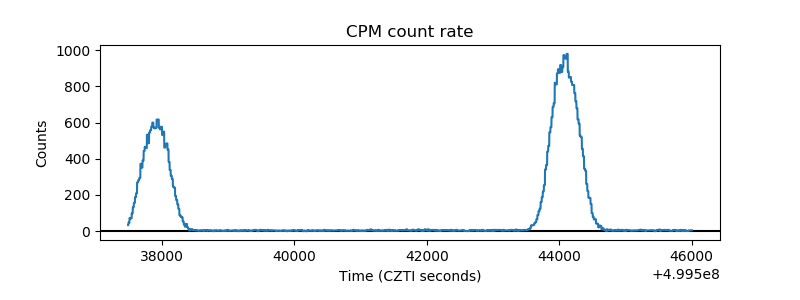 |
| CZT Counter | 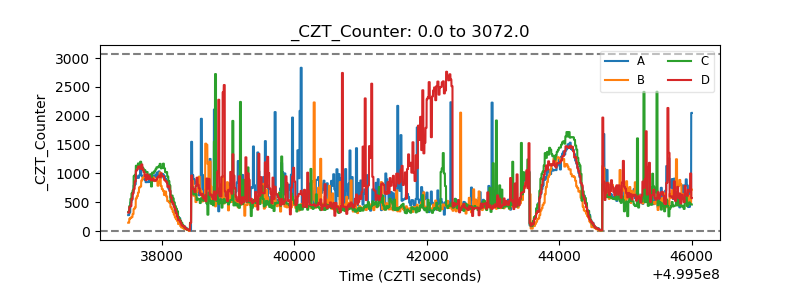 |
| +2.5 Volts monitor |  |
| +5 Volts monitor |  |
| _ROLL_ROT | 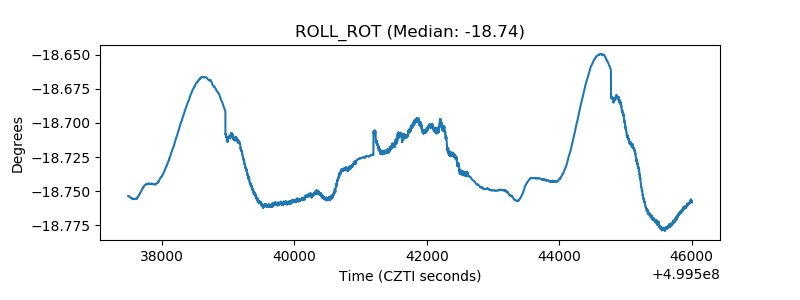 |
| _Roll_DEC | 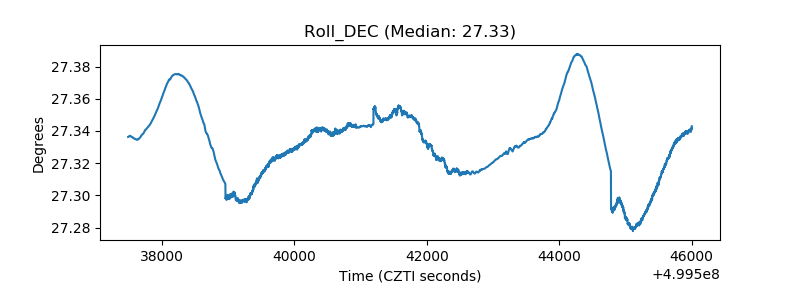 |
| _Roll_RA | 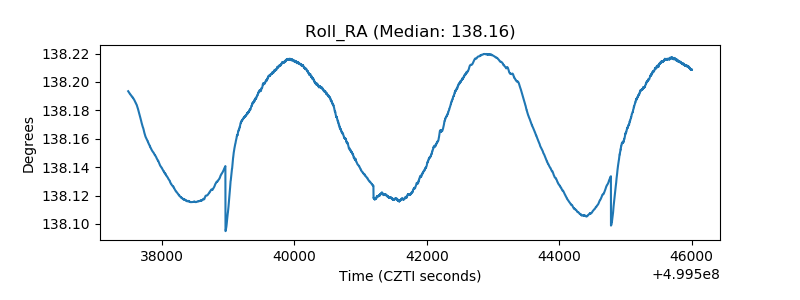 |
| Veto Counter | 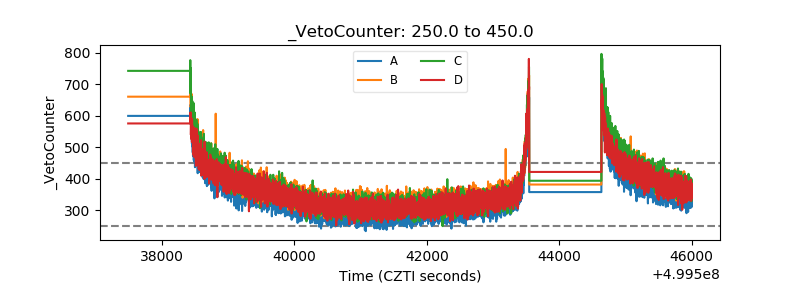 |