| Param | Original file | Final file |
|---|---|---|
| Filename | modeM0/AS1A14_127T09_9000006520_54588cztM0_level2.fits | modeM0/AS1A14_127T09_9000006520_54588cztM0_level2_quad_clean.evt |
| Size (bytes) | 444,689,280 | 99,938,880 |
| Size | 424.1 MB | 95.3 MB |
| Events in quadrant A | 4,771,853 | 654,550 |
| Events in quadrant B | 3,835,468 | 695,060 |
| Events in quadrant C | 3,178,913 | 632,383 |
| Events in quadrant D | 4,169,537 | 590,653 |
| Mode M0 | |||
|---|---|---|---|
| Quadrant | BADHDUFLAG | Total packets | Discarded packets |
| A | 0 | 18771 | 2 |
| B | 0 | 16062 | 2 |
| C | 0 | 14029 | 2 |
| D | 0 | 16921 | 2 |
| Mode SS | |||
|---|---|---|---|
| Quadrant | BADHDUFLAG | Total packets | Discarded packets |
| A | 0 | 132 | 0 |
| B | 0 | 132 | 0 |
| C | 0 | 132 | 0 |
| D | 0 | 132 | 0 |
| Mode M9 | |||
|---|---|---|---|
| Quadrant | BADHDUFLAG | Total packets | Discarded packets |
| A | 0 | 19 | 0 |
| B | 0 | 19 | 0 |
| C | 0 | 20 | 0 |
| D | 0 | 20 | 0 |
| Quadrant | Total seconds | Saturated seconds | Saturation percentage |
|---|---|---|---|
| A | 6501 | 289 | 4.445470% |
| B | 6501 | 283 | 4.353176% |
| C | 6501 | 80 | 1.230580% |
| D | 6501 | 190 | 2.922627% |
Noise dominated data is calculated using 1-second bins in cleaned event files. If a bin has >2000 counts, and if more than 50% of those come from <1% of pixels, then it is considered to be noise-dominated and hence unusable.
| Quadrant | # 1 sec bins | Bins with >0 counts | Bins with >2000 counts | High rate bins dominated by noise | Noise dominated (total time) | Noise dominated (detector-on time) | Marked lightcurve |
|---|---|---|---|---|---|---|---|
| A | 7631 | 6502 | 170 | 170 | 2.23% | 2.61% | 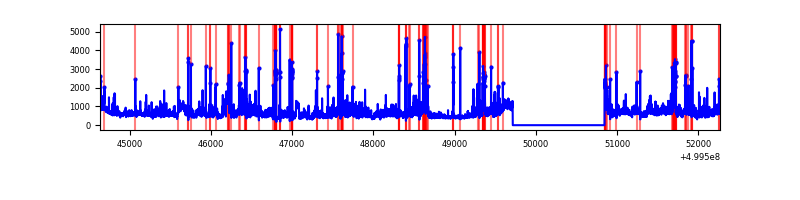 |
| B | 7631 | 6501 | 129 | 129 | 1.69% | 1.98% | 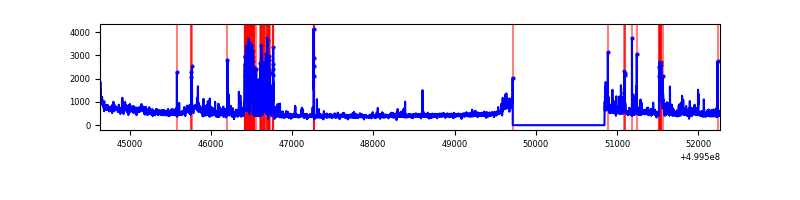 |
| C | 7631 | 6502 | 26 | 26 | 0.34% | 0.40% | 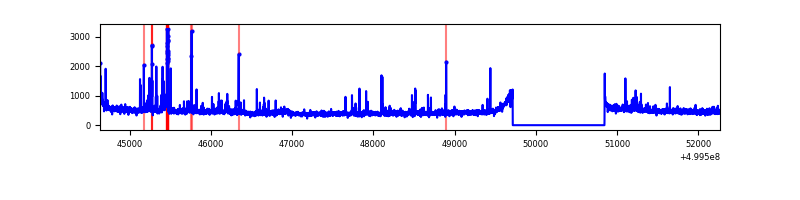 |
| D | 7631 | 6502 | 100 | 100 | 1.31% | 1.54% | 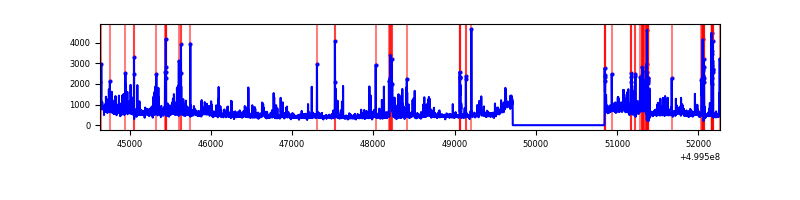 |
Top three noisy pixels from each quadrant. If the there are fewer than three noisy pixels in the level2.evt file, extra rows are filled as -1
| Pixel properties | Quadrant properties | ||||||
|---|---|---|---|---|---|---|---|
| Quadrant | DetID | PixID | Counts | Sigma | Mean | Median | Sigma |
| A | 3 | 14 | 1165334 | 6403.57 | 736 | 718 | 181.9 |
| A | 11 | 3 | 478343 | 2626.19 | 736 | 718 | 181.9 |
| A | 0 | 8 | 173116 | 947.92 | 736 | 718 | 181.9 |
| B | 2 | 249 | 373590 | 2373.4 | 734 | 709 | 157.1 |
| B | 5 | 172 | 149686 | 948.24 | 734 | 709 | 157.1 |
| B | 10 | 14 | 139671 | 884.5 | 734 | 709 | 157.1 |
| C | 13 | 3 | 79107 | 389.99 | 730 | 722 | 201.0 |
| C | 4 | 5 | 50069 | 245.52 | 730 | 722 | 201.0 |
| C | 9 | 38 | 48004 | 235.24 | 730 | 722 | 201.0 |
| D | 3 | 12 | 419862 | 2033.65 | 721 | 690 | 206.1 |
| D | 2 | 172 | 261382 | 1264.77 | 721 | 690 | 206.1 |
| D | 15 | 94 | 251452 | 1216.59 | 721 | 690 | 206.1 |
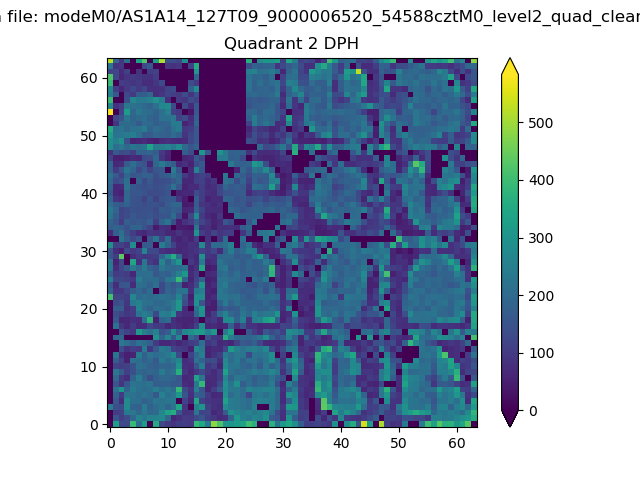
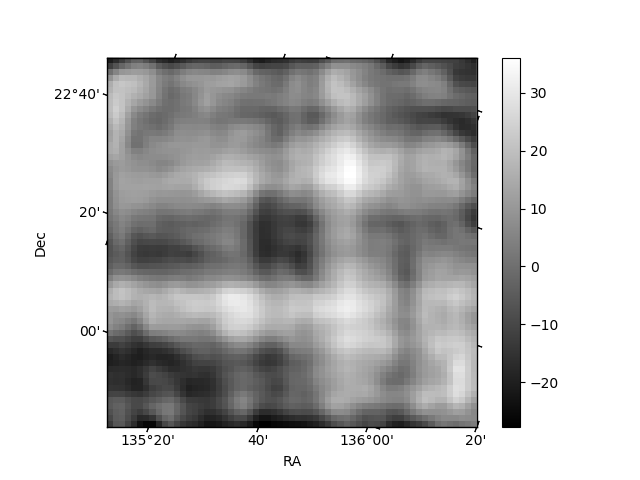
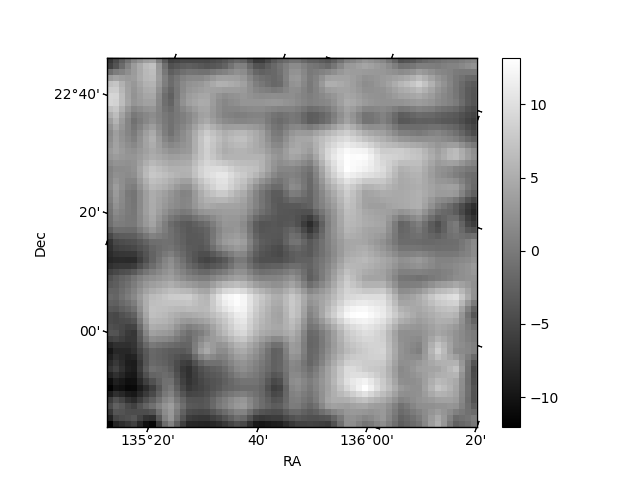
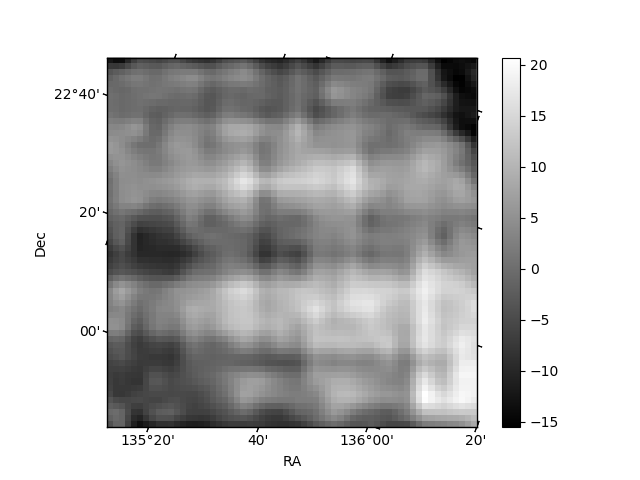
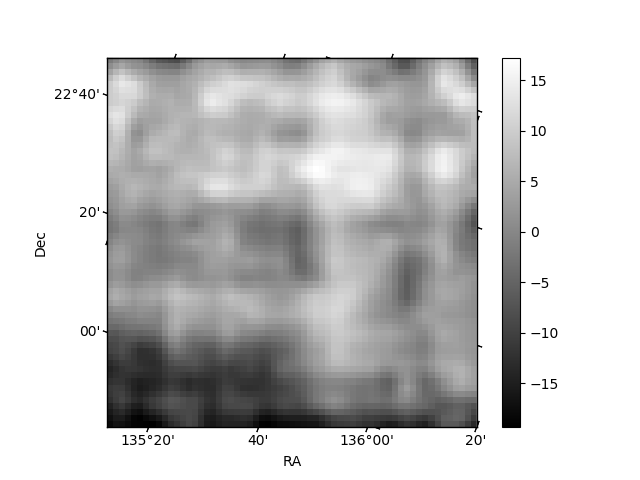
Histogram calculated using DETX and DETY for each event in the final _common_clean file
| Quadrant A | 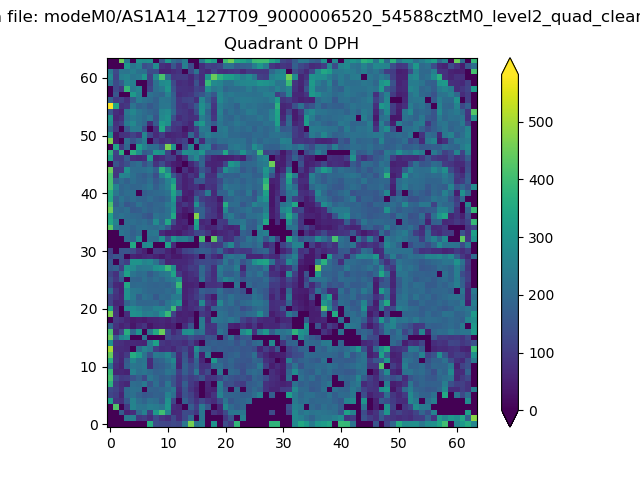 |
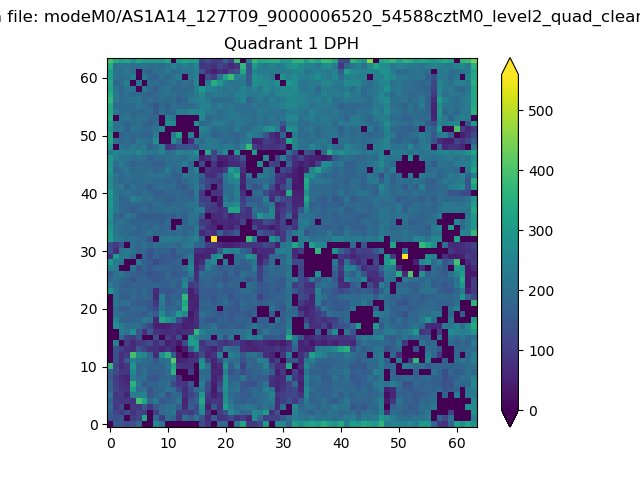 |
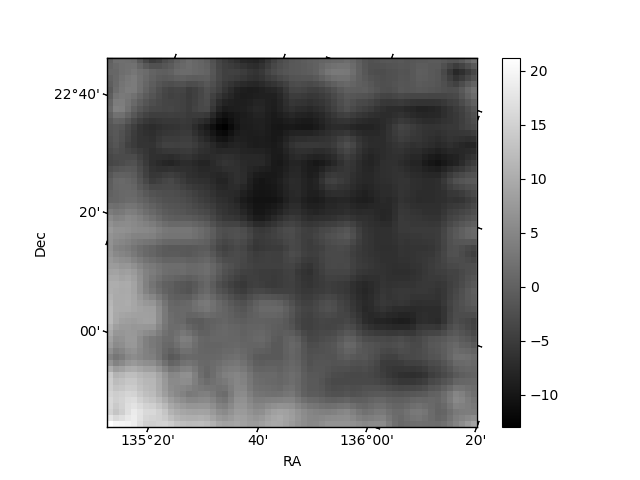
Quadrant B |
|---|---|---|---|
| Quadrant D | 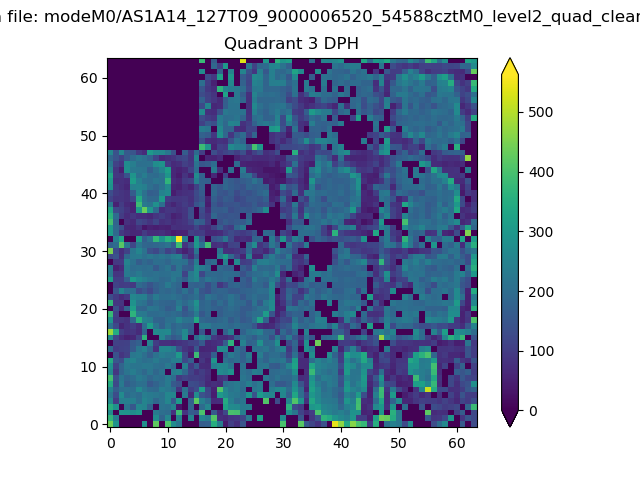 |
 |
Quadrant C |
| Plot type | Count rate plots | Images |
|---|---|---|
| Comparison with Poisson distribution Blue bars denote a histogram of data divided into 1 sec bins. Red curve is a Poisson curve with rate = median count rate of data. |
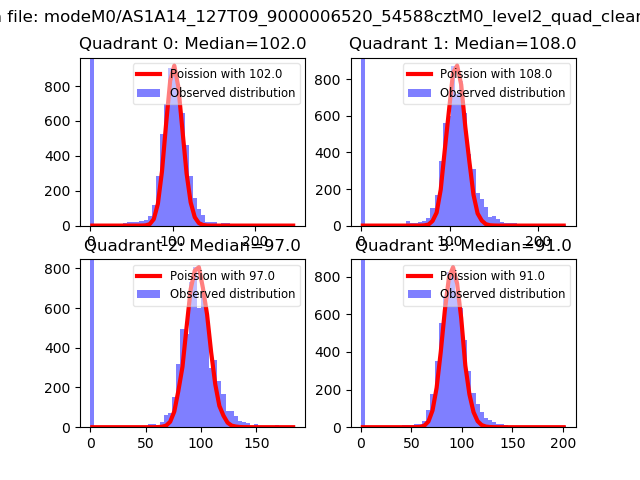 |
 |
| Quadrant-wise count rates Data is divided into 100 sec bins |
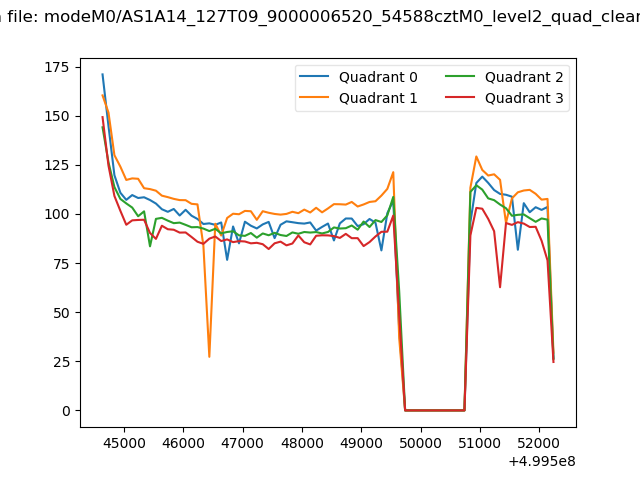 |
|
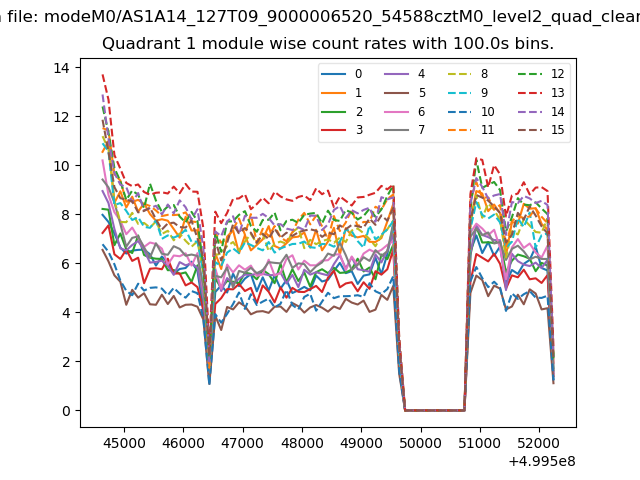
| Module-wise count rates for Quadrant A Data is divided into 100 sec bins |
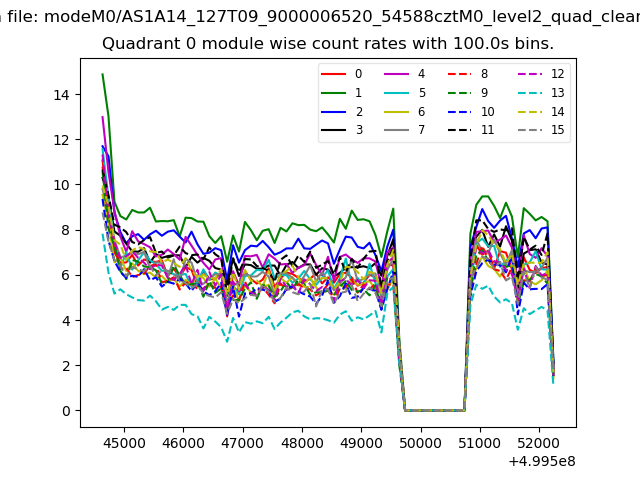 |
 |
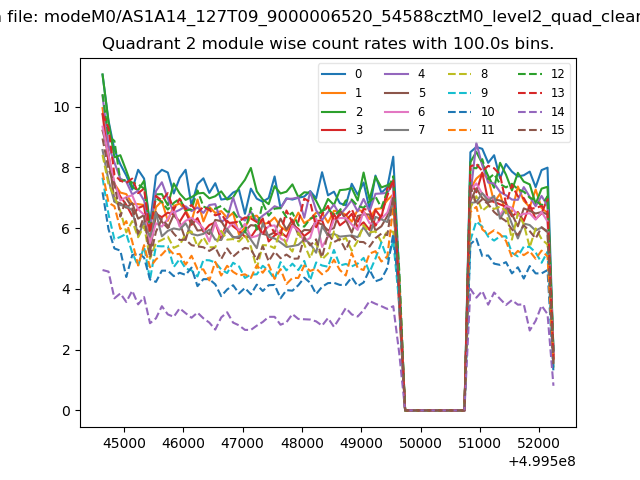
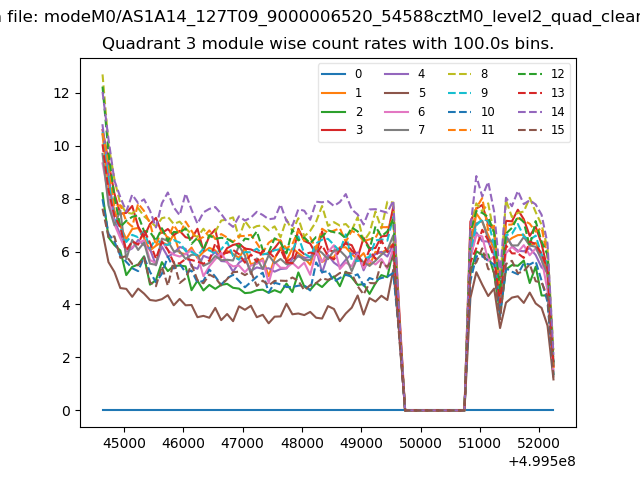
| Module-wise count rates for Quadrant B Data is divided into 100 sec bins |
 |
 |
| Module-wise count rates for Quadrant C Data is divided into 100 sec bins |
 |
 |
| Module-wise count rates for Quadrant D Data is divided into 100 sec bins |
 |
 |
| Parameter | Plot |
|---|---|
| CZT HV Monitor |  |
| D_VDD | 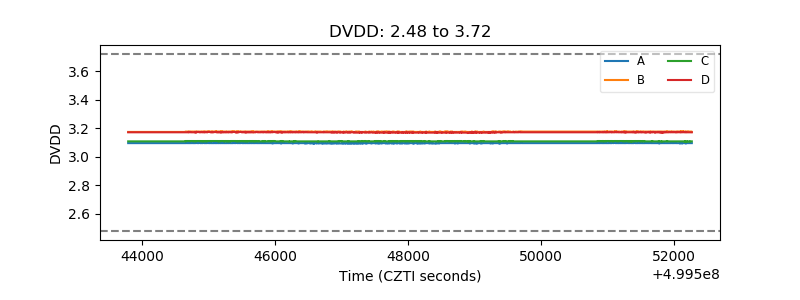 |
| Temperature 1 | 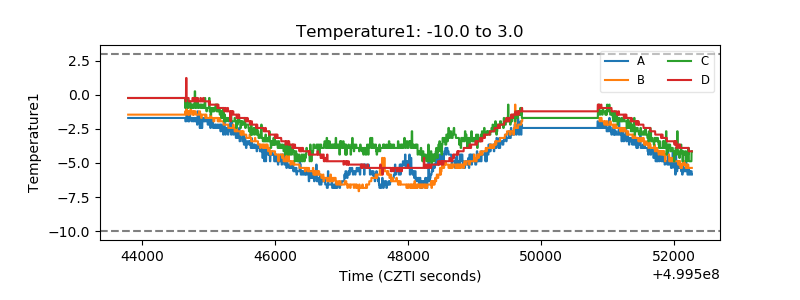 |
| Veto HV Monitor | 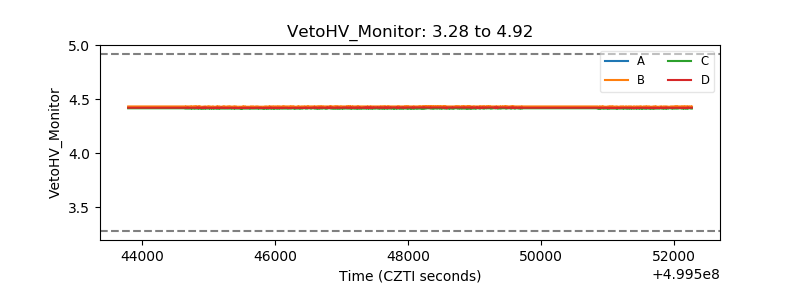 |
| Veto LLD | 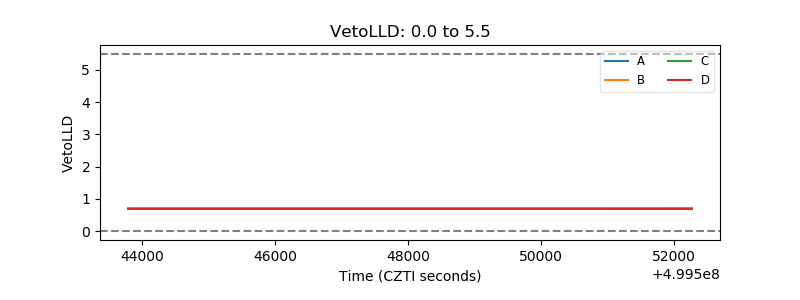 |
| Alpha Counter | 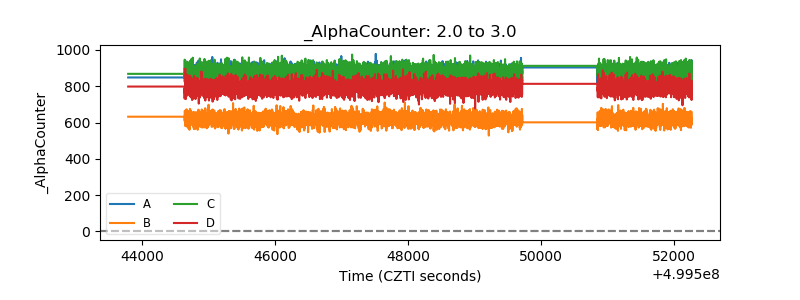 |
| _CPM_Rate | 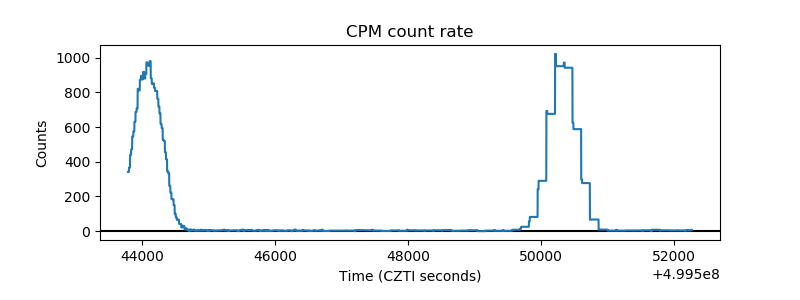 |
| CZT Counter | 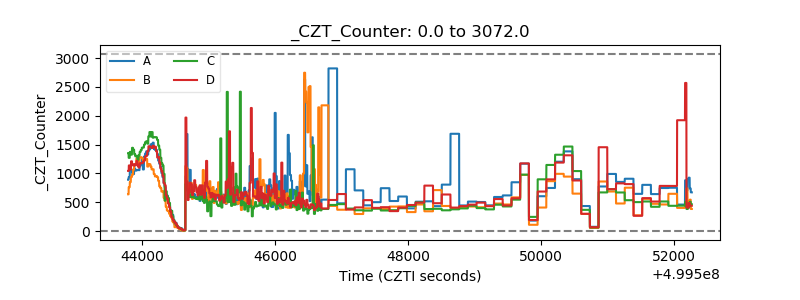 |
| +2.5 Volts monitor | 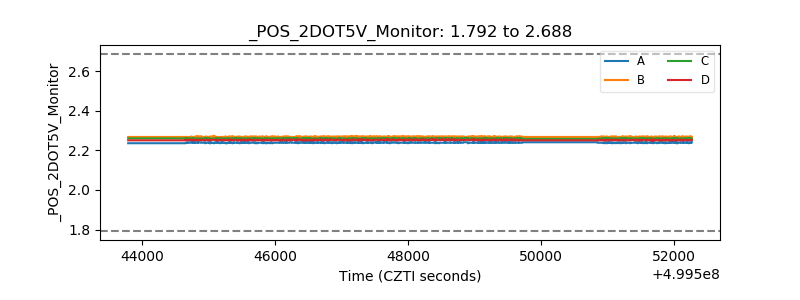 |
| +5 Volts monitor | 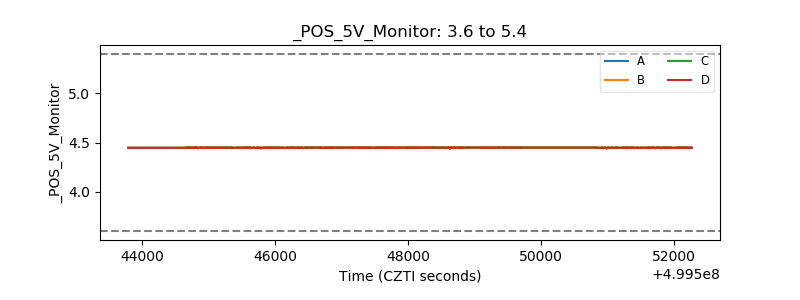 |
| _ROLL_ROT | 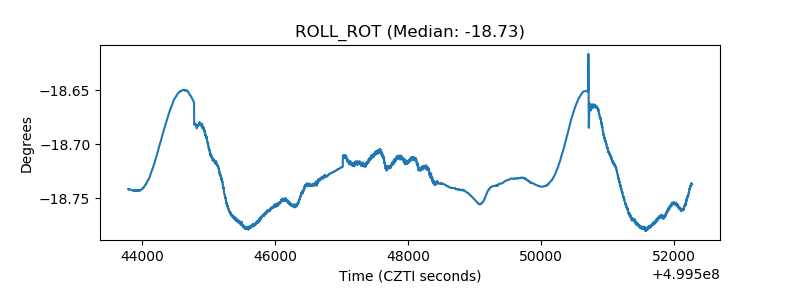 |
| _Roll_DEC | 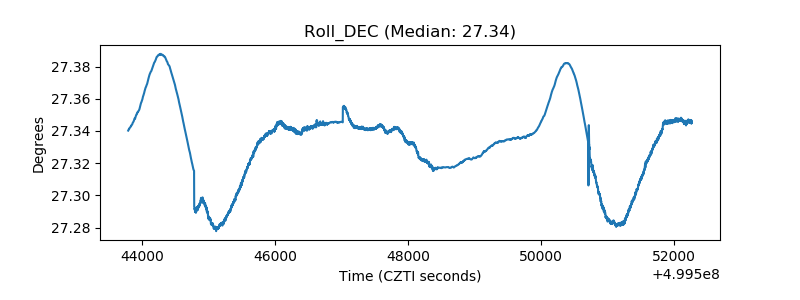 |
| _Roll_RA | 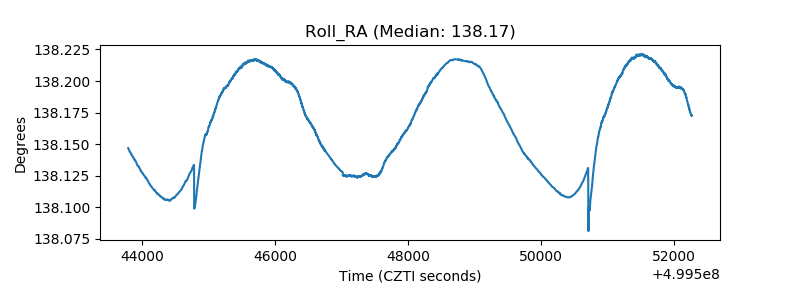 |
| Veto Counter | 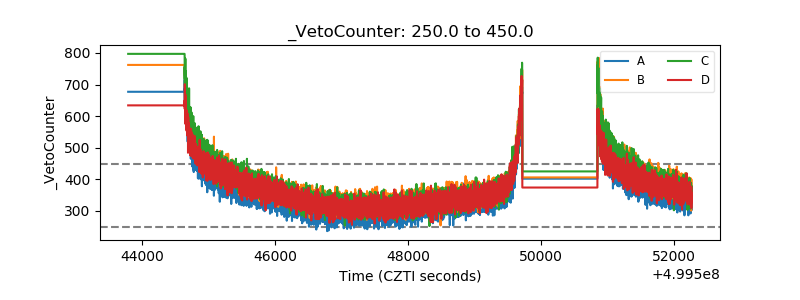 |