| Param | Original file | Final file |
|---|---|---|
| Filename | modeM0/AS1A14_127T09_9000006520_54589cztM0_level2.fits | modeM0/AS1A14_127T09_9000006520_54589cztM0_level2_quad_clean.evt |
| Size (bytes) | 484,934,400 | 96,514,560 |
| Size | 462.5 MB | 92.0 MB |
| Events in quadrant A | 5,134,507 | 635,513 |
| Events in quadrant B | 3,664,155 | 682,388 |
| Events in quadrant C | 4,106,729 | 585,530 |
| Events in quadrant D | 4,543,501 | 568,185 |
| Mode M0 | |||
|---|---|---|---|
| Quadrant | BADHDUFLAG | Total packets | Discarded packets |
| A | 0 | 19871 | 4 |
| B | 0 | 15456 | 2 |
| C | 0 | 16714 | 2 |
| D | 0 | 18011 | 2 |
| Mode SS | |||
|---|---|---|---|
| Quadrant | BADHDUFLAG | Total packets | Discarded packets |
| A | 0 | 132 | 0 |
| B | 0 | 132 | 0 |
| C | 0 | 132 | 0 |
| D | 0 | 132 | 0 |
| Mode M9 | |||
|---|---|---|---|
| Quadrant | BADHDUFLAG | Total packets | Discarded packets |
| A | 0 | 12 | 0 |
| B | 0 | 12 | 0 |
| C | 0 | 13 | 0 |
| D | 0 | 13 | 0 |
| Quadrant | Total seconds | Saturated seconds | Saturation percentage |
|---|---|---|---|
| A | 6460 | 328 | 5.077399% |
| B | 6460 | 255 | 3.947368% |
| C | 6460 | 448 | 6.934985% |
| D | 6460 | 289 | 4.473684% |
Noise dominated data is calculated using 1-second bins in cleaned event files. If a bin has >2000 counts, and if more than 50% of those come from <1% of pixels, then it is considered to be noise-dominated and hence unusable.
| Quadrant | # 1 sec bins | Bins with >0 counts | Bins with >2000 counts | High rate bins dominated by noise | Noise dominated (total time) | Noise dominated (detector-on time) | Marked lightcurve |
|---|---|---|---|---|---|---|---|
| A | 7615 | 6461 | 201 | 201 | 2.64% | 3.11% | 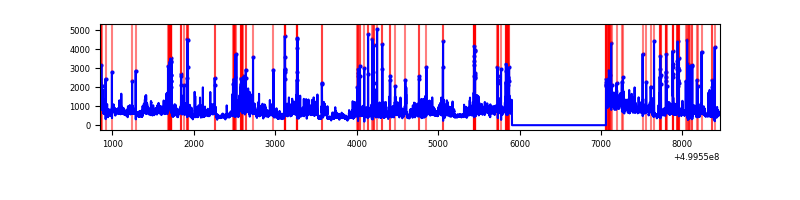 |
| B | 7615 | 6461 | 118 | 118 | 1.55% | 1.83% | 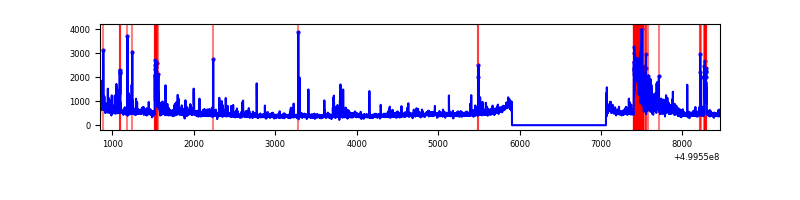 |
| C | 7615 | 6461 | 379 | 379 | 4.98% | 5.87% | 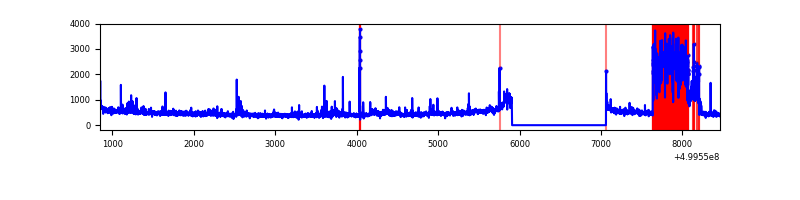 |
| D | 7614 | 6460 | 244 | 244 | 3.20% | 3.78% | 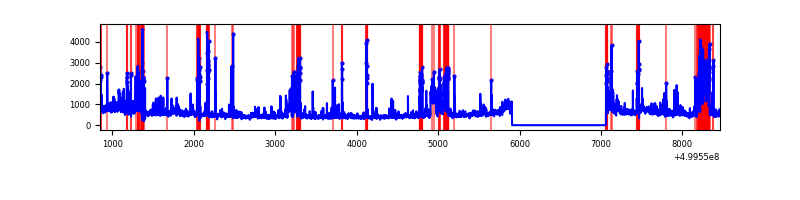 |
Top three noisy pixels from each quadrant. If the there are fewer than three noisy pixels in the level2.evt file, extra rows are filled as -1
| Pixel properties | Quadrant properties | ||||||
|---|---|---|---|---|---|---|---|
| Quadrant | DetID | PixID | Counts | Sigma | Mean | Median | Sigma |
| A | 3 | 14 | 1542549 | 8641.9 | 716 | 697 | 178.4 |
| A | 11 | 3 | 472639 | 2645.18 | 716 | 697 | 178.4 |
| A | 13 | 248 | 137936 | 769.21 | 716 | 697 | 178.4 |
| B | 6 | 255 | 368025 | 2411.4 | 718 | 695 | 152.3 |
| B | 10 | 14 | 126417 | 825.32 | 718 | 695 | 152.3 |
| B | 10 | 247 | 104973 | 684.55 | 718 | 695 | 152.3 |
| C | 4 | 5 | 1206110 | 6296.52 | 698 | 692 | 191.4 |
| C | 12 | 249 | 26041 | 132.41 | 698 | 692 | 191.4 |
| C | 7 | 220 | 24891 | 126.4 | 698 | 692 | 191.4 |
| D | 3 | 12 | 699615 | 3529.7 | 698 | 668 | 198.0 |
| D | 15 | 94 | 420592 | 2120.63 | 698 | 668 | 198.0 |
| D | 2 | 172 | 378463 | 1907.88 | 698 | 668 | 198.0 |
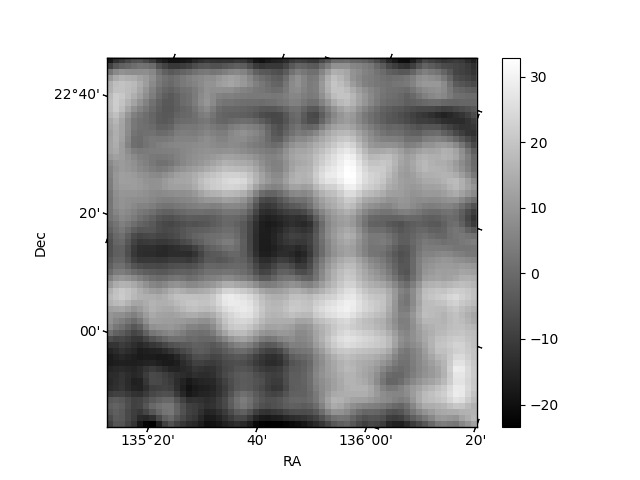
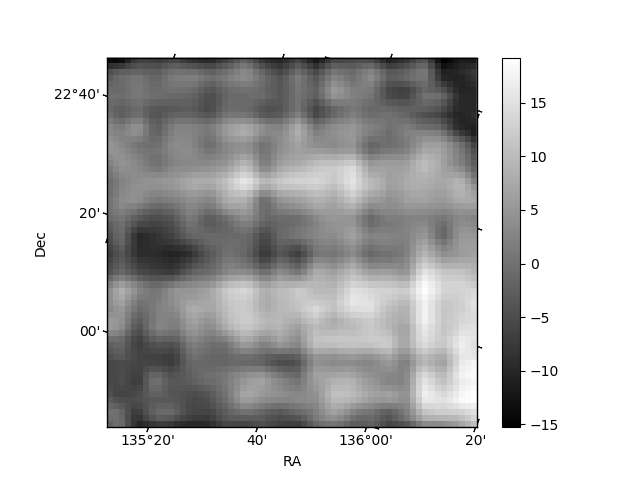
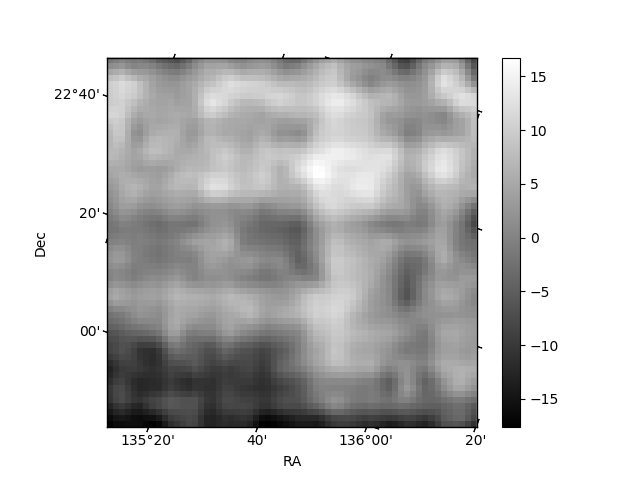
Histogram calculated using DETX and DETY for each event in the final _common_clean file
| Quadrant A | 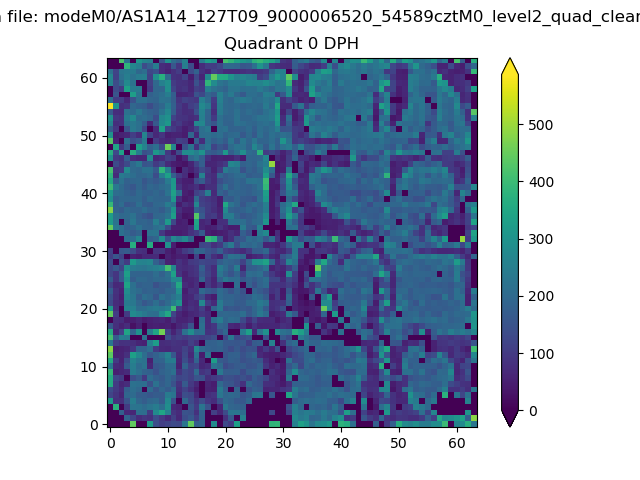 |
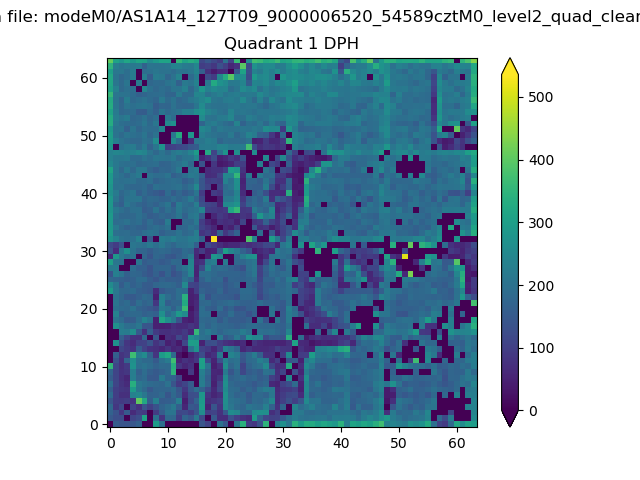 |
Quadrant B |
|---|---|---|---|
| Quadrant D | 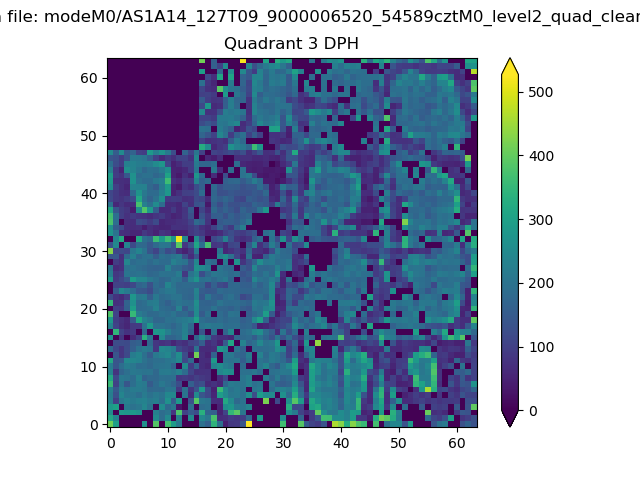 |
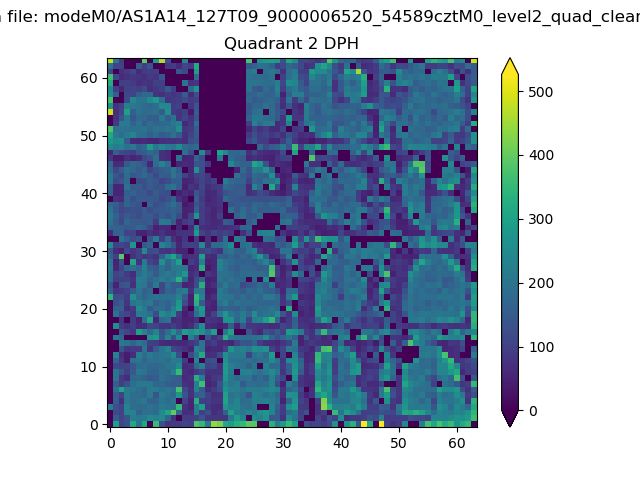 |
Quadrant C |
| Plot type | Count rate plots | Images |
|---|---|---|
| Comparison with Poisson distribution Blue bars denote a histogram of data divided into 1 sec bins. Red curve is a Poisson curve with rate = median count rate of data. |
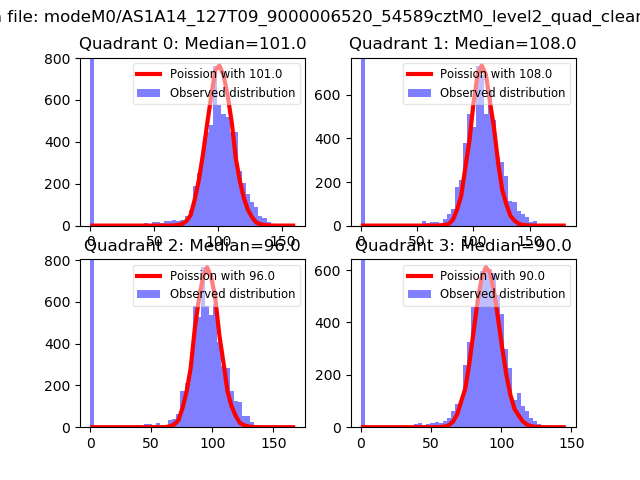 |
 |
| Quadrant-wise count rates Data is divided into 100 sec bins |
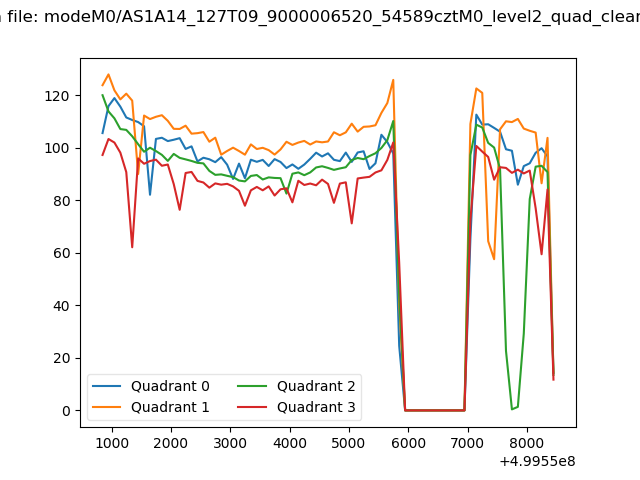 |
|
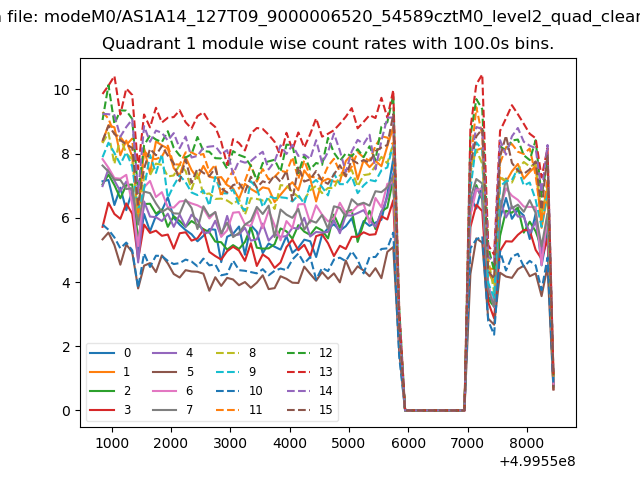
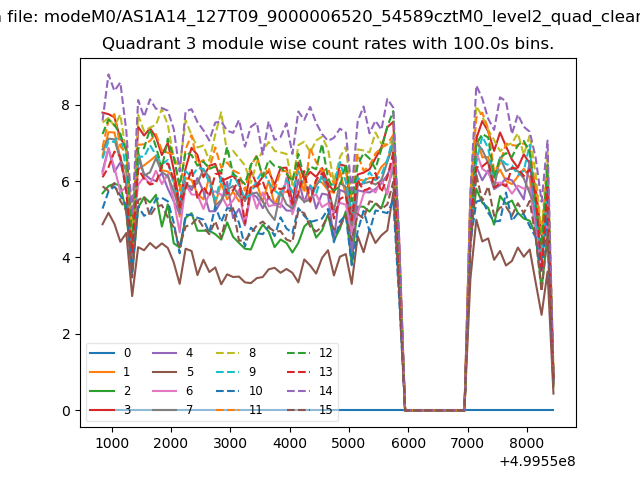
| Module-wise count rates for Quadrant A Data is divided into 100 sec bins |
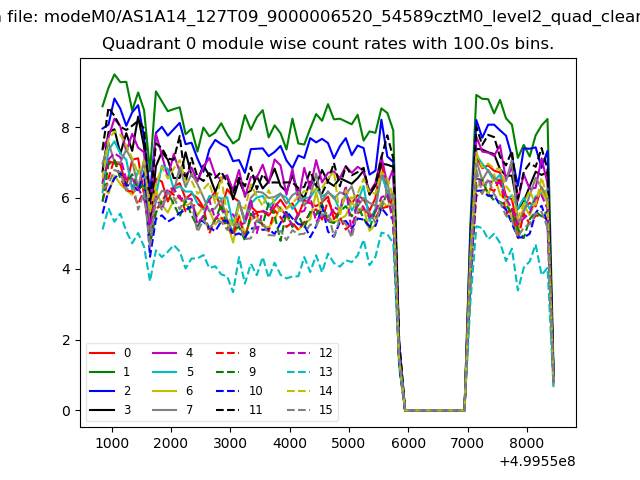 |
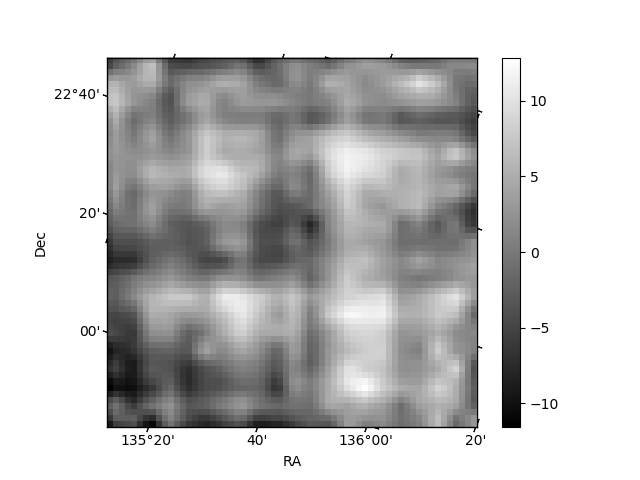 |
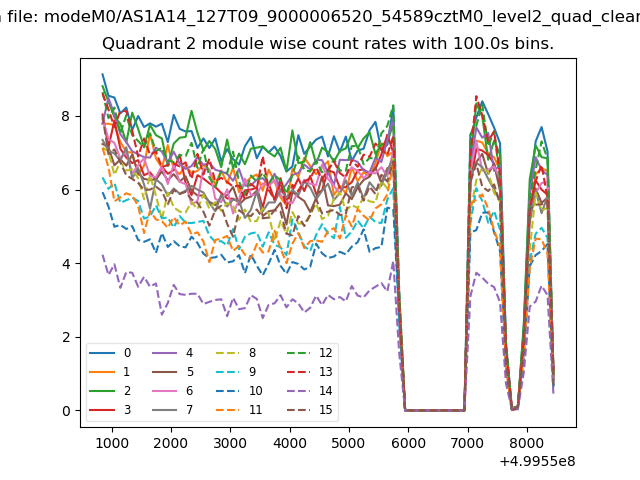
| Module-wise count rates for Quadrant B Data is divided into 100 sec bins |
 |
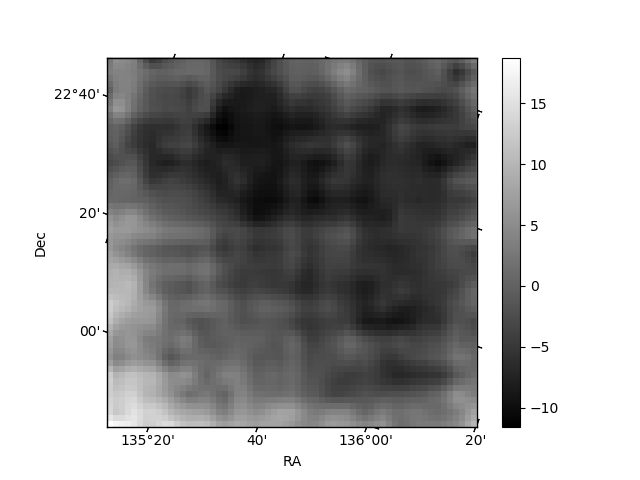 |
| Module-wise count rates for Quadrant C Data is divided into 100 sec bins |
 |
 |
| Module-wise count rates for Quadrant D Data is divided into 100 sec bins |
 |
 |
| Parameter | Plot |
|---|---|
| CZT HV Monitor | 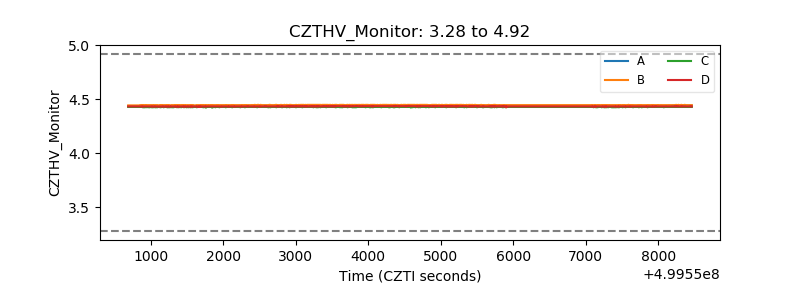 |
| D_VDD | 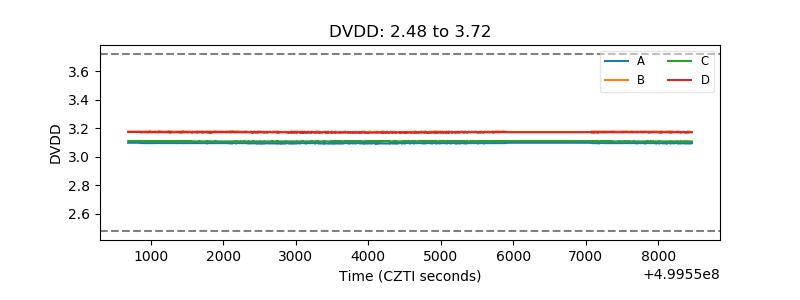 |
| Temperature 1 | 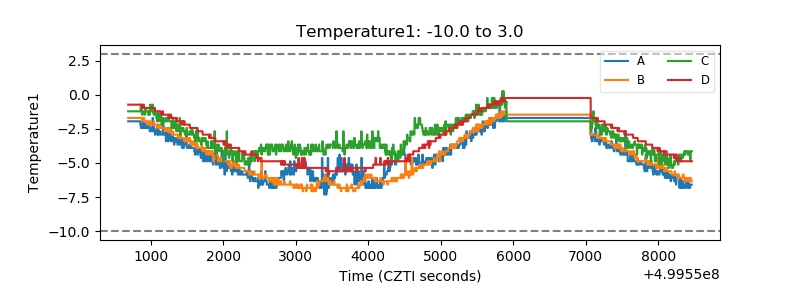 |
| Veto HV Monitor | 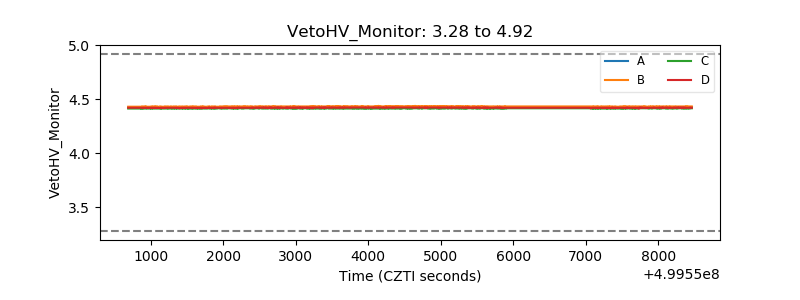 |
| Veto LLD | 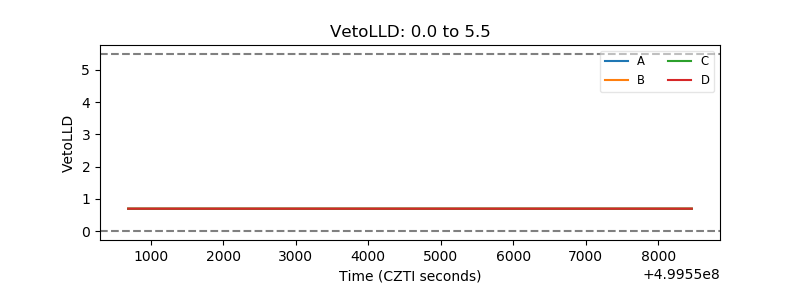 |
| Alpha Counter | 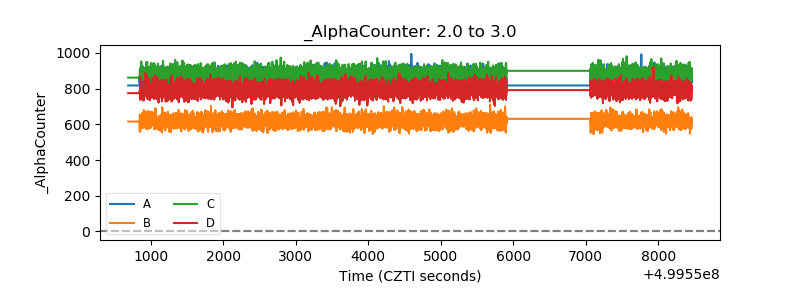 |
| _CPM_Rate | 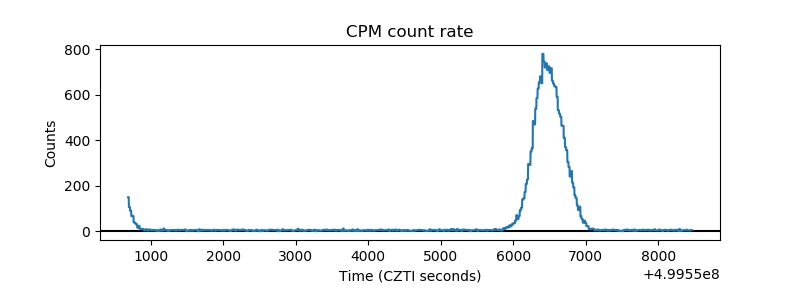 |
| CZT Counter | 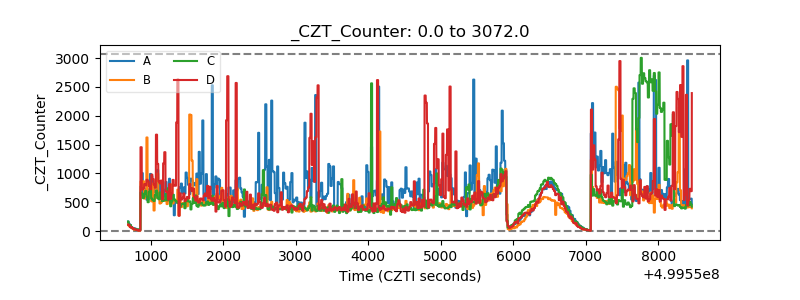 |
| +2.5 Volts monitor |  |
| +5 Volts monitor |  |
| _ROLL_ROT | 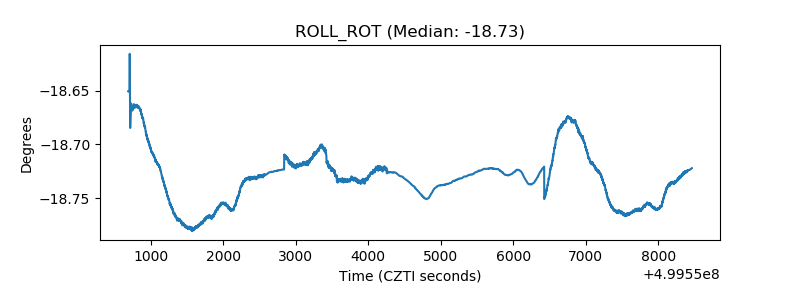 |
| _Roll_DEC | 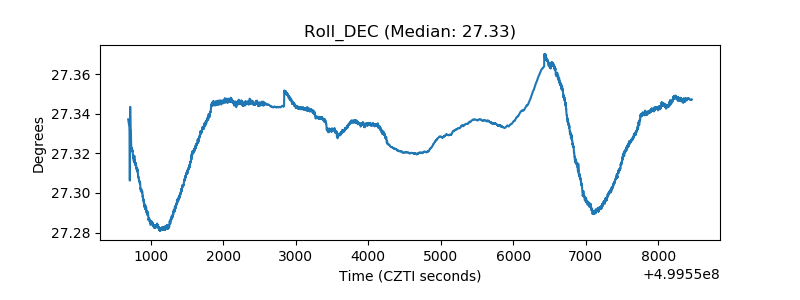 |
| _Roll_RA | 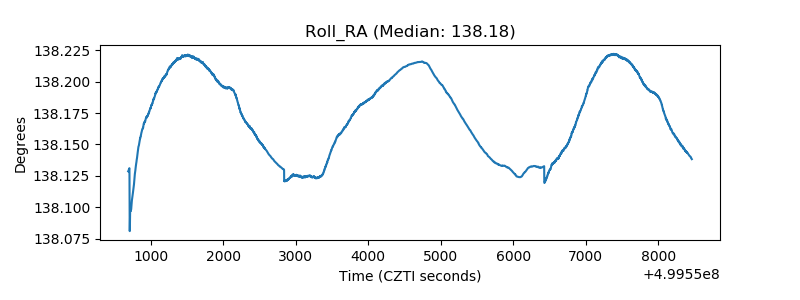 |
| Veto Counter | 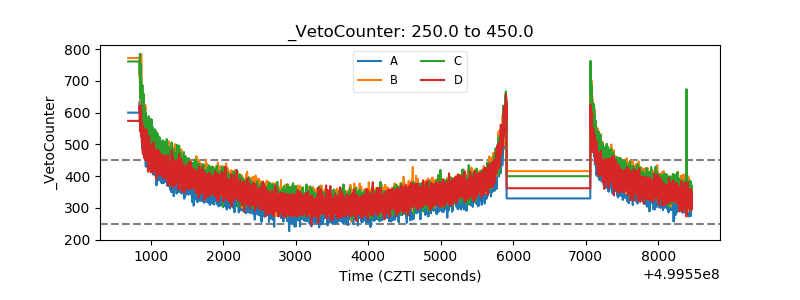 |