| Param | Original file | Final file |
|---|---|---|
| Filename | modeM0/AS1A14_127T09_9000006520_54590cztM0_level2.fits | modeM0/AS1A14_127T09_9000006520_54590cztM0_level2_quad_clean.evt |
| Size (bytes) | 462,890,880 | 93,833,280 |
| Size | 441.4 MB | 89.5 MB |
| Events in quadrant A | 4,327,156 | 620,977 |
| Events in quadrant B | 3,531,292 | 665,503 |
| Events in quadrant C | 3,976,770 | 565,857 |
| Events in quadrant D | 4,798,648 | 539,309 |
| Mode M0 | |||
|---|---|---|---|
| Quadrant | BADHDUFLAG | Total packets | Discarded packets |
| A | 0 | 17319 | 1 |
| B | 0 | 15269 | 1 |
| C | 0 | 16483 | 1 |
| D | 0 | 18730 | 1 |
| Mode SS | |||
|---|---|---|---|
| Quadrant | BADHDUFLAG | Total packets | Discarded packets |
| A | 0 | 132 | 0 |
| B | 0 | 132 | 0 |
| C | 0 | 132 | 0 |
| D | 0 | 132 | 0 |
| Mode M9 | |||
|---|---|---|---|
| Quadrant | BADHDUFLAG | Total packets | Discarded packets |
| A | 0 | 11 | 0 |
| B | 0 | 11 | 0 |
| C | 0 | 11 | 0 |
| D | 0 | 11 | 0 |
| Quadrant | Total seconds | Saturated seconds | Saturation percentage |
|---|---|---|---|
| A | 6442 | 232 | 3.601366% |
| B | 6442 | 208 | 3.228811% |
| C | 6443 | 416 | 6.456620% |
| D | 6442 | 424 | 6.581807% |
Noise dominated data is calculated using 1-second bins in cleaned event files. If a bin has >2000 counts, and if more than 50% of those come from <1% of pixels, then it is considered to be noise-dominated and hence unusable.
| Quadrant | # 1 sec bins | Bins with >0 counts | Bins with >2000 counts | High rate bins dominated by noise | Noise dominated (total time) | Noise dominated (detector-on time) | Marked lightcurve |
|---|---|---|---|---|---|---|---|
| A | 7522 | 6443 | 138 | 138 | 1.83% | 2.14% | 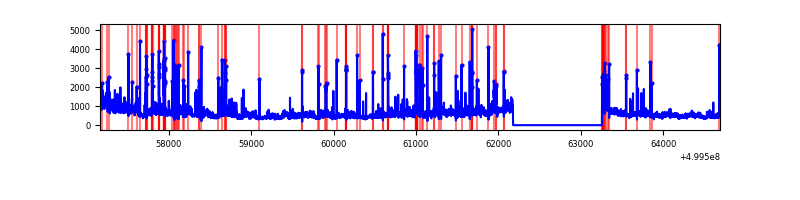 |
| B | 7522 | 6443 | 109 | 109 | 1.45% | 1.69% | 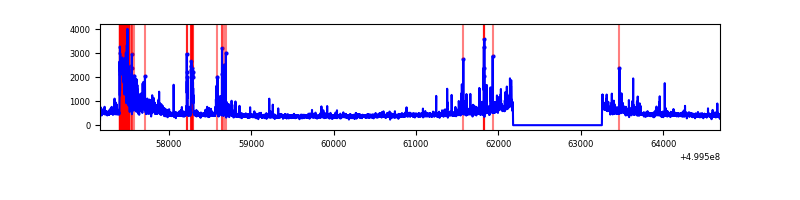 |
| C | 7523 | 6444 | 380 | 380 | 5.05% | 5.90% | 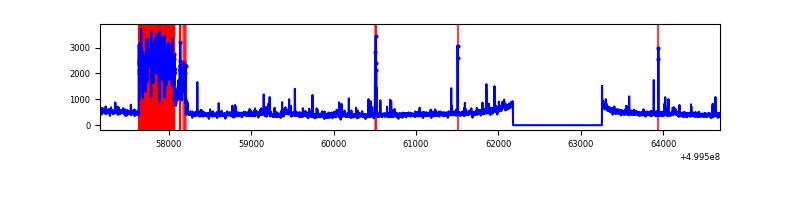 |
| D | 7522 | 6443 | 349 | 349 | 4.64% | 5.42% | 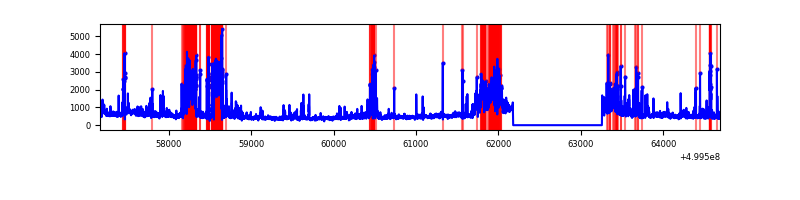 |
Top three noisy pixels from each quadrant. If the there are fewer than three noisy pixels in the level2.evt file, extra rows are filled as -1
| Pixel properties | Quadrant properties | ||||||
|---|---|---|---|---|---|---|---|
| Quadrant | DetID | PixID | Counts | Sigma | Mean | Median | Sigma |
| A | 3 | 14 | 1050384 | 6058.61 | 697 | 678 | 173.3 |
| A | 11 | 3 | 467860 | 2696.44 | 697 | 678 | 173.3 |
| A | 4 | 3 | 45813 | 260.5 | 697 | 678 | 173.3 |
| B | 6 | 255 | 450630 | 3010.08 | 697 | 673 | 149.5 |
| B | 10 | 14 | 155309 | 1034.47 | 697 | 673 | 149.5 |
| B | 10 | 247 | 72568 | 480.96 | 697 | 673 | 149.5 |
| C | 4 | 5 | 1190464 | 6406.48 | 673 | 667 | 185.7 |
| C | 7 | 220 | 36678 | 193.9 | 673 | 667 | 185.7 |
| C | 12 | 250 | 34310 | 181.15 | 673 | 667 | 185.7 |
| D | 3 | 12 | 794614 | 4194.0 | 665 | 637 | 189.3 |
| D | 15 | 94 | 543405 | 2867.05 | 665 | 637 | 189.3 |
| D | 2 | 172 | 410247 | 2163.67 | 665 | 637 | 189.3 |
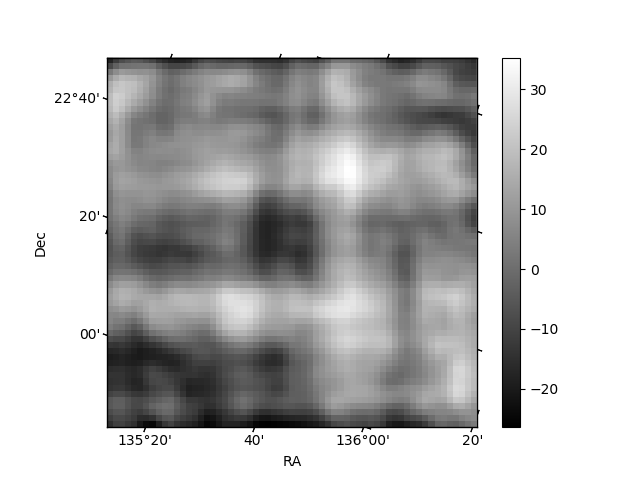
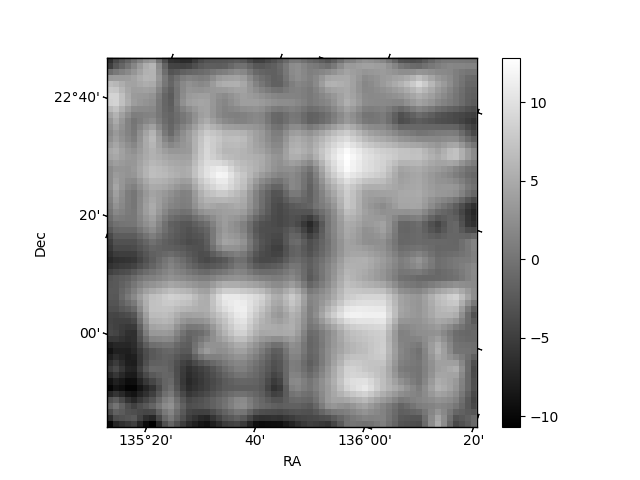
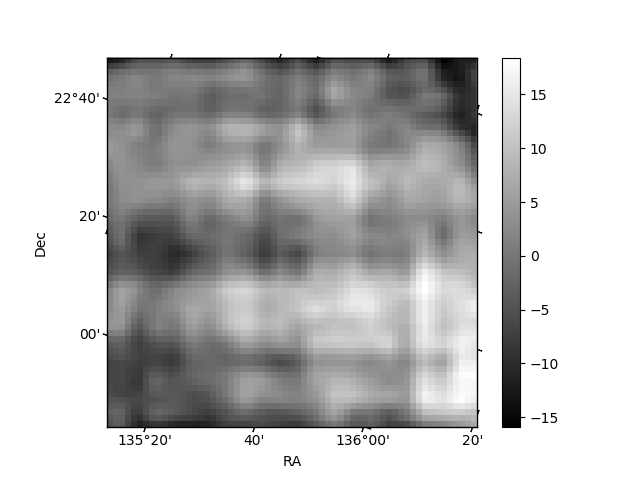
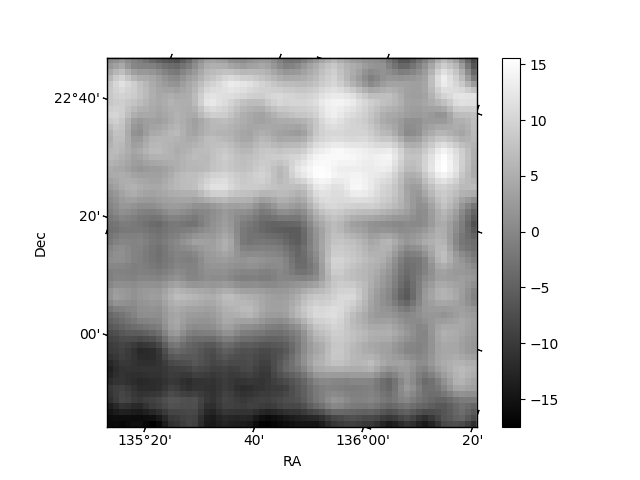
Histogram calculated using DETX and DETY for each event in the final _common_clean file
| Quadrant A | 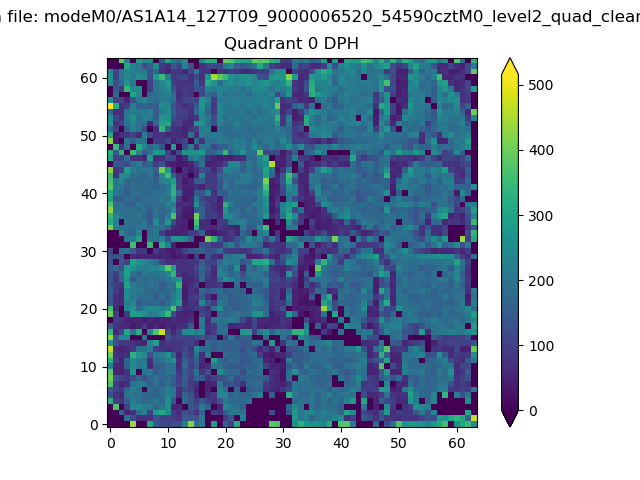 |
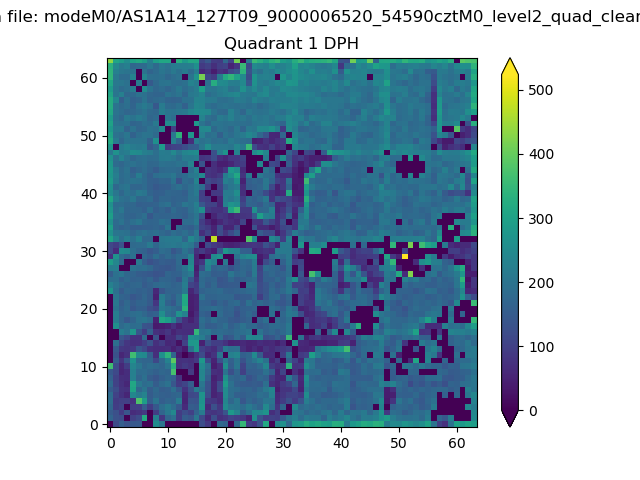 |
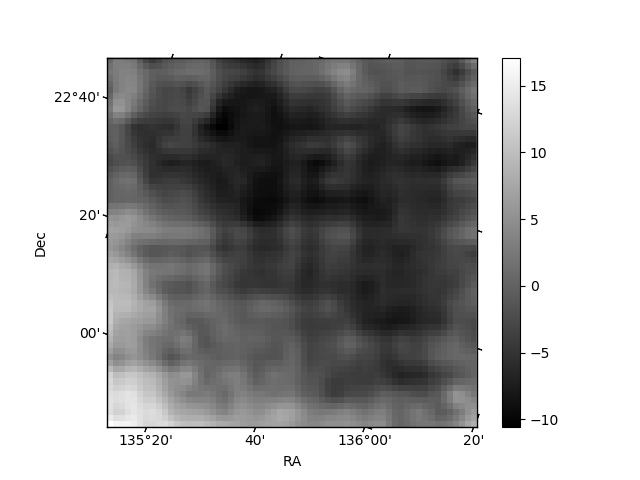
Quadrant B |
|---|---|---|---|
| Quadrant D | 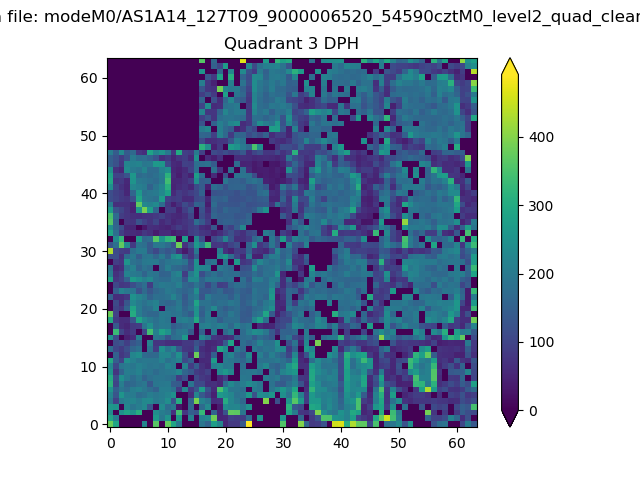 |
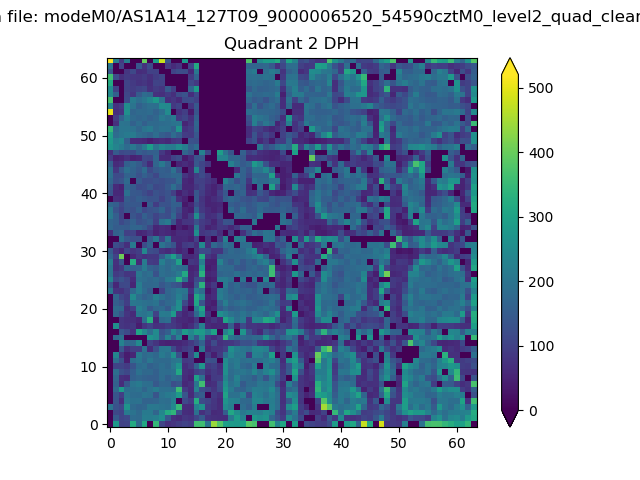 |
Quadrant C |
| Plot type | Count rate plots | Images |
|---|---|---|
| Comparison with Poisson distribution Blue bars denote a histogram of data divided into 1 sec bins. Red curve is a Poisson curve with rate = median count rate of data. |
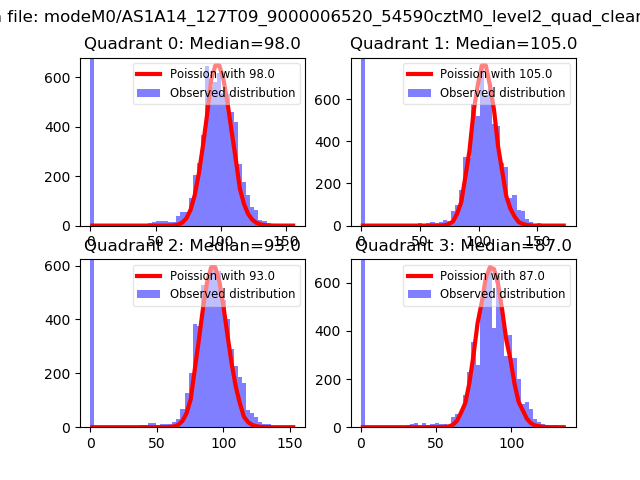 |
 |
| Quadrant-wise count rates Data is divided into 100 sec bins |
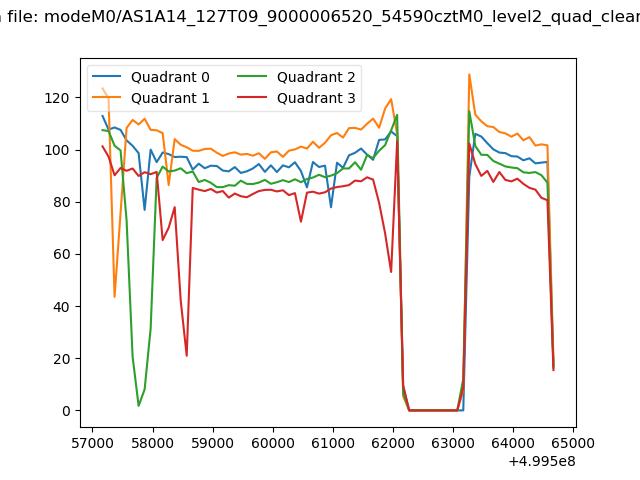 |
|
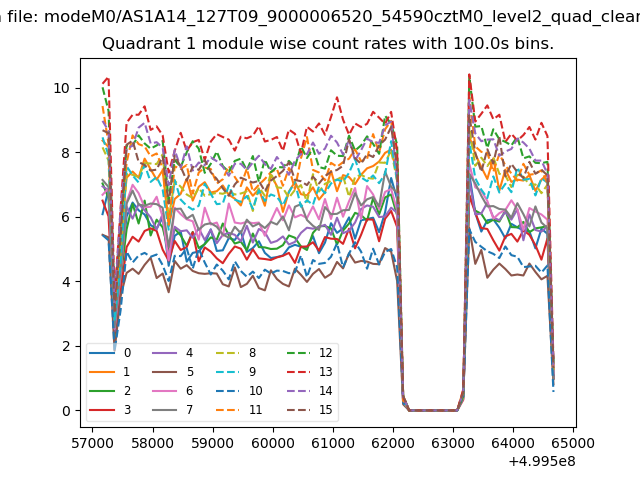
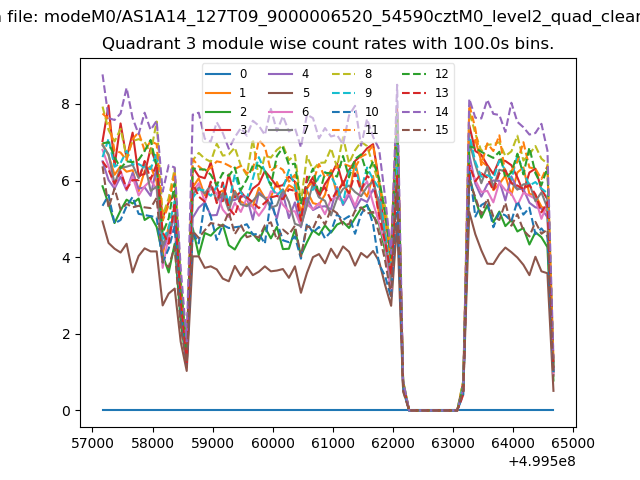
| Module-wise count rates for Quadrant A Data is divided into 100 sec bins |
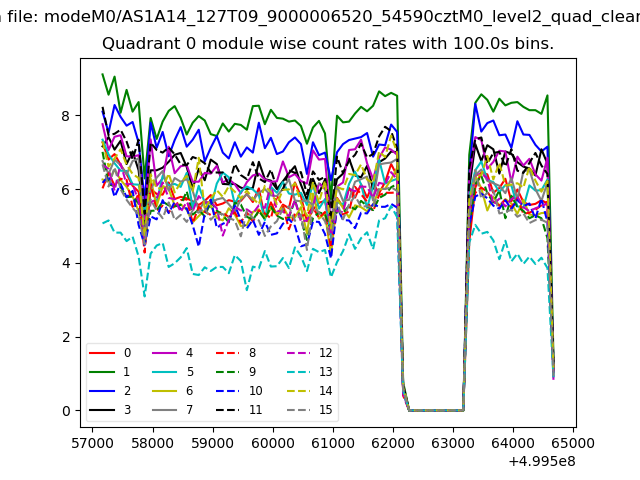 |
 |
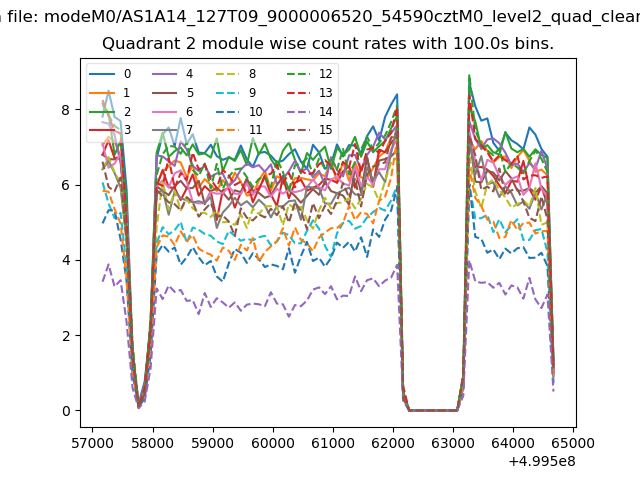
| Module-wise count rates for Quadrant B Data is divided into 100 sec bins |
 |
 |
| Module-wise count rates for Quadrant C Data is divided into 100 sec bins |
 |
 |
| Module-wise count rates for Quadrant D Data is divided into 100 sec bins |
 |
 |
| Parameter | Plot |
|---|---|
| CZT HV Monitor | 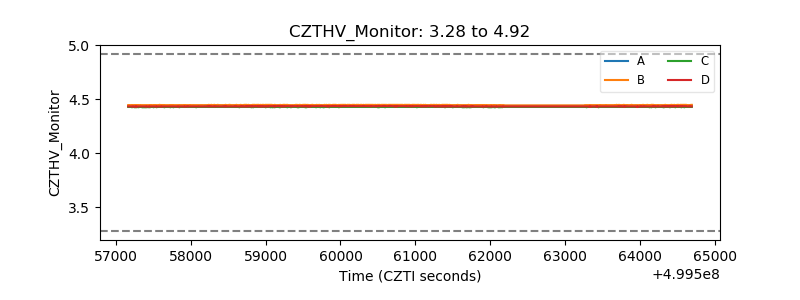 |
| D_VDD | 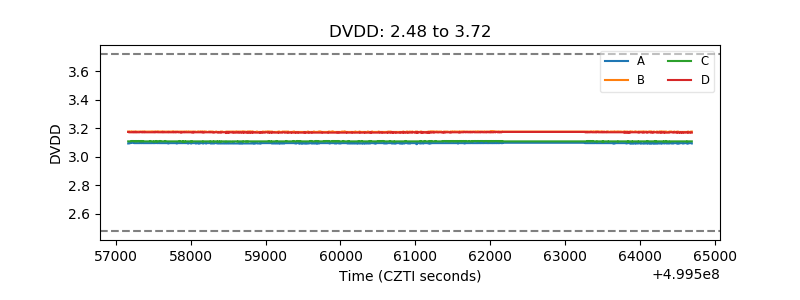 |
| Temperature 1 | 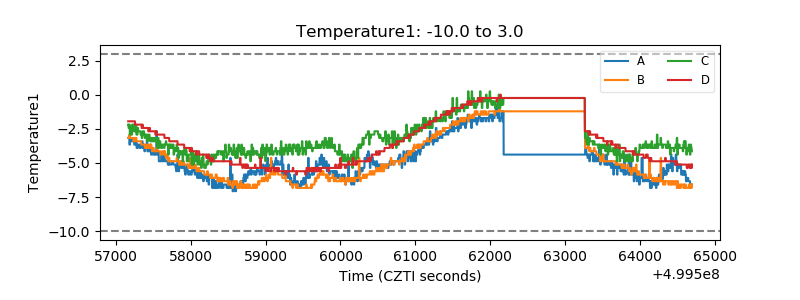 |
| Veto HV Monitor | 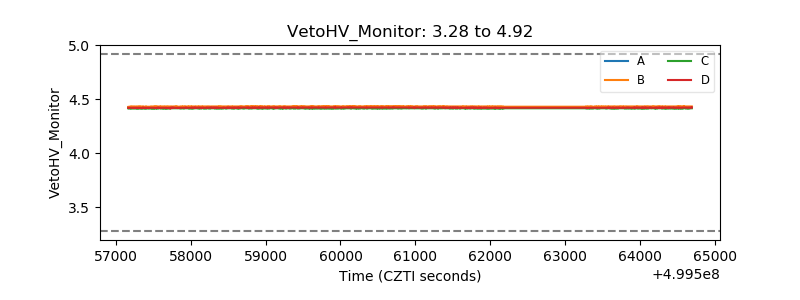 |
| Veto LLD | 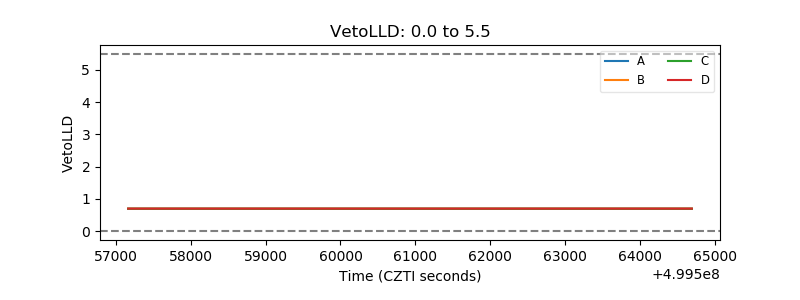 |
| Alpha Counter | 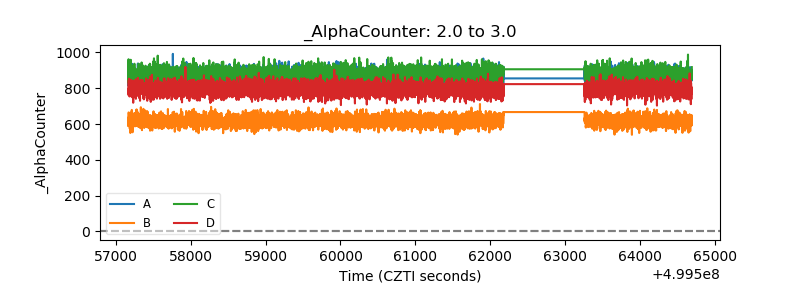 |
| _CPM_Rate | 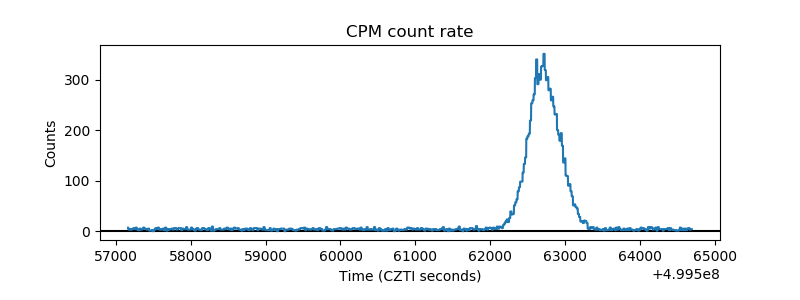 |
| CZT Counter | 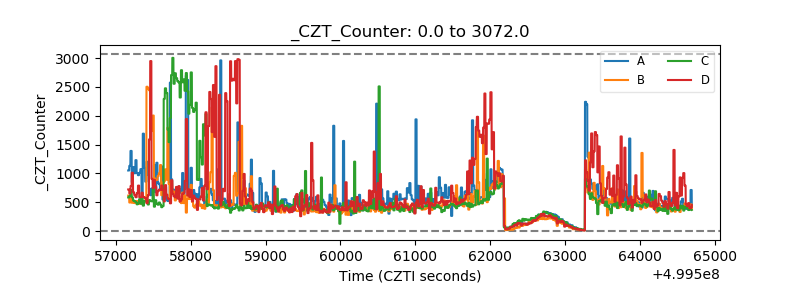 |
| +2.5 Volts monitor | 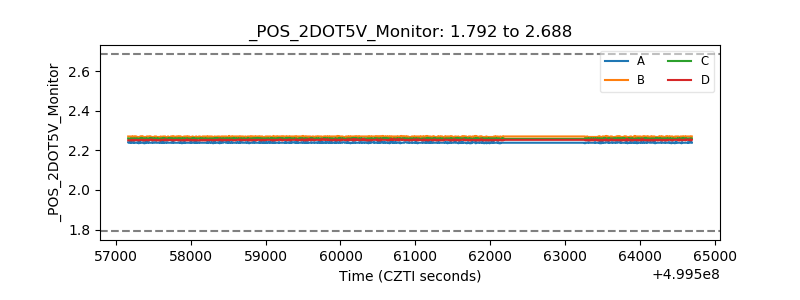 |
| +5 Volts monitor | 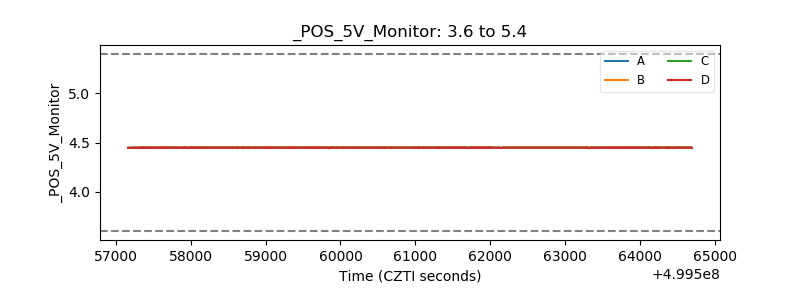 |
| _ROLL_ROT | 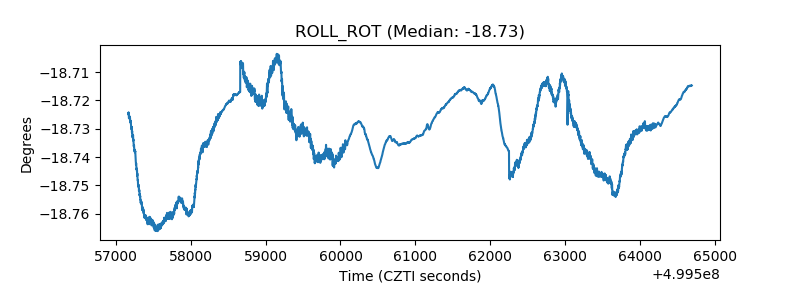 |
| _Roll_DEC | 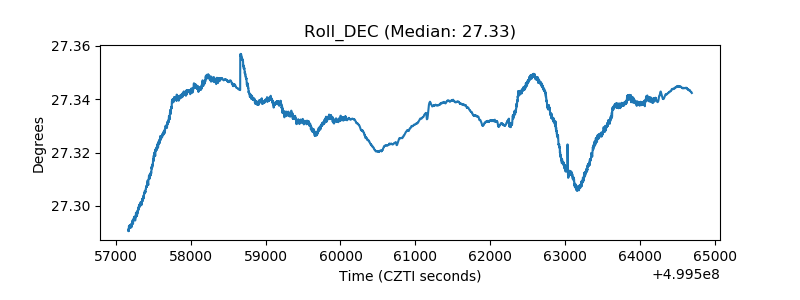 |
| _Roll_RA | 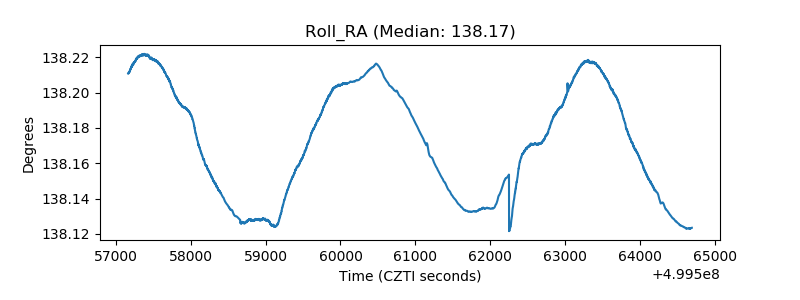 |
| Veto Counter | 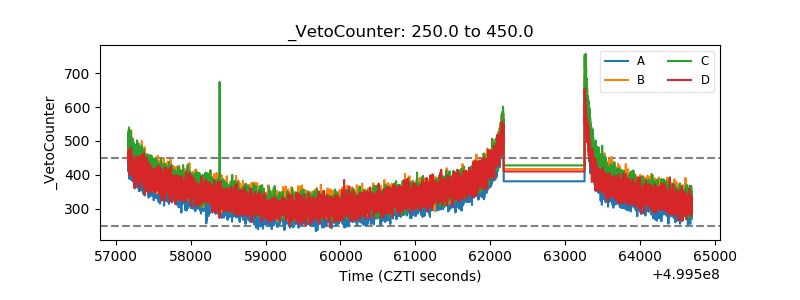 |