| Param | Original file | Final file |
|---|---|---|
| Filename | modeM0/AS1A14_127T09_9000006520_54592cztM0_level2.fits | modeM0/AS1A14_127T09_9000006520_54592cztM0_level2_quad_clean.evt |
| Size (bytes) | 596,514,240 | 116,982,720 |
| Size | 568.9 MB | 111.6 MB |
| Events in quadrant A | 6,893,852 | 741,864 |
| Events in quadrant B | 4,130,520 | 818,559 |
| Events in quadrant C | 4,955,587 | 729,623 |
| Events in quadrant D | 5,471,218 | 687,445 |
| Mode M0 | |||
|---|---|---|---|
| Quadrant | BADHDUFLAG | Total packets | Discarded packets |
| A | 0 | 26319 | 2 |
| B | 0 | 18458 | 2 |
| C | 0 | 20483 | 2 |
| D | 0 | 21994 | 3 |
| Mode SS | |||
|---|---|---|---|
| Quadrant | BADHDUFLAG | Total packets | Discarded packets |
| A | 0 | 168 | 0 |
| B | 0 | 168 | 0 |
| C | 0 | 168 | 0 |
| D | 0 | 168 | 0 |
| Mode M9 | |||
|---|---|---|---|
| Quadrant | BADHDUFLAG | Total packets | Discarded packets |
| A | 0 | 11 | 0 |
| B | 0 | 11 | 0 |
| C | 0 | 11 | 0 |
| D | 0 | 11 | 0 |
| Quadrant | Total seconds | Saturated seconds | Saturation percentage |
|---|---|---|---|
| A | 8125 | 623 | 7.667692% |
| B | 8125 | 268 | 3.298462% |
| C | 8125 | 237 | 2.916923% |
| D | 8125 | 230 | 2.830769% |
Noise dominated data is calculated using 1-second bins in cleaned event files. If a bin has >2000 counts, and if more than 50% of those come from <1% of pixels, then it is considered to be noise-dominated and hence unusable.
| Quadrant | # 1 sec bins | Bins with >0 counts | Bins with >2000 counts | High rate bins dominated by noise | Noise dominated (total time) | Noise dominated (detector-on time) | Marked lightcurve |
|---|---|---|---|---|---|---|---|
| A | 9205 | 8128 | 339 | 339 | 3.68% | 4.17% | 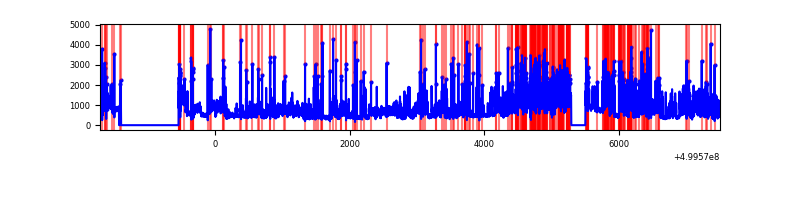 |
| B | 9205 | 8128 | 32 | 32 | 0.35% | 0.39% | 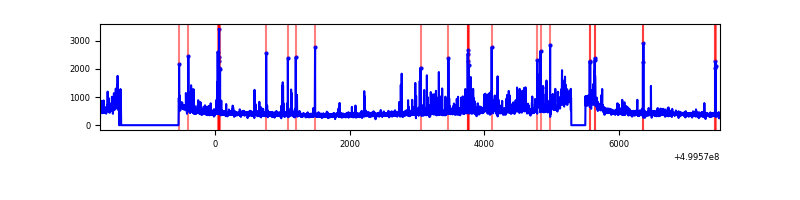 |
| C | 9205 | 8128 | 156 | 156 | 1.69% | 1.92% | 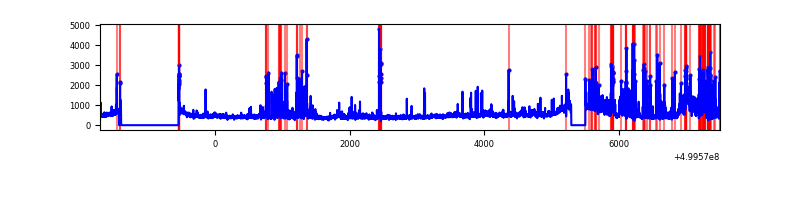 |
| D | 9205 | 8128 | 163 | 163 | 1.77% | 2.01% | 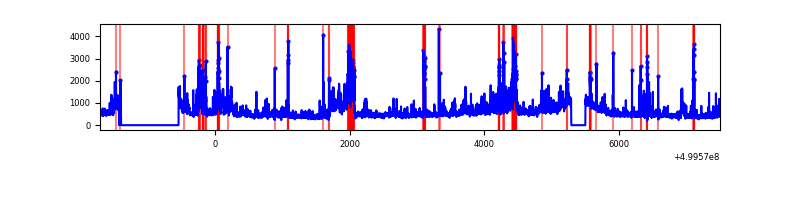 |
Top three noisy pixels from each quadrant. If the there are fewer than three noisy pixels in the level2.evt file, extra rows are filled as -1
| Pixel properties | Quadrant properties | ||||||
|---|---|---|---|---|---|---|---|
| Quadrant | DetID | PixID | Counts | Sigma | Mean | Median | Sigma |
| A | 3 | 14 | 2869465 | 13055.75 | 887 | 865 | 219.7 |
| A | 11 | 3 | 420547 | 1910.08 | 887 | 865 | 219.7 |
| A | 4 | 3 | 68649 | 308.5 | 887 | 865 | 219.7 |
| B | 10 | 14 | 234580 | 1196.58 | 902 | 869 | 195.3 |
| B | 10 | 247 | 127531 | 648.5 | 902 | 869 | 195.3 |
| B | 4 | 169 | 41580 | 208.44 | 902 | 869 | 195.3 |
| C | 13 | 3 | 506718 | 2098.38 | 882 | 877 | 241.1 |
| C | 9 | 38 | 316060 | 1307.47 | 882 | 877 | 241.1 |
| C | 15 | 254 | 245805 | 1016.03 | 882 | 877 | 241.1 |
| D | 3 | 12 | 655732 | 2617.05 | 876 | 836 | 250.2 |
| D | 2 | 172 | 423890 | 1690.58 | 876 | 836 | 250.2 |
| D | 8 | 160 | 298441 | 1189.27 | 876 | 836 | 250.2 |
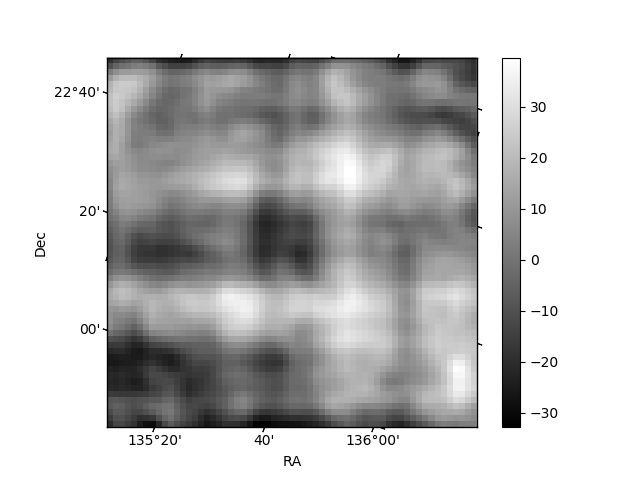
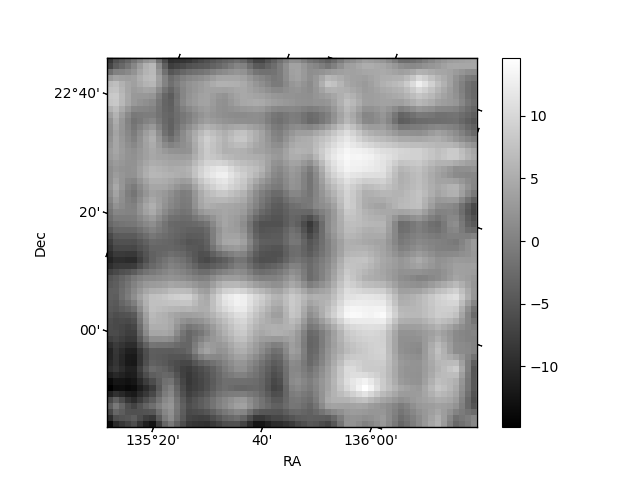
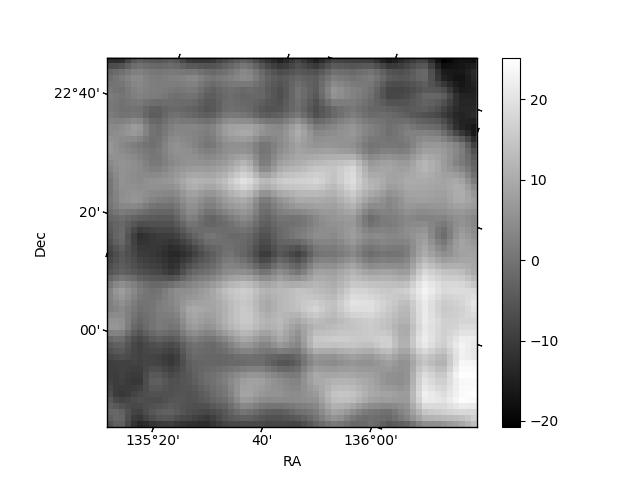
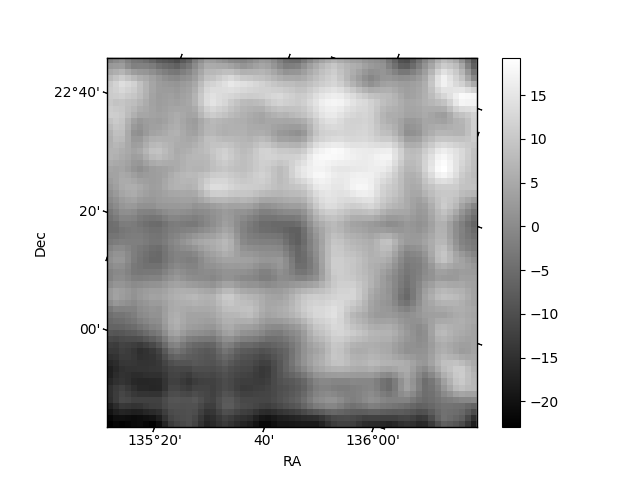
Histogram calculated using DETX and DETY for each event in the final _common_clean file
| Quadrant A | 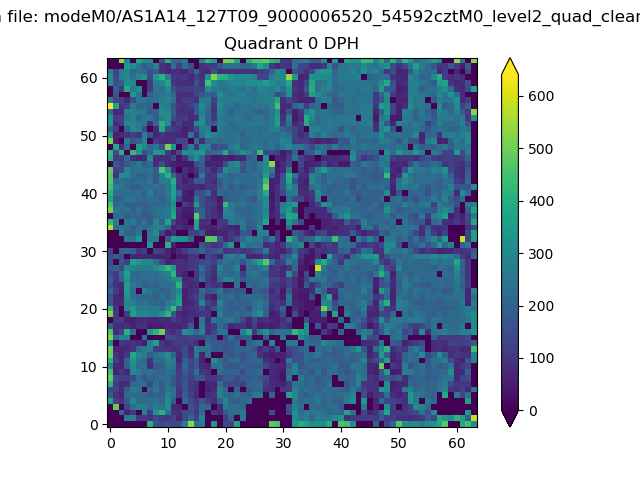 |
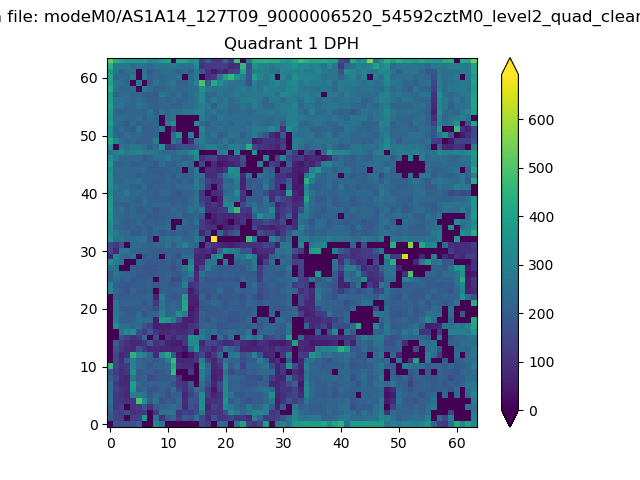 |
Quadrant B |
|---|---|---|---|
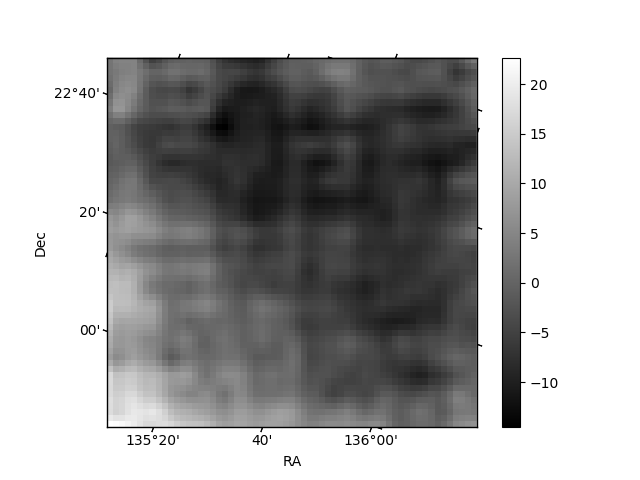
| Quadrant D | 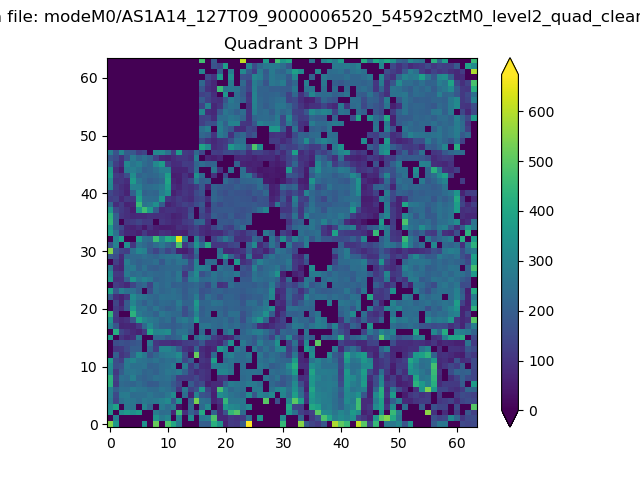 |
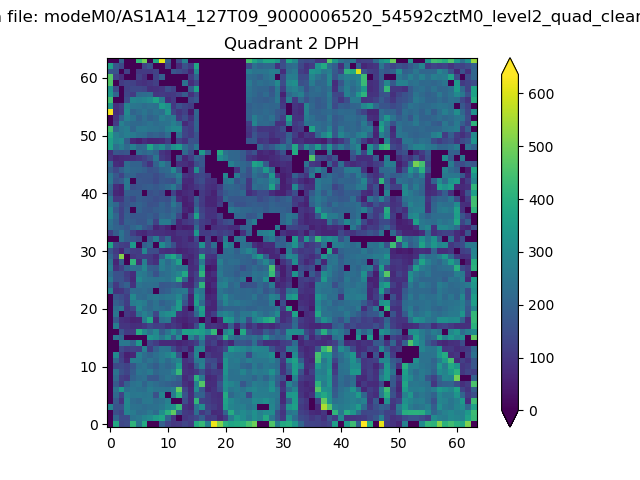 |
Quadrant C |
| Plot type | Count rate plots | Images |
|---|---|---|
| Comparison with Poisson distribution Blue bars denote a histogram of data divided into 1 sec bins. Red curve is a Poisson curve with rate = median count rate of data. |
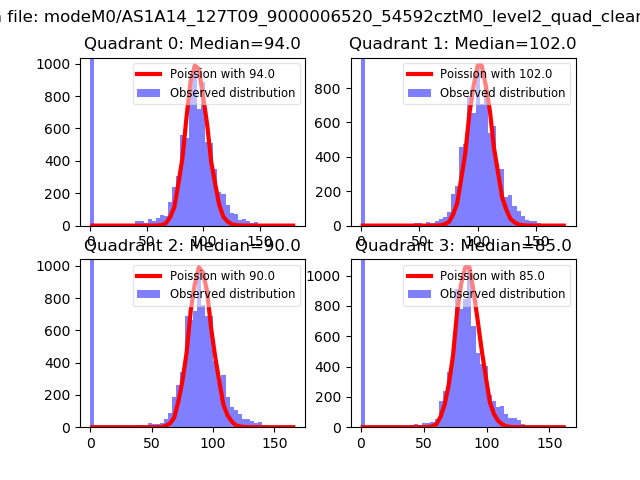 |
 |
| Quadrant-wise count rates Data is divided into 100 sec bins |
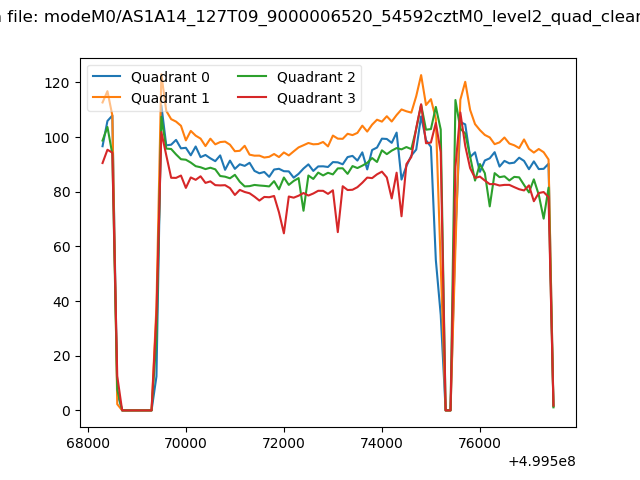 |
|
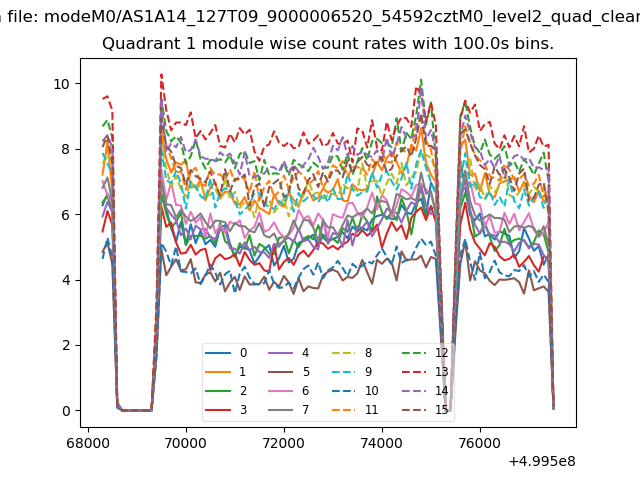
| Module-wise count rates for Quadrant A Data is divided into 100 sec bins |
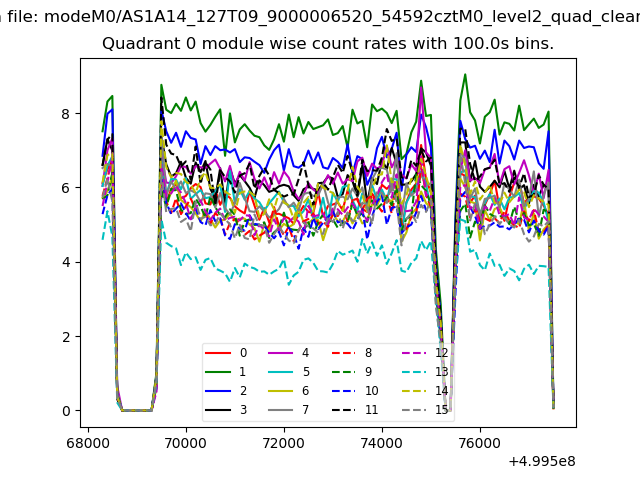 |
 |
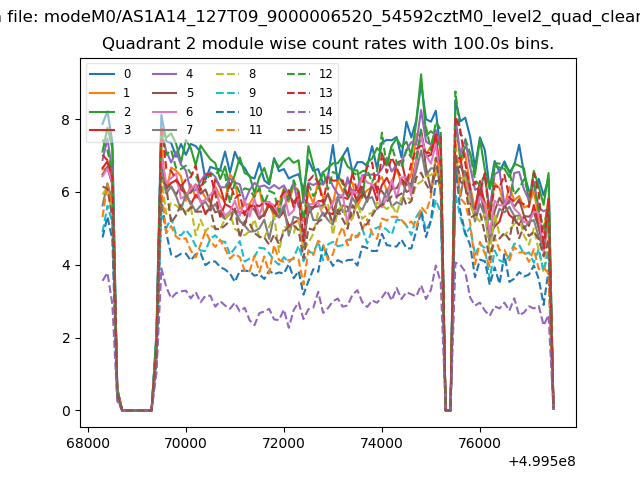
| Module-wise count rates for Quadrant B Data is divided into 100 sec bins |
 |
 |
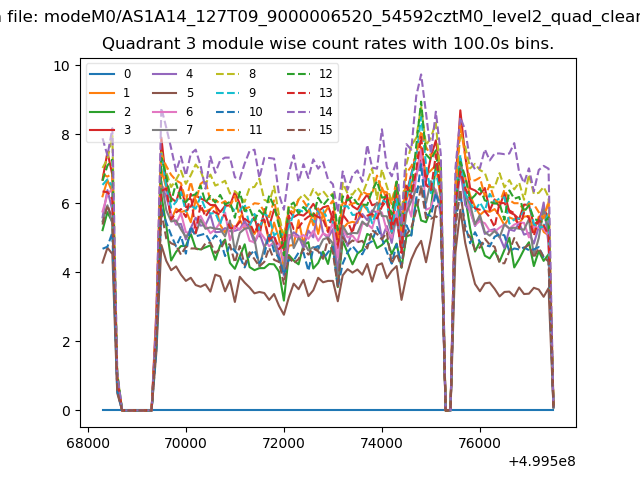
| Module-wise count rates for Quadrant C Data is divided into 100 sec bins |
 |
 |
| Module-wise count rates for Quadrant D Data is divided into 100 sec bins |
 |
 |
| Parameter | Plot |
|---|---|
| CZT HV Monitor | 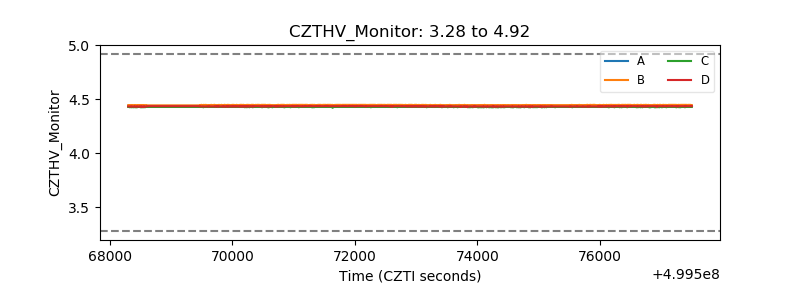 |
| D_VDD | 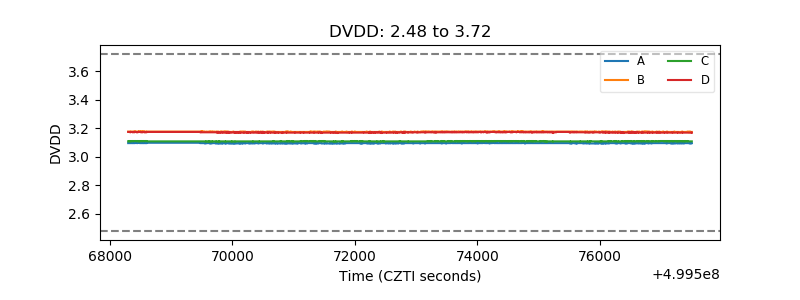 |
| Temperature 1 | 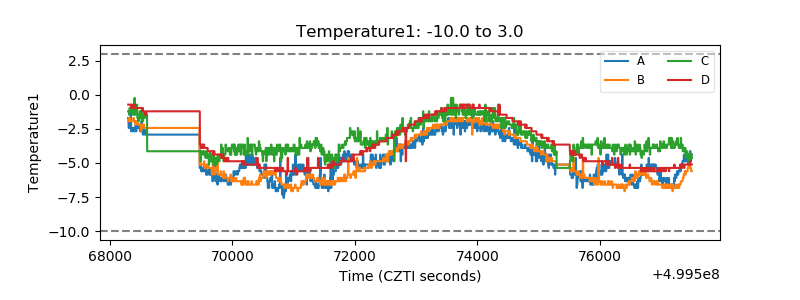 |
| Veto HV Monitor | 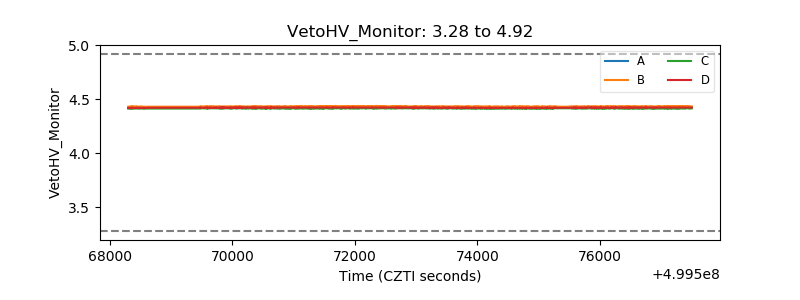 |
| Veto LLD | 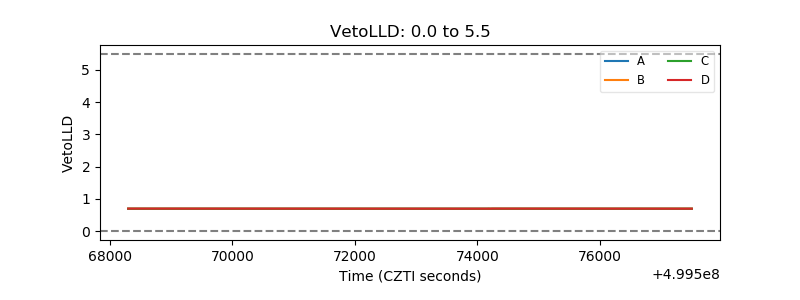 |
| Alpha Counter | 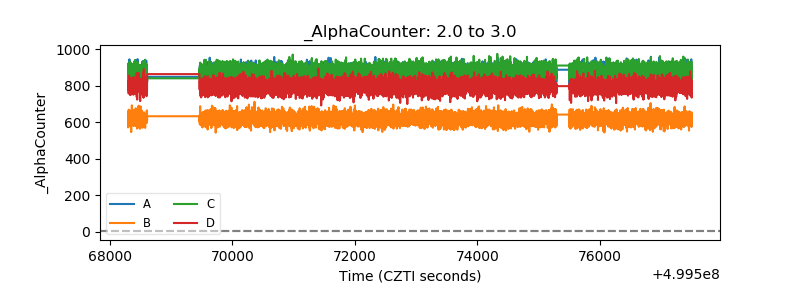 |
| _CPM_Rate | 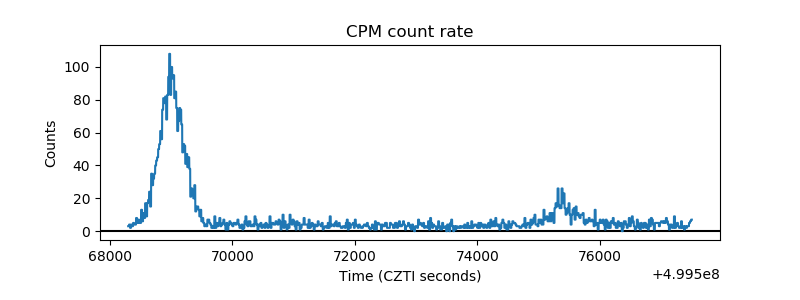 |
| CZT Counter | 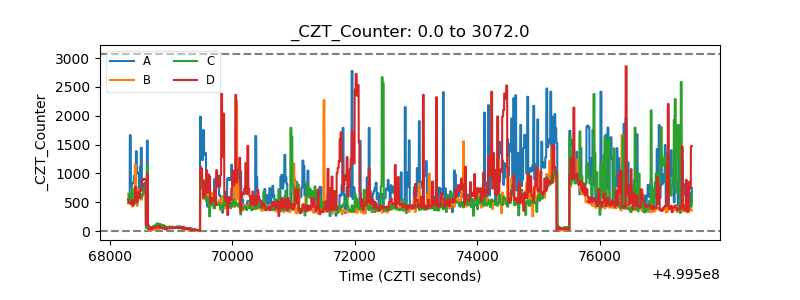 |
| +2.5 Volts monitor |  |
| +5 Volts monitor |  |
| _ROLL_ROT | 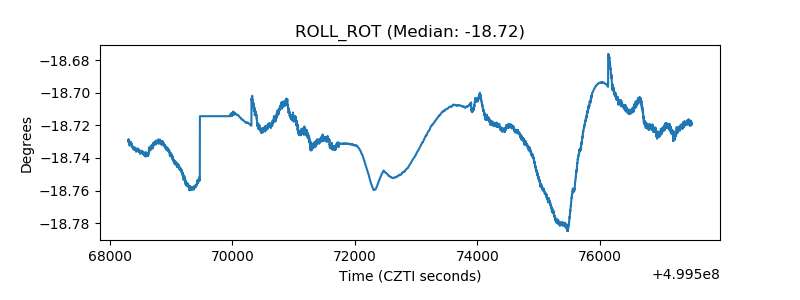 |
| _Roll_DEC | 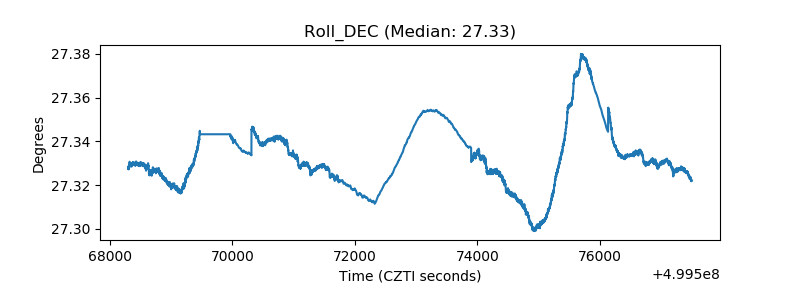 |
| _Roll_RA | 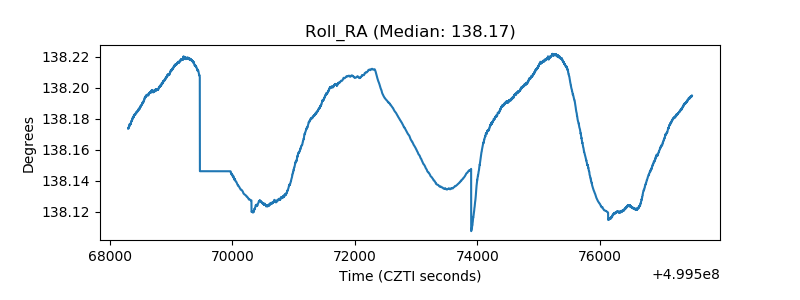 |
| Veto Counter | 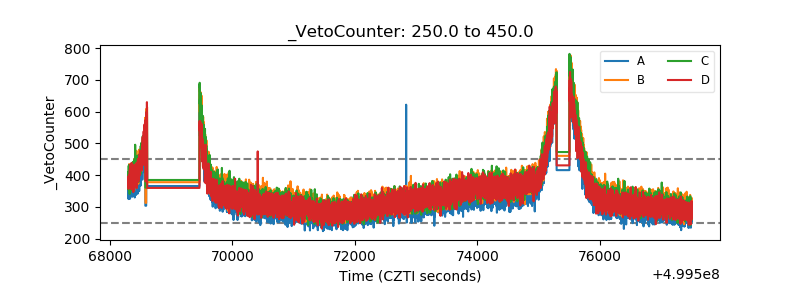 |