| Param | Original file | Final file |
|---|---|---|
| Filename | modeM0/AS1A14_127T09_9000006520_54593cztM0_level2.fits | modeM0/AS1A14_127T09_9000006520_54593cztM0_level2_quad_clean.evt |
| Size (bytes) | 1,743,131,520 | 349,467,840 |
| Size | 1.6 GB | 333.3 MB |
| Events in quadrant A | 18,455,738 | 2,269,850 |
| Events in quadrant B | 12,483,226 | 2,469,536 |
| Events in quadrant C | 15,865,880 | 2,113,031 |
| Events in quadrant D | 15,835,841 | 2,051,153 |
| Mode M0 | |||
|---|---|---|---|
| Quadrant | BADHDUFLAG | Total packets | Discarded packets |
| A | 0 | 71877 | 3 |
| B | 0 | 55550 | 3 |
| C | 0 | 65025 | 3 |
| D | 0 | 64258 | 3 |
| Mode SS | |||
|---|---|---|---|
| Quadrant | BADHDUFLAG | Total packets | Discarded packets |
| A | 0 | 496 | 0 |
| B | 0 | 496 | 0 |
| C | 0 | 496 | 0 |
| D | 0 | 496 | 0 |
| Mode M9 | |||
|---|---|---|---|
| Quadrant | BADHDUFLAG | Total packets | Discarded packets |
| A | 0 | 22 | 0 |
| B | 0 | 22 | 0 |
| C | 0 | 22 | 0 |
| D | 0 | 22 | 0 |
| Quadrant | Total seconds | Saturated seconds | Saturation percentage |
|---|---|---|---|
| A | 24379 | 1278 | 5.242217% |
| B | 24379 | 545 | 2.235531% |
| C | 24380 | 1521 | 6.238720% |
| D | 24380 | 742 | 3.043478% |
Noise dominated data is calculated using 1-second bins in cleaned event files. If a bin has >2000 counts, and if more than 50% of those come from <1% of pixels, then it is considered to be noise-dominated and hence unusable.
| Quadrant | # 1 sec bins | Bins with >0 counts | Bins with >2000 counts | High rate bins dominated by noise | Noise dominated (total time) | Noise dominated (detector-on time) | Marked lightcurve |
|---|---|---|---|---|---|---|---|
| A | 26539 | 24383 | 821 | 821 | 3.09% | 3.37% | 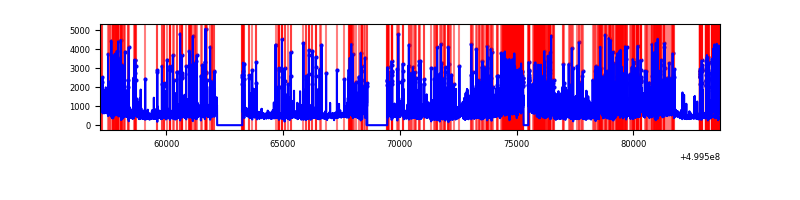 |
| B | 26539 | 24383 | 186 | 186 | 0.70% | 0.76% | 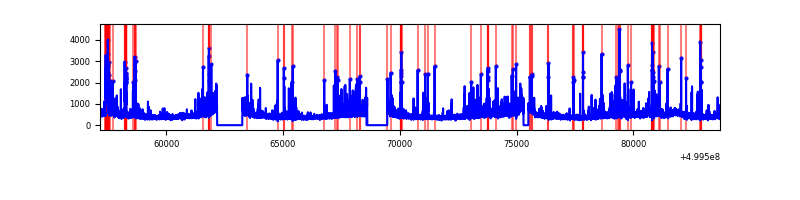 |
| C | 26540 | 24384 | 1286 | 1286 | 4.85% | 5.27% | 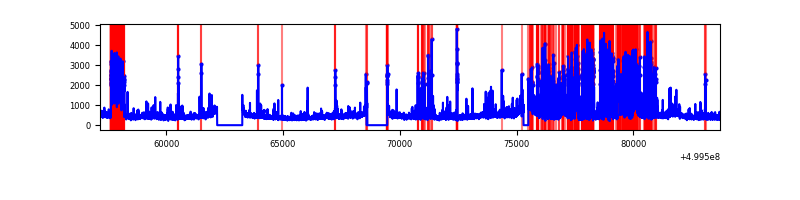 |
| D | 26540 | 24384 | 595 | 595 | 2.24% | 2.44% | 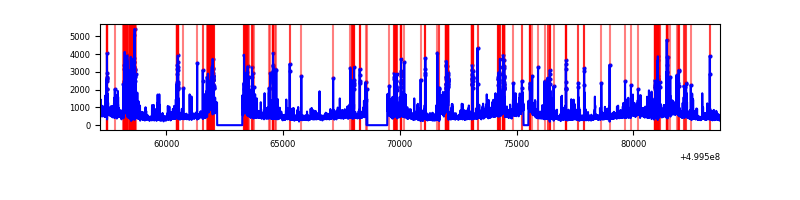 |
Top three noisy pixels from each quadrant. If the there are fewer than three noisy pixels in the level2.evt file, extra rows are filled as -1
| Pixel properties | Quadrant properties | ||||||
|---|---|---|---|---|---|---|---|
| Quadrant | DetID | PixID | Counts | Sigma | Mean | Median | Sigma |
| A | 3 | 14 | 6192565 | 9617.79 | 2604 | 2536 | 643.6 |
| A | 11 | 3 | 1537177 | 2384.46 | 2604 | 2536 | 643.6 |
| A | 4 | 3 | 202715 | 311.03 | 2604 | 2536 | 643.6 |
| B | 10 | 14 | 610371 | 1082.92 | 2620 | 2522 | 561.3 |
| B | 6 | 255 | 465591 | 824.99 | 2620 | 2522 | 561.3 |
| B | 10 | 247 | 405573 | 718.06 | 2620 | 2522 | 561.3 |
| C | 13 | 3 | 3345721 | 4833.17 | 2526 | 2504 | 691.7 |
| C | 4 | 5 | 1404019 | 2026.12 | 2526 | 2504 | 691.7 |
| C | 9 | 38 | 322861 | 463.13 | 2526 | 2504 | 691.7 |
| D | 3 | 12 | 1918379 | 2655.49 | 2537 | 2426 | 721.5 |
| D | 2 | 172 | 1465411 | 2027.68 | 2537 | 2426 | 721.5 |
| D | 15 | 94 | 604223 | 834.08 | 2537 | 2426 | 721.5 |
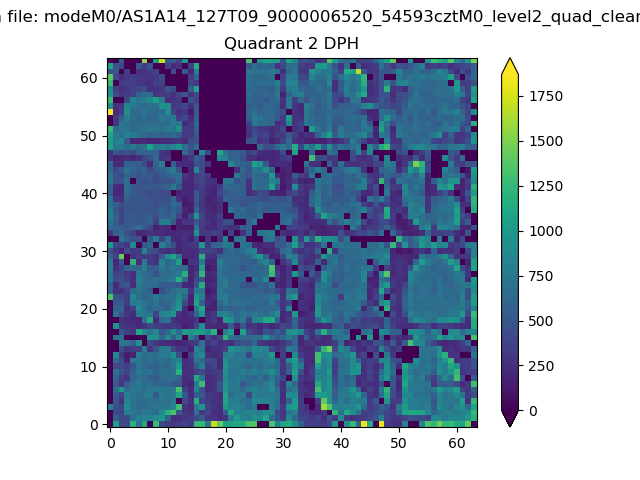
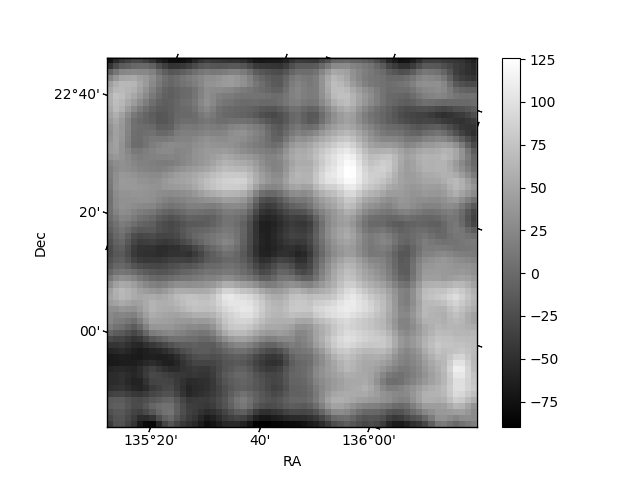
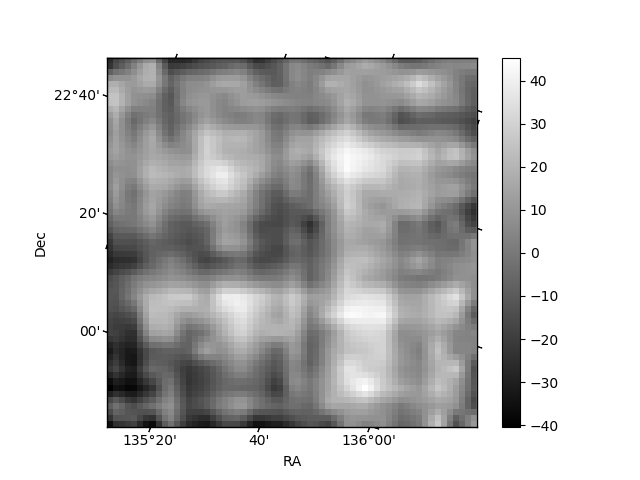
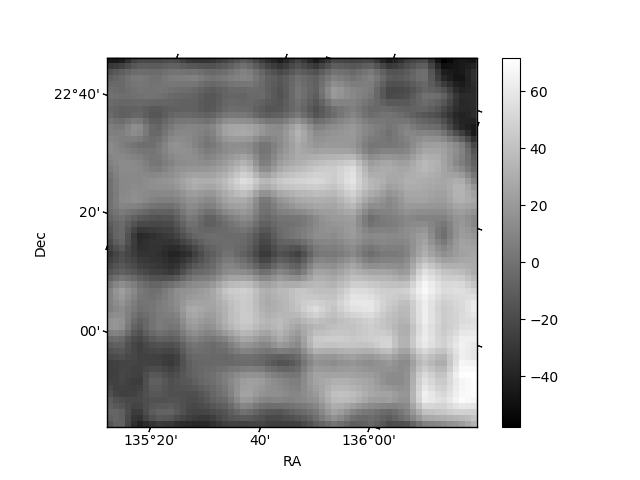
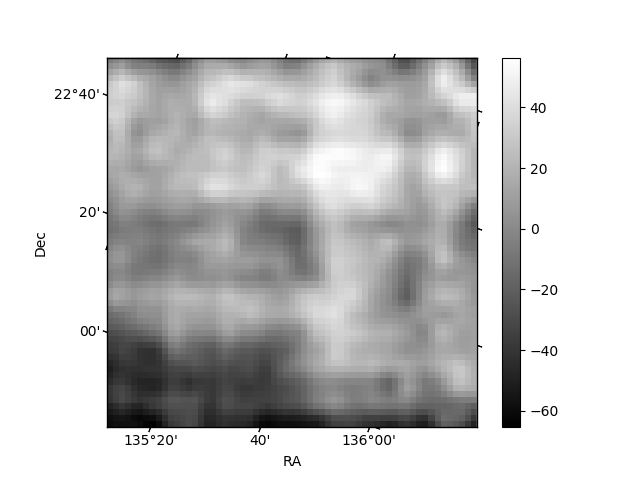
Histogram calculated using DETX and DETY for each event in the final _common_clean file
| Quadrant A | 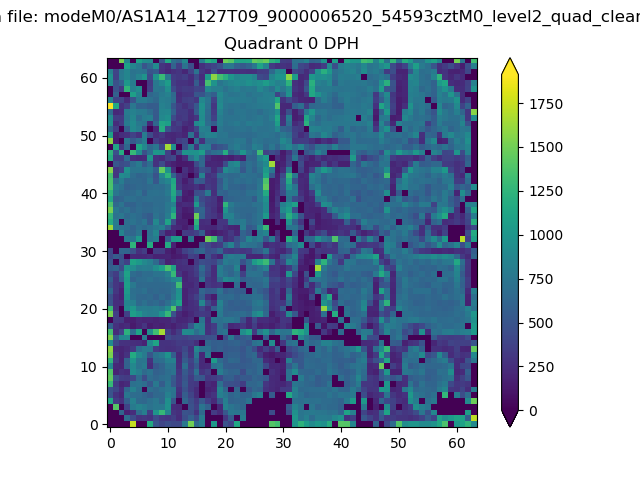 |
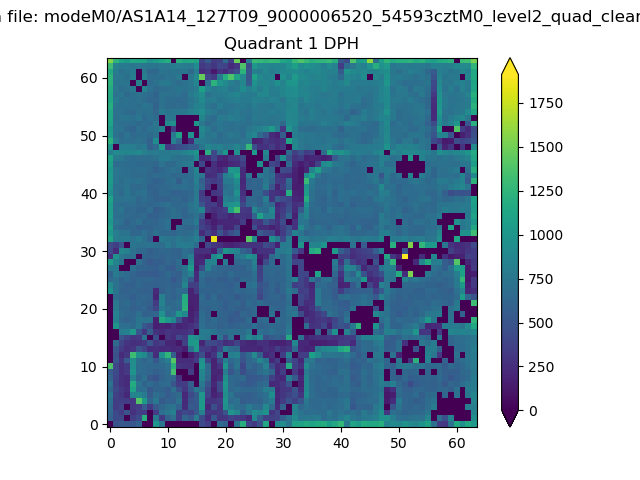 |
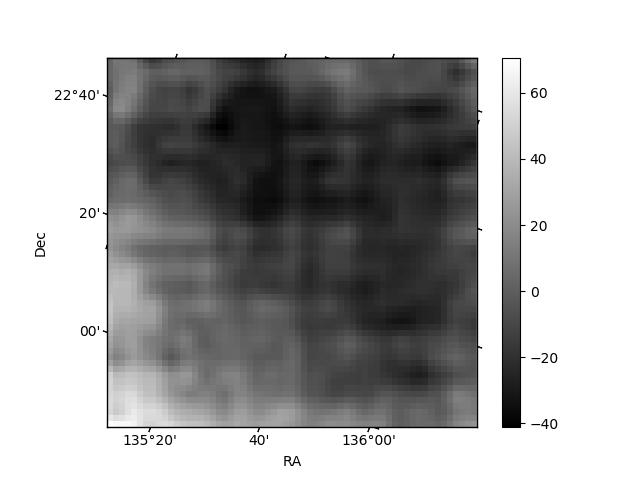
Quadrant B |
|---|---|---|---|
| Quadrant D | 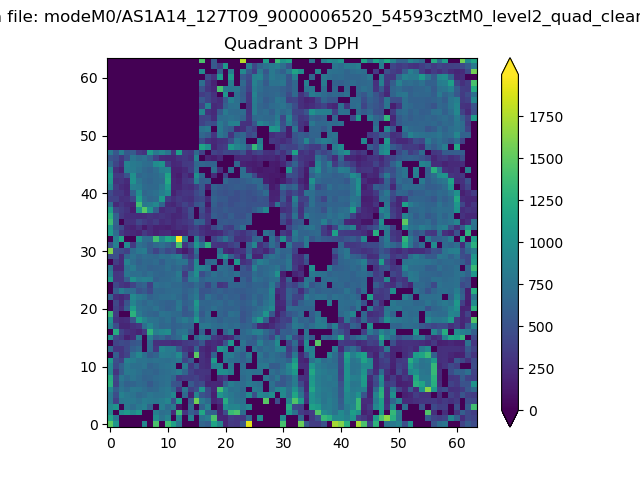 |
 |
Quadrant C |
| Plot type | Count rate plots | Images |
|---|---|---|
| Comparison with Poisson distribution Blue bars denote a histogram of data divided into 1 sec bins. Red curve is a Poisson curve with rate = median count rate of data. |
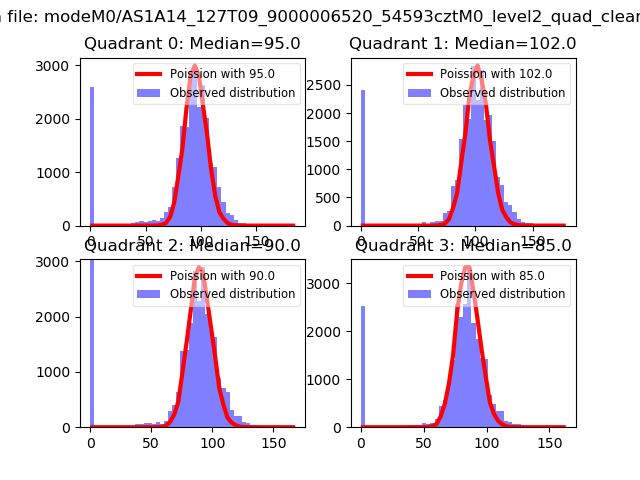 |
 |
| Quadrant-wise count rates Data is divided into 100 sec bins |
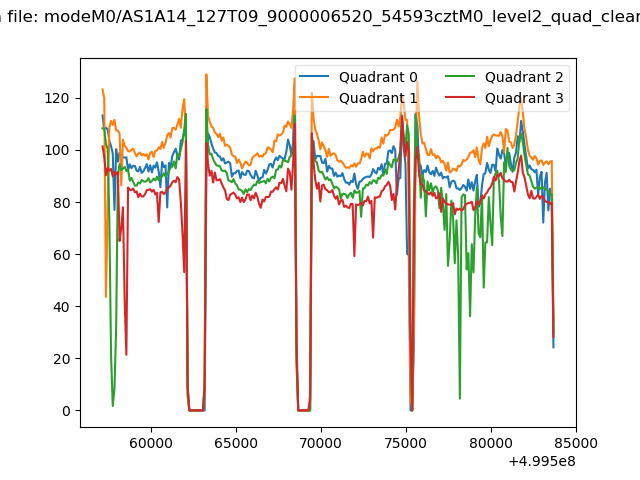 |
|
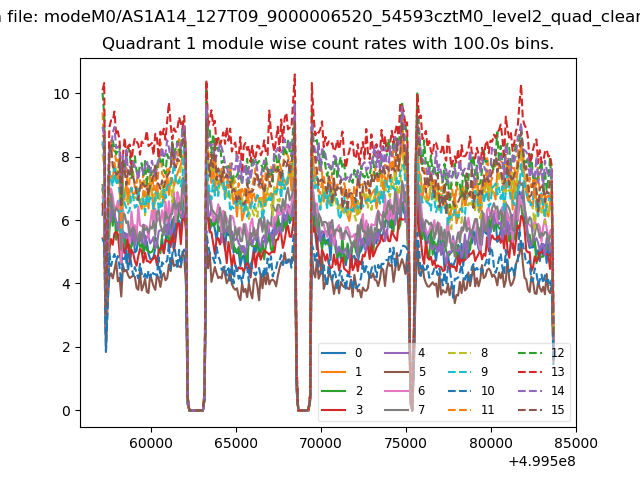
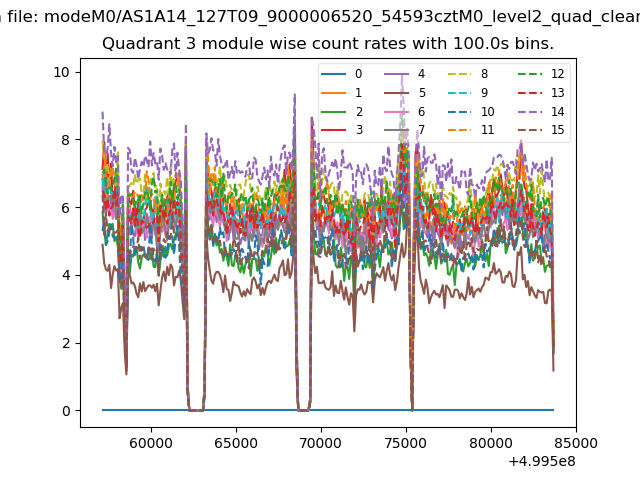
| Module-wise count rates for Quadrant A Data is divided into 100 sec bins |
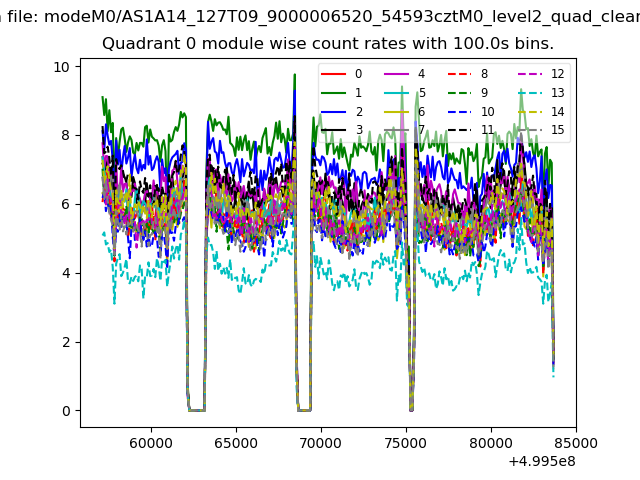 |
 |
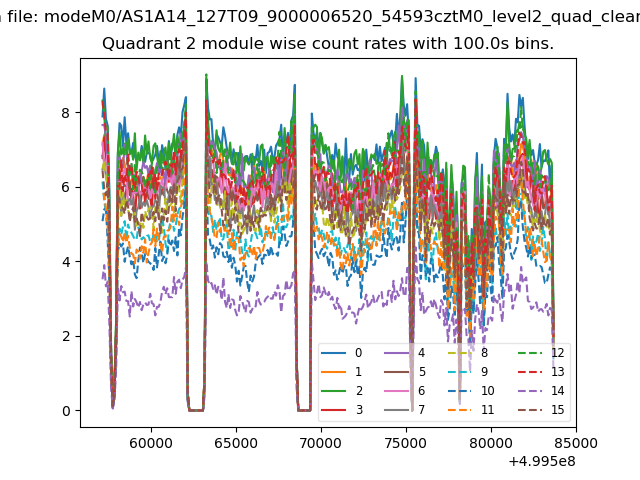
| Module-wise count rates for Quadrant B Data is divided into 100 sec bins |
 |
 |
| Module-wise count rates for Quadrant C Data is divided into 100 sec bins |
 |
 |
| Module-wise count rates for Quadrant D Data is divided into 100 sec bins |
 |
 |
| Parameter | Plot |
|---|---|
| CZT HV Monitor | 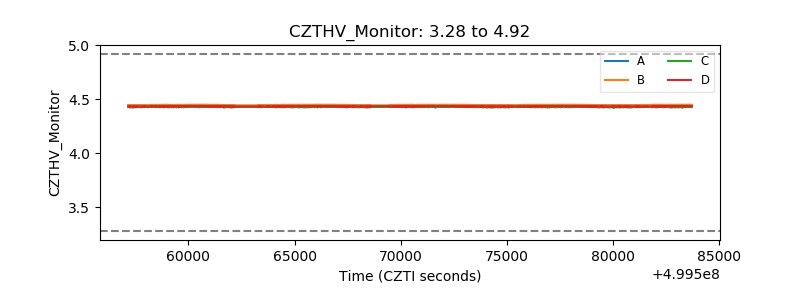 |
| D_VDD | 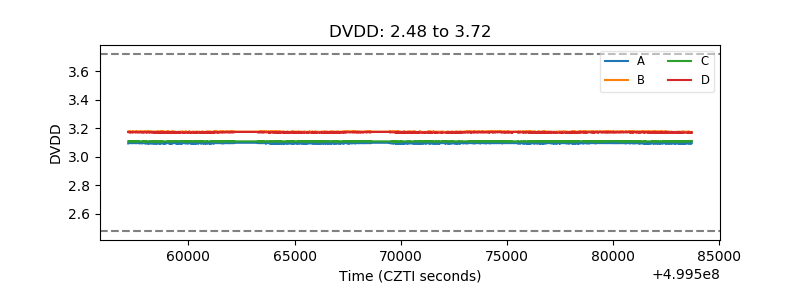 |
| Temperature 1 | 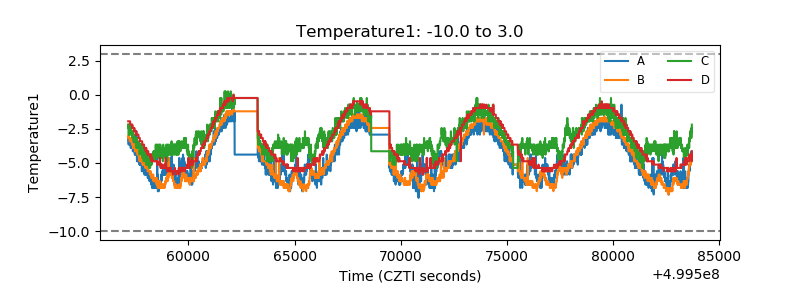 |
| Veto HV Monitor | 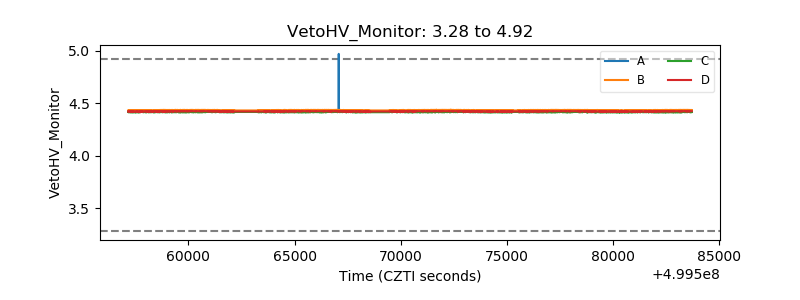 |
| Veto LLD | 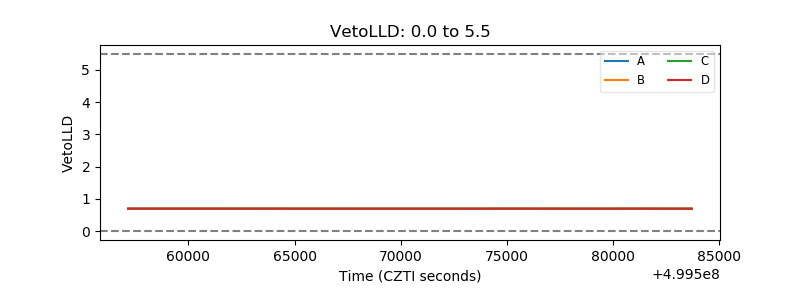 |
| Alpha Counter | 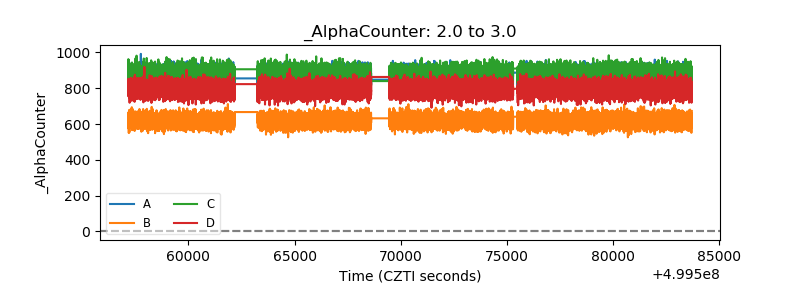 |
| _CPM_Rate | 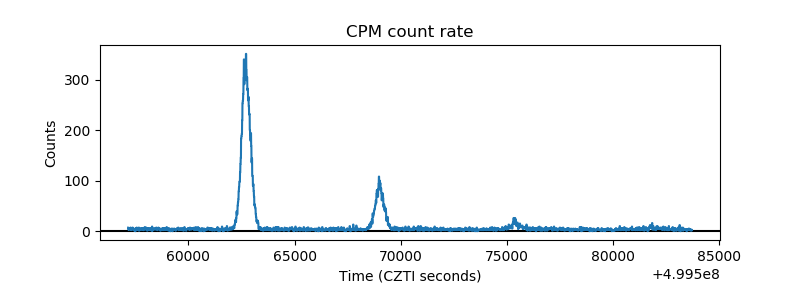 |
| CZT Counter | 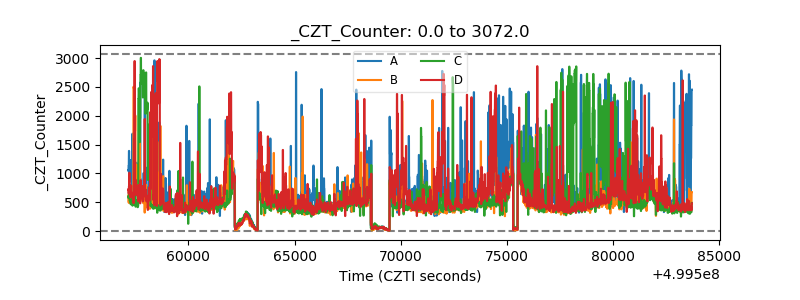 |
| +2.5 Volts monitor |  |
| +5 Volts monitor |  |
| _ROLL_ROT | 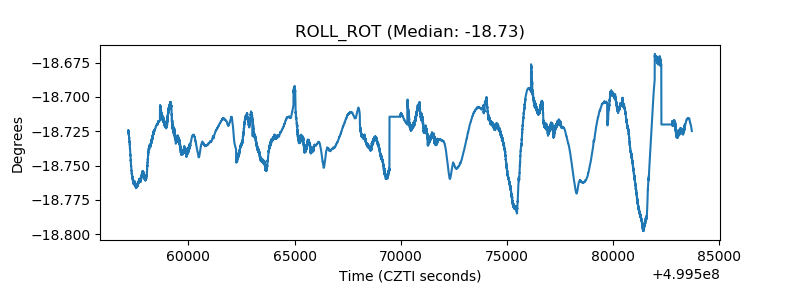 |
| _Roll_DEC | 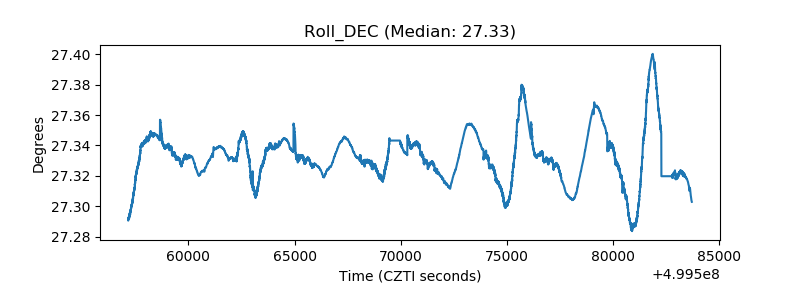 |
| _Roll_RA | 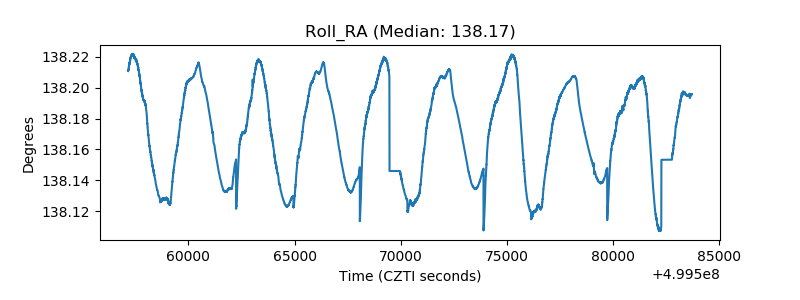 |
| Veto Counter | 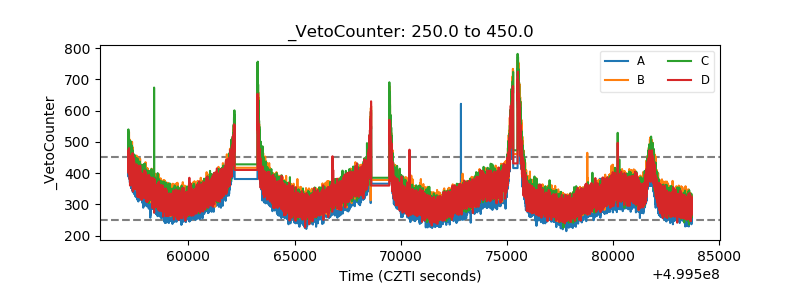 |