| Param | Original file | Final file |
|---|---|---|
| Filename | modeM0/AS1A14_066T07_9000006522_54597cztM0_level2.fits | modeM0/AS1A14_066T07_9000006522_54597cztM0_level2_quad_clean.evt |
| Size (bytes) | 755,115,840 | 159,456,960 |
| Size | 720.1 MB | 152.1 MB |
| Events in quadrant A | 5,984,063 | 1,044,605 |
| Events in quadrant B | 6,275,304 | 1,118,465 |
| Events in quadrant C | 7,019,710 | 970,057 |
| Events in quadrant D | 7,795,319 | 911,267 |
| Mode M0 | |||
|---|---|---|---|
| Quadrant | BADHDUFLAG | Total packets | Discarded packets |
| A | 0 | 25635 | 0 |
| B | 0 | 26534 | 0 |
| C | 0 | 29028 | 7 |
| D | 0 | 31004 | 3 |
| Mode SS | |||
|---|---|---|---|
| Quadrant | BADHDUFLAG | Total packets | Discarded packets |
| A | 0 | 226 | 0 |
| B | 0 | 226 | 0 |
| C | 0 | 226 | 0 |
| D | 0 | 226 | 0 |
| Quadrant | Total seconds | Saturated seconds | Saturation percentage |
|---|---|---|---|
| A | 11324 | 188 | 1.660191% |
| B | 11324 | 165 | 1.457082% |
| C | 11323 | 401 | 3.541464% |
| D | 11323 | 508 | 4.486444% |
Noise dominated data is calculated using 1-second bins in cleaned event files. If a bin has >2000 counts, and if more than 50% of those come from <1% of pixels, then it is considered to be noise-dominated and hence unusable.
| Quadrant | # 1 sec bins | Bins with >0 counts | Bins with >2000 counts | High rate bins dominated by noise | Noise dominated (total time) | Noise dominated (detector-on time) | Marked lightcurve |
|---|---|---|---|---|---|---|---|
| A | 11324 | 11324 | 155 | 155 | 1.37% | 1.37% | 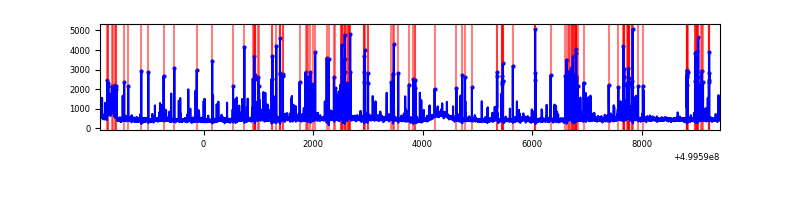 |
| B | 11324 | 11324 | 63 | 63 | 0.56% | 0.56% | 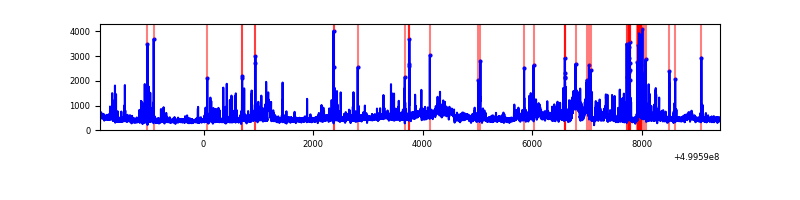 |
| C | 11324 | 11324 | 393 | 393 | 3.47% | 3.47% | 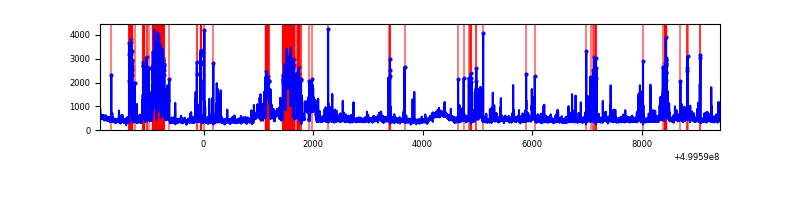 |
| D | 11324 | 11323 | 468 | 468 | 4.13% | 4.13% | 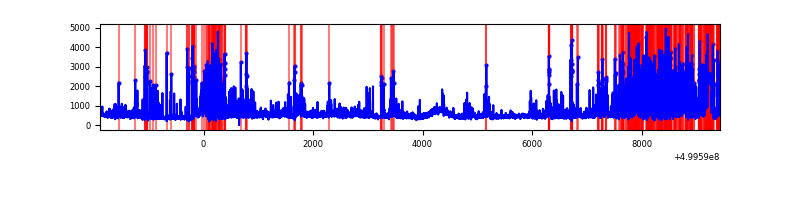 |
Top three noisy pixels from each quadrant. If the there are fewer than three noisy pixels in the level2.evt file, extra rows are filled as -1
| Pixel properties | Quadrant properties | ||||||
|---|---|---|---|---|---|---|---|
| Quadrant | DetID | PixID | Counts | Sigma | Mean | Median | Sigma |
| A | 11 | 3 | 437648 | 1456.19 | 1205 | 1173 | 299.7 |
| A | 3 | 14 | 326774 | 1086.28 | 1205 | 1173 | 299.7 |
| A | 0 | 8 | 196010 | 650.02 | 1205 | 1173 | 299.7 |
| B | 7 | 0 | 637306 | 2492.32 | 1190 | 1145 | 255.2 |
| B | 1 | 207 | 202400 | 788.47 | 1190 | 1145 | 255.2 |
| B | 10 | 14 | 181364 | 706.05 | 1190 | 1145 | 255.2 |
| C | 4 | 5 | 1073157 | 3380.43 | 1161 | 1154 | 317.1 |
| C | 14 | 96 | 630440 | 1984.37 | 1161 | 1154 | 317.1 |
| C | 13 | 3 | 227713 | 714.42 | 1161 | 1154 | 317.1 |
| D | 2 | 62 | 2191190 | 6762.5 | 1152 | 1103 | 323.9 |
| D | 2 | 172 | 410842 | 1265.18 | 1152 | 1103 | 323.9 |
| D | 15 | 94 | 147070 | 450.71 | 1152 | 1103 | 323.9 |
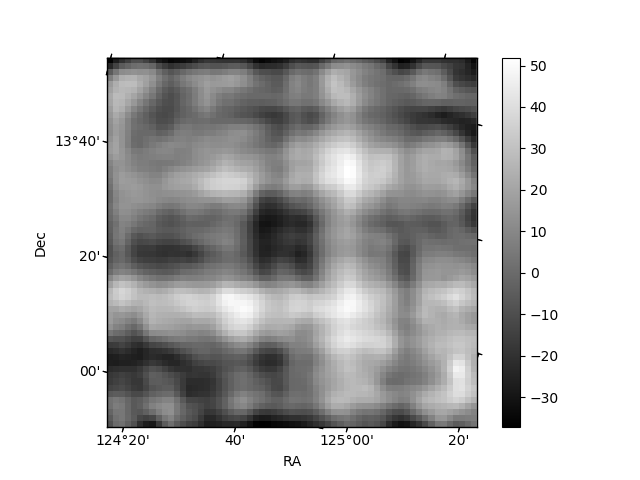
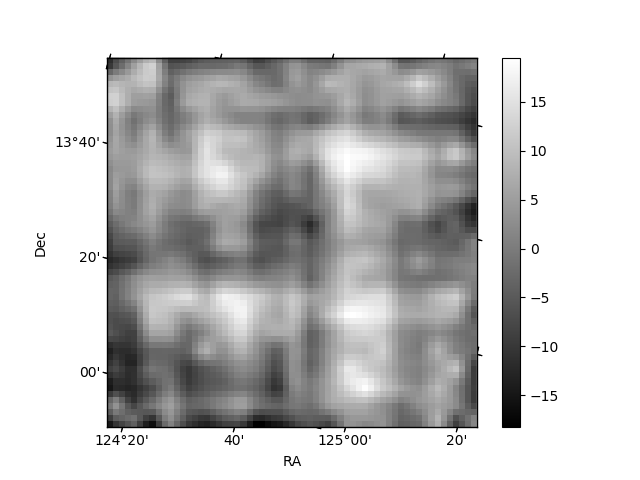
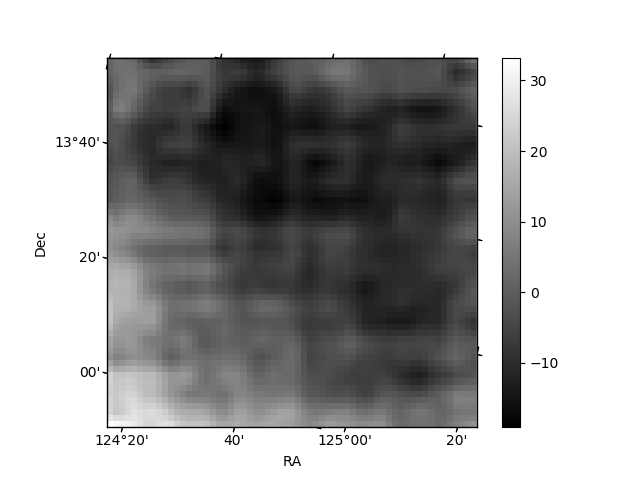
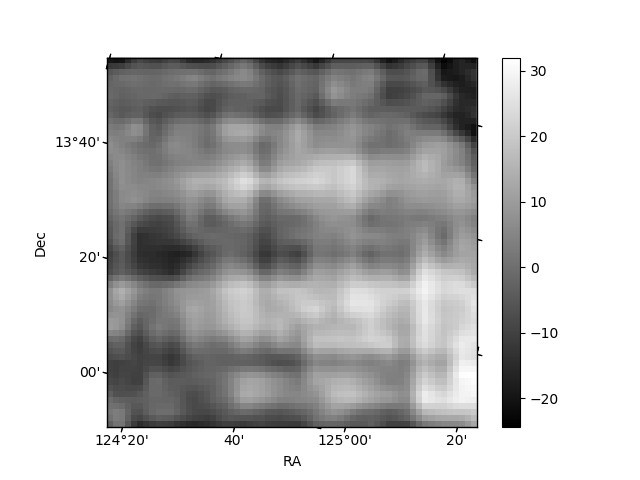
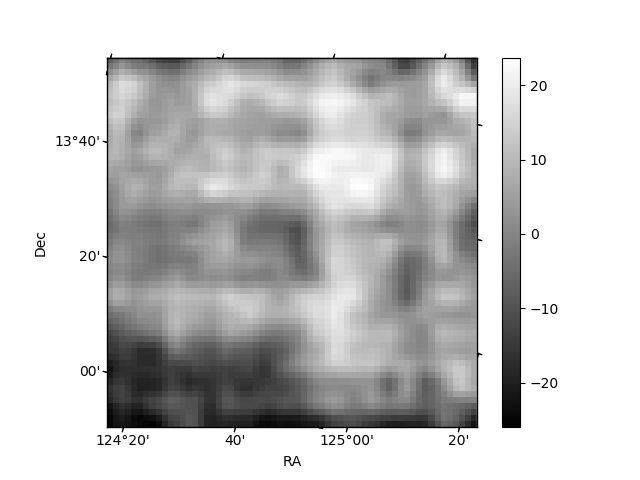
Histogram calculated using DETX and DETY for each event in the final _common_clean file
| Quadrant A | 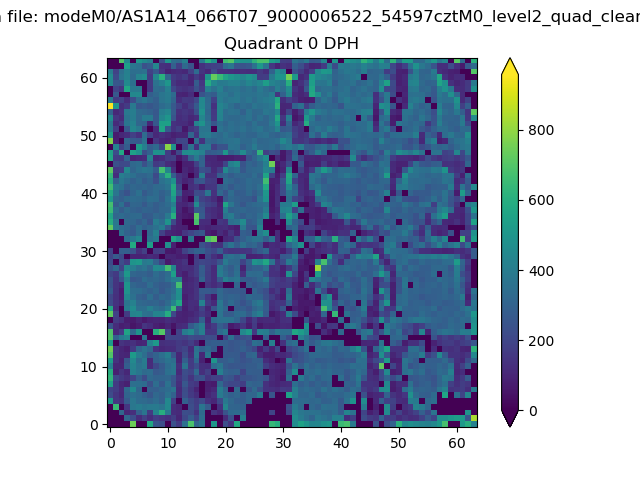 |
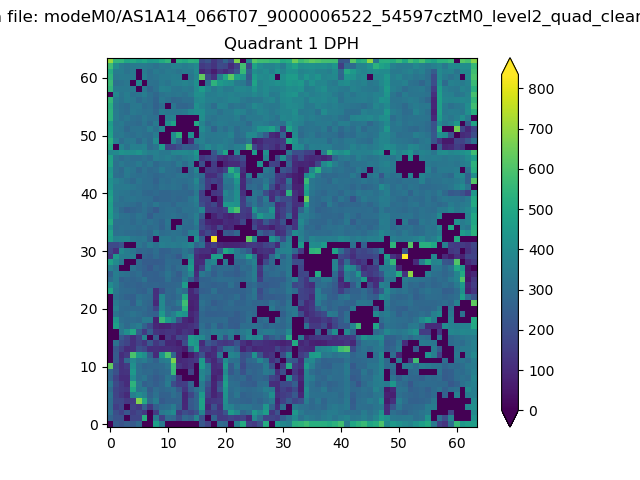 |
Quadrant B |
|---|---|---|---|
| Quadrant D | 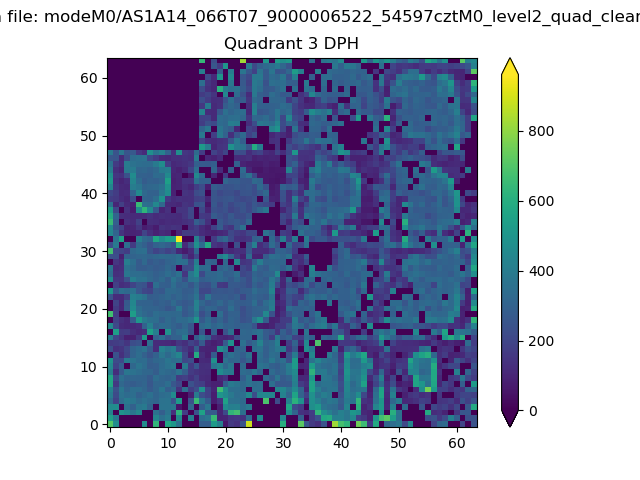 |
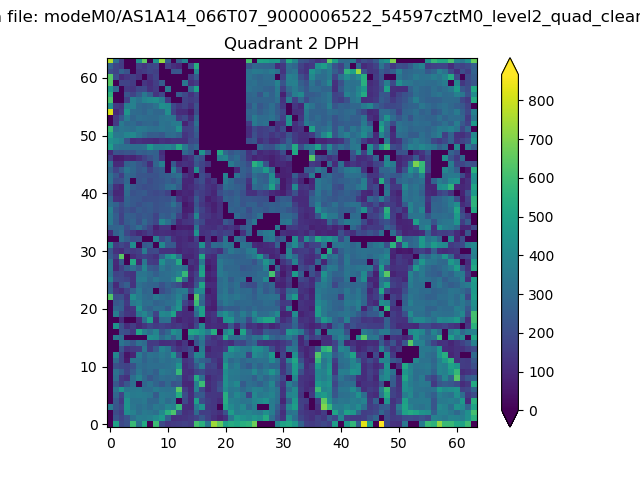 |
Quadrant C |
| Plot type | Count rate plots | Images |
|---|---|---|
| Comparison with Poisson distribution Blue bars denote a histogram of data divided into 1 sec bins. Red curve is a Poisson curve with rate = median count rate of data. |
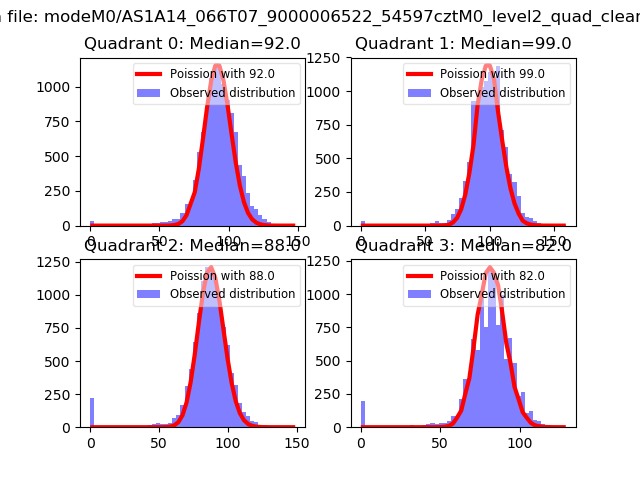 |
 |
| Quadrant-wise count rates Data is divided into 100 sec bins |
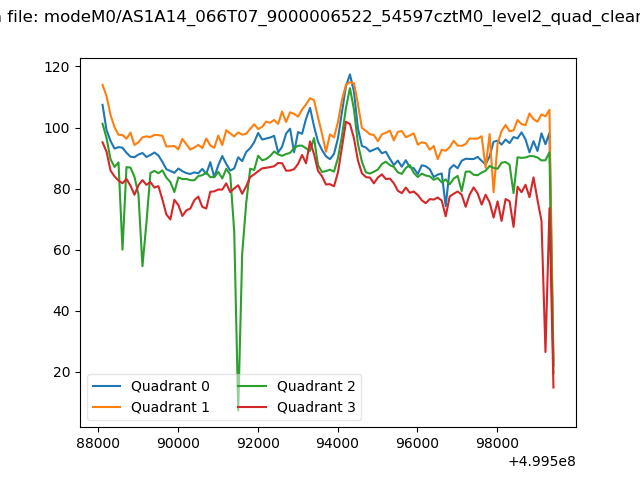 |
|
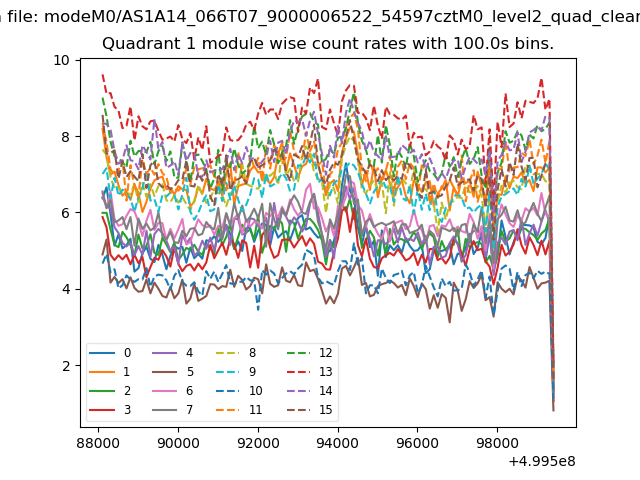
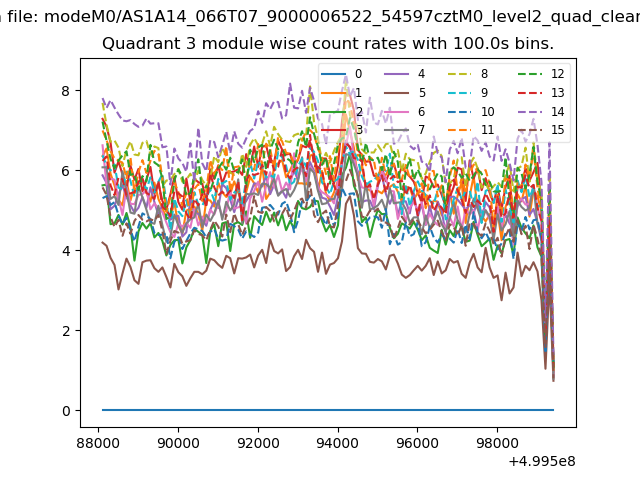
| Module-wise count rates for Quadrant A Data is divided into 100 sec bins |
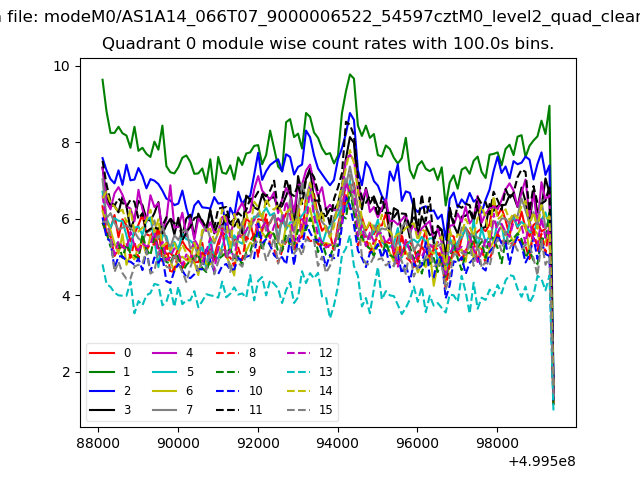 |
 |
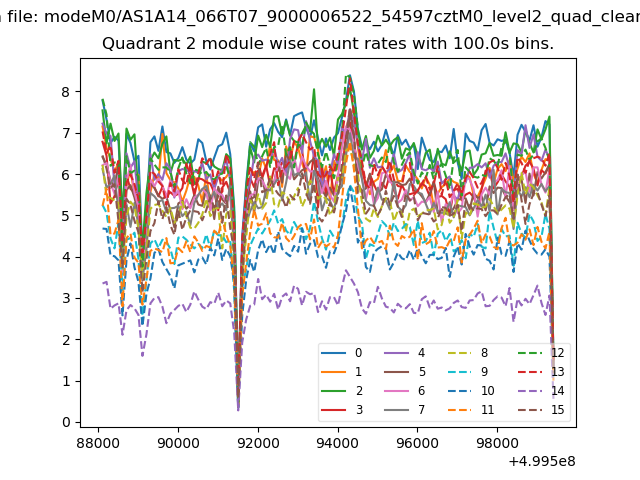
| Module-wise count rates for Quadrant B Data is divided into 100 sec bins |
 |
 |
| Module-wise count rates for Quadrant C Data is divided into 100 sec bins |
 |
 |
| Module-wise count rates for Quadrant D Data is divided into 100 sec bins |
 |
 |
| Parameter | Plot |
|---|---|
| CZT HV Monitor | 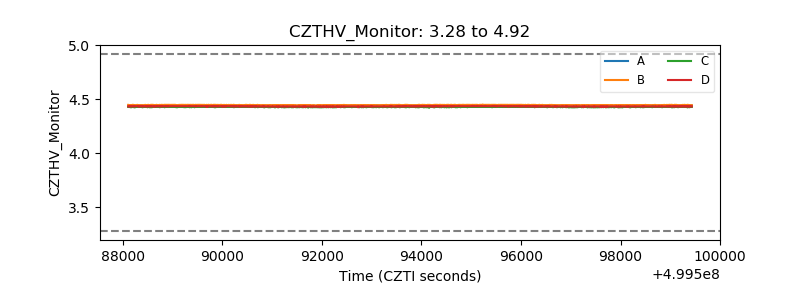 |
| D_VDD | 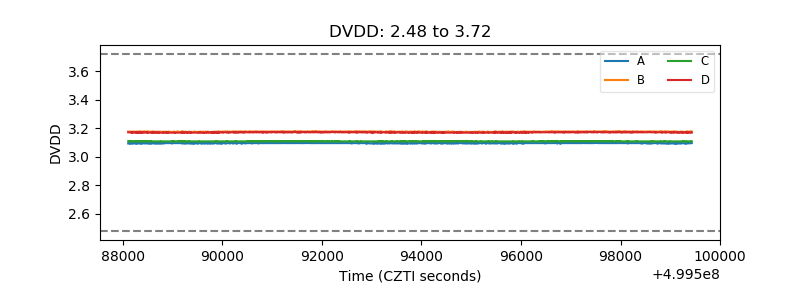 |
| Temperature 1 | 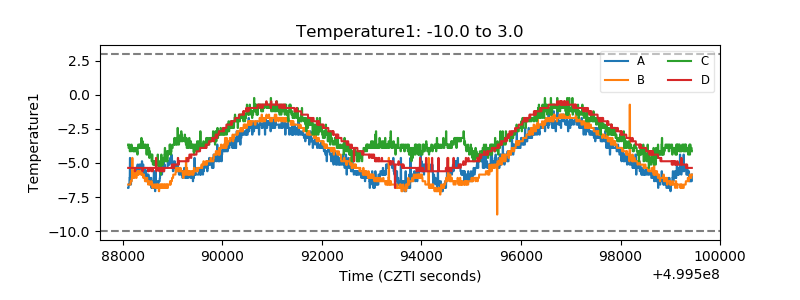 |
| Veto HV Monitor | 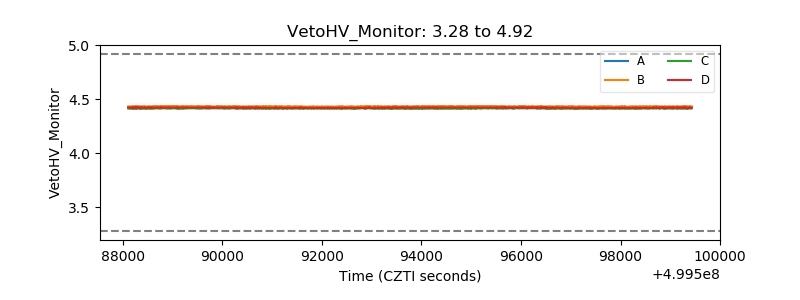 |
| Veto LLD | 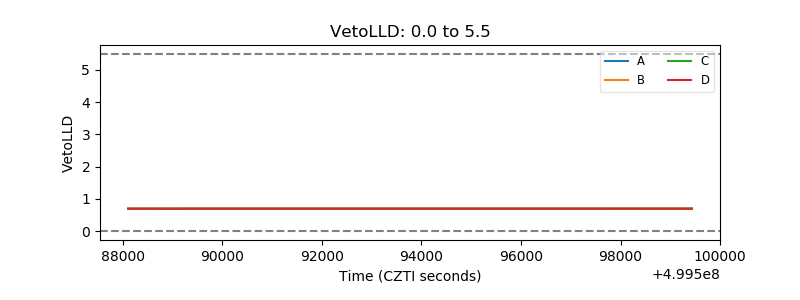 |
| Alpha Counter | 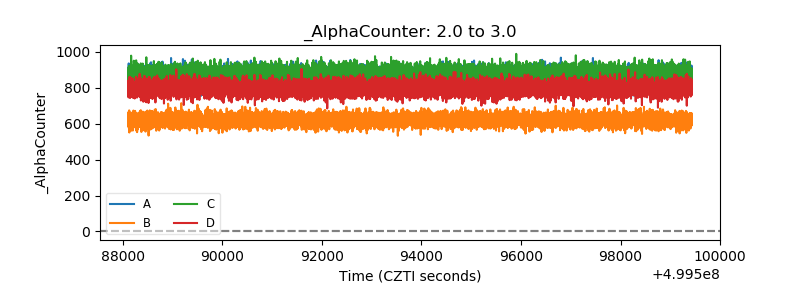 |
| _CPM_Rate | 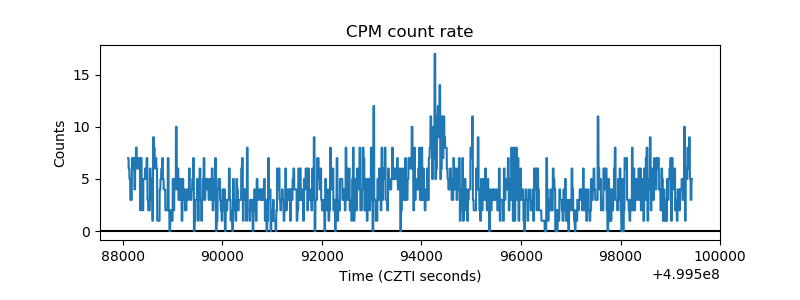 |
| CZT Counter | 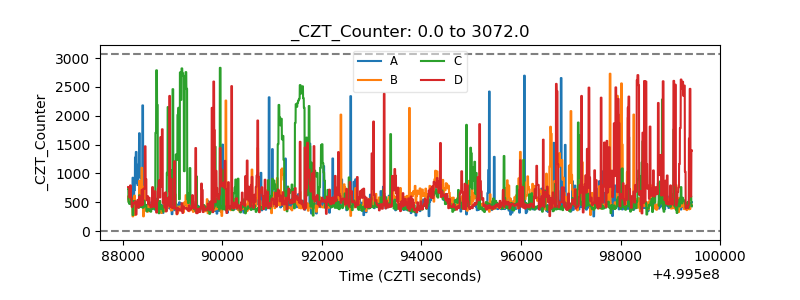 |
| +2.5 Volts monitor |  |
| +5 Volts monitor |  |
| _ROLL_ROT | 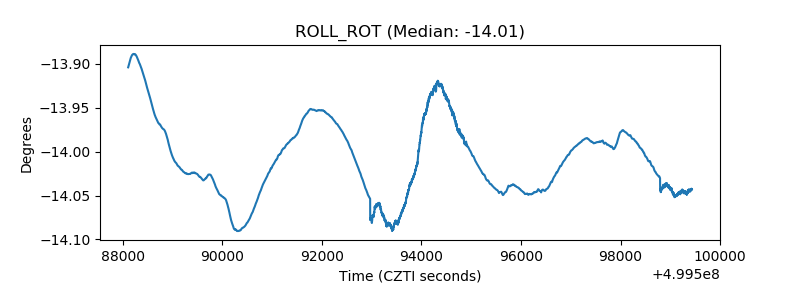 |
| _Roll_DEC | 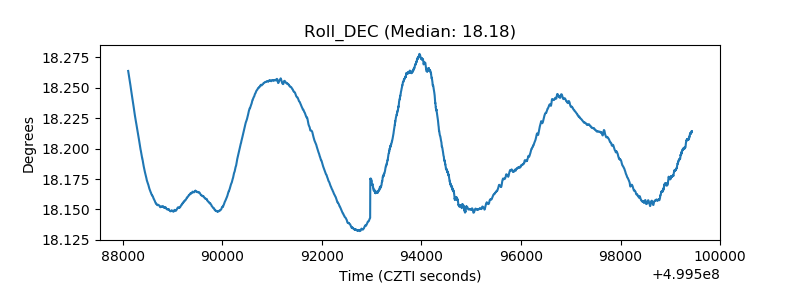 |
| _Roll_RA | 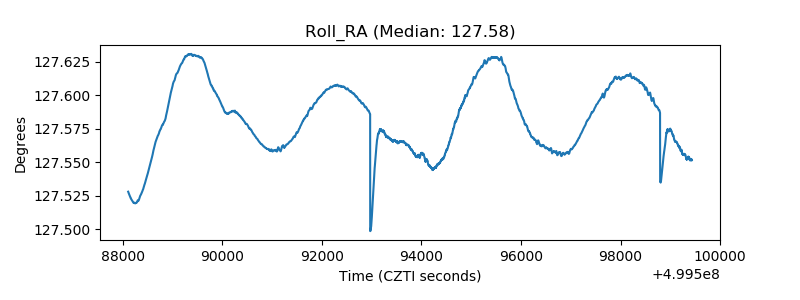 |
| Veto Counter | 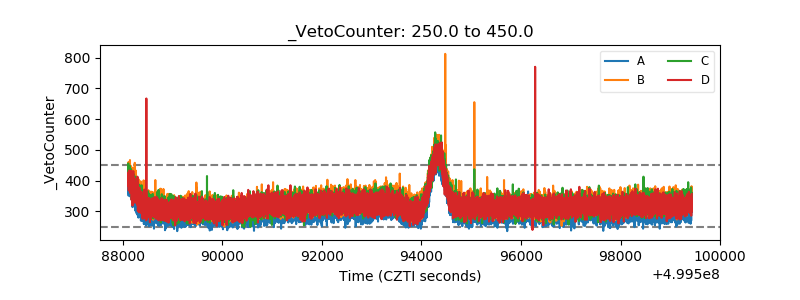 |