| Param | Original file | Final file |
|---|---|---|
| Filename | modeM0/AS1A14_066T07_9000006522_54598cztM0_level2.fits | modeM0/AS1A14_066T07_9000006522_54598cztM0_level2_quad_clean.evt |
| Size (bytes) | 1,067,376,960 | 190,932,480 |
| Size | 1017.9 MB | 182.1 MB |
| Events in quadrant A | 8,262,744 | 1,279,886 |
| Events in quadrant B | 11,220,541 | 1,231,565 |
| Events in quadrant C | 8,330,290 | 1,201,590 |
| Events in quadrant D | 10,604,688 | 1,093,932 |
| Mode M9 | |||
|---|---|---|---|
| Quadrant | BADHDUFLAG | Total packets | Discarded packets |
| A | 0 | 16 | 0 |
| B | 0 | 16 | 0 |
| C | 0 | 16 | 0 |
| D | 0 | 16 | 0 |
| Mode M0 | |||
|---|---|---|---|
| Quadrant | BADHDUFLAG | Total packets | Discarded packets |
| A | 0 | 33803 | 4 |
| B | 0 | 43448 | 3 |
| C | 0 | 34439 | 3 |
| D | 0 | 41331 | 3 |
| Mode SS | |||
|---|---|---|---|
| Quadrant | BADHDUFLAG | Total packets | Discarded packets |
| A | 0 | 286 | 0 |
| B | 0 | 286 | 0 |
| C | 0 | 286 | 0 |
| D | 0 | 286 | 0 |
| Quadrant | Total seconds | Saturated seconds | Saturation percentage |
|---|---|---|---|
| A | 14105 | 729 | 5.168380% |
| B | 14105 | 2061 | 14.611840% |
| C | 14105 | 671 | 4.757178% |
| D | 14106 | 1039 | 7.365660% |
Noise dominated data is calculated using 1-second bins in cleaned event files. If a bin has >2000 counts, and if more than 50% of those come from <1% of pixels, then it is considered to be noise-dominated and hence unusable.
| Quadrant | # 1 sec bins | Bins with >0 counts | Bins with >2000 counts | High rate bins dominated by noise | Noise dominated (total time) | Noise dominated (detector-on time) | Marked lightcurve |
|---|---|---|---|---|---|---|---|
| A | 15625 | 14107 | 345 | 345 | 2.21% | 2.45% | 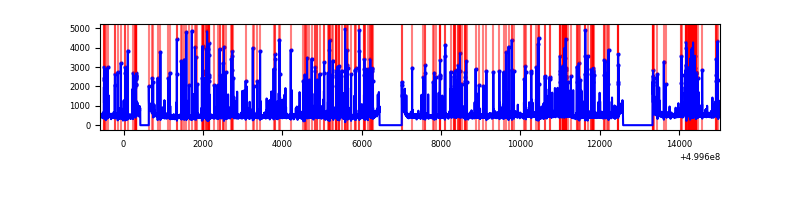 |
| B | 15625 | 14106 | 1373 | 1373 | 8.79% | 9.73% | 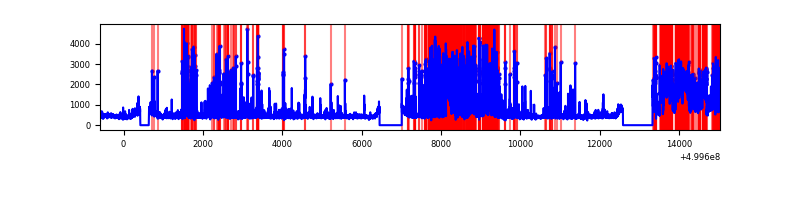 |
| C | 15625 | 14106 | 334 | 334 | 2.14% | 2.37% | 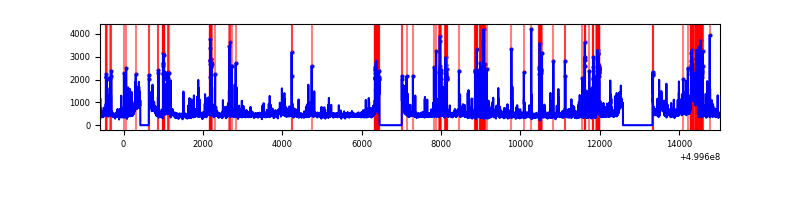 |
| D | 15626 | 14108 | 704 | 704 | 4.51% | 4.99% | 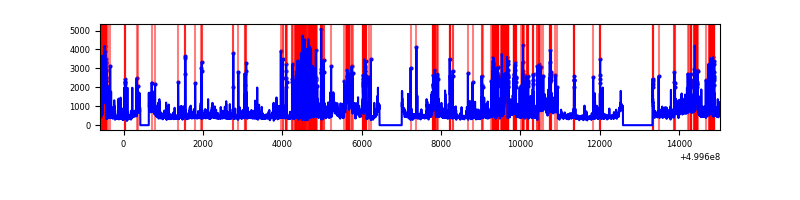 |
Top three noisy pixels from each quadrant. If the there are fewer than three noisy pixels in the level2.evt file, extra rows are filled as -1
| Pixel properties | Quadrant properties | ||||||
|---|---|---|---|---|---|---|---|
| Quadrant | DetID | PixID | Counts | Sigma | Mean | Median | Sigma |
| A | 11 | 3 | 751026 | 1970.57 | 1543 | 1503 | 380.4 |
| A | 13 | 248 | 587992 | 1541.94 | 1543 | 1503 | 380.4 |
| A | 3 | 14 | 495174 | 1297.91 | 1543 | 1503 | 380.4 |
| B | 1 | 207 | 2600901 | 8366.31 | 1462 | 1408 | 310.7 |
| B | 5 | 172 | 1809546 | 5819.38 | 1462 | 1408 | 310.7 |
| B | 8 | 234 | 188159 | 601.05 | 1462 | 1408 | 310.7 |
| C | 15 | 254 | 656656 | 1604.15 | 1493 | 1477 | 408.4 |
| C | 4 | 5 | 638742 | 1560.29 | 1493 | 1477 | 408.4 |
| C | 1 | 16 | 363694 | 886.86 | 1493 | 1477 | 408.4 |
| D | 3 | 12 | 1736335 | 4142.48 | 1486 | 1417 | 418.8 |
| D | 2 | 62 | 1150210 | 2742.98 | 1486 | 1417 | 418.8 |
| D | 12 | 33 | 467201 | 1112.16 | 1486 | 1417 | 418.8 |
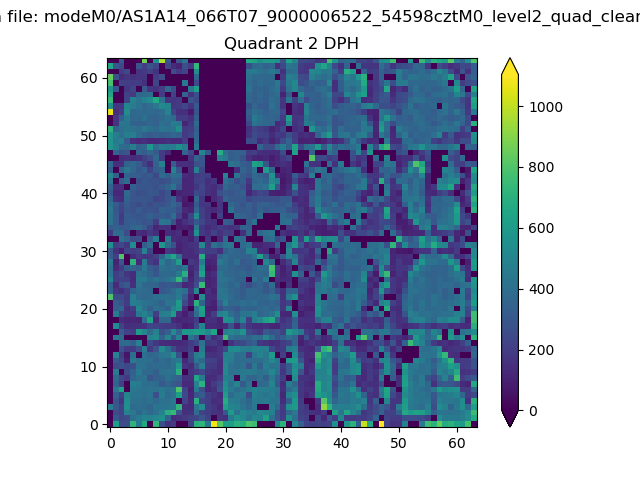
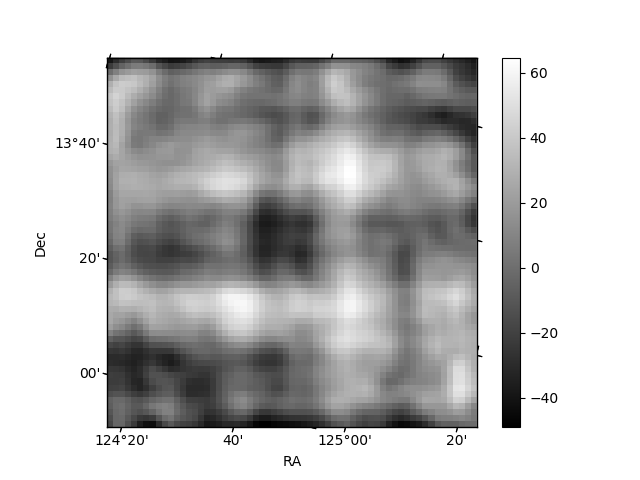
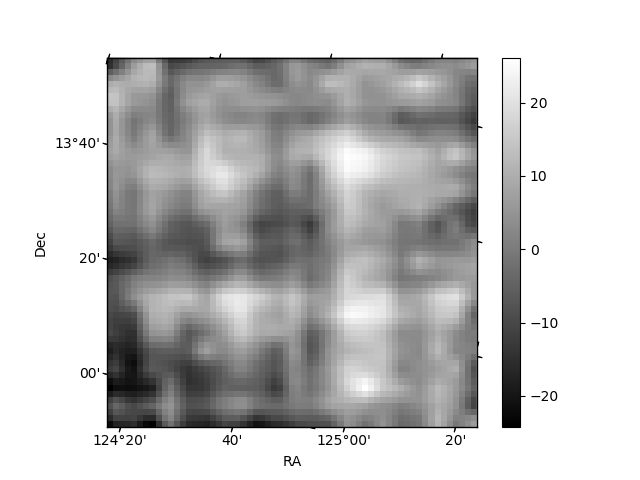
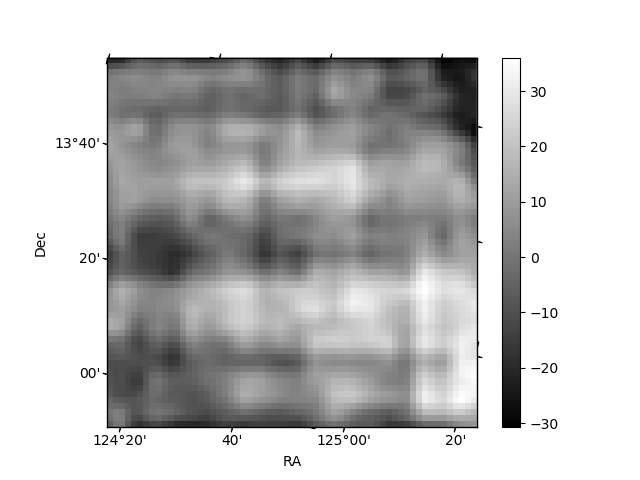
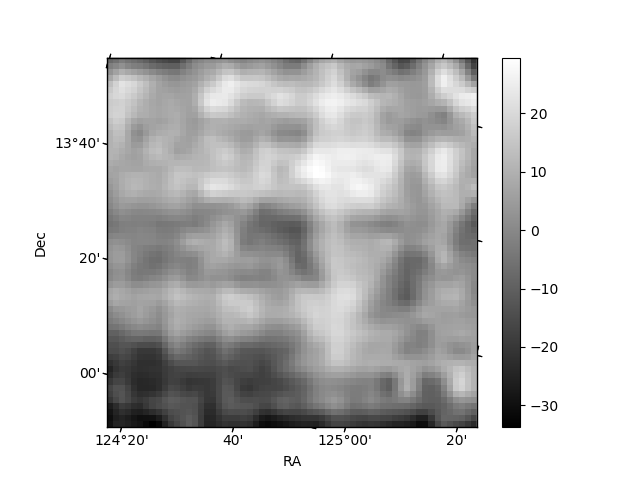
Histogram calculated using DETX and DETY for each event in the final _common_clean file
| Quadrant A | 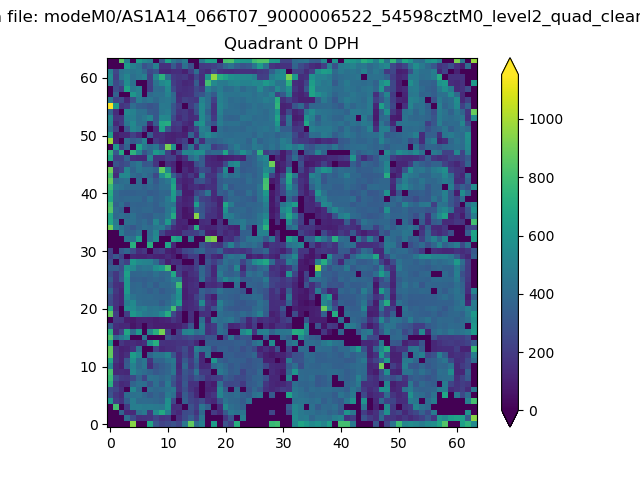 |
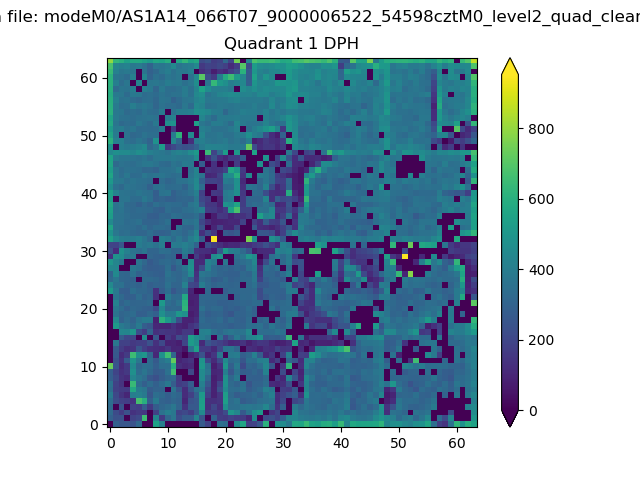 |
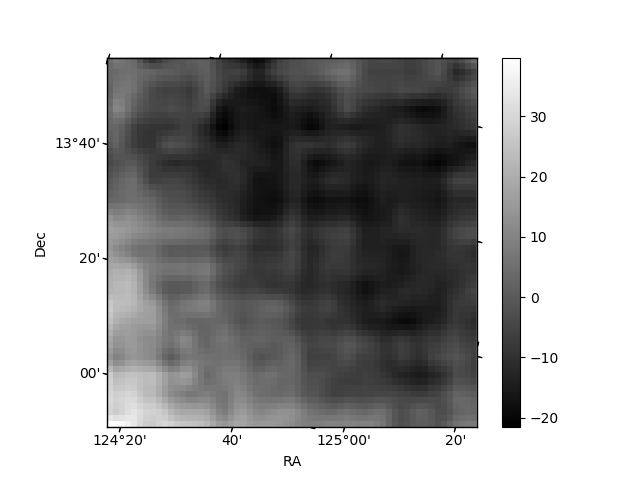
Quadrant B |
|---|---|---|---|
| Quadrant D | 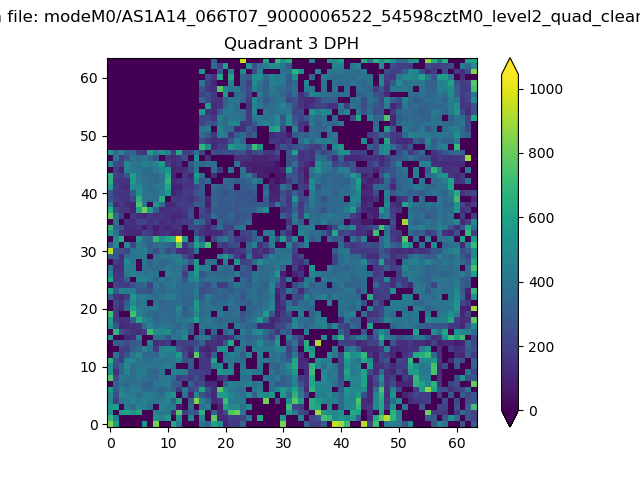 |
 |
Quadrant C |
| Plot type | Count rate plots | Images |
|---|---|---|
| Comparison with Poisson distribution Blue bars denote a histogram of data divided into 1 sec bins. Red curve is a Poisson curve with rate = median count rate of data. |
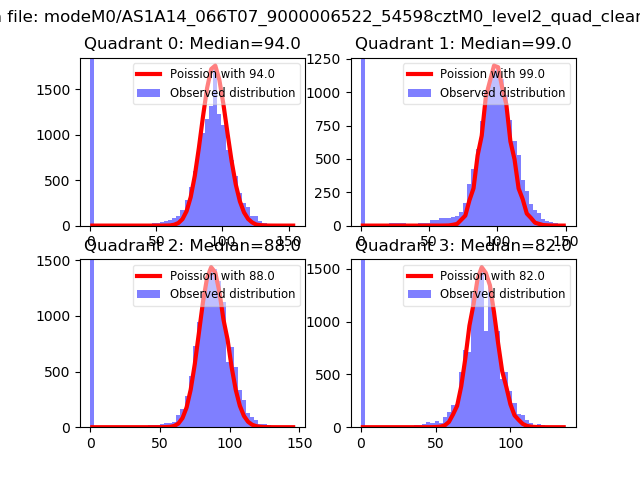 |
 |
| Quadrant-wise count rates Data is divided into 100 sec bins |
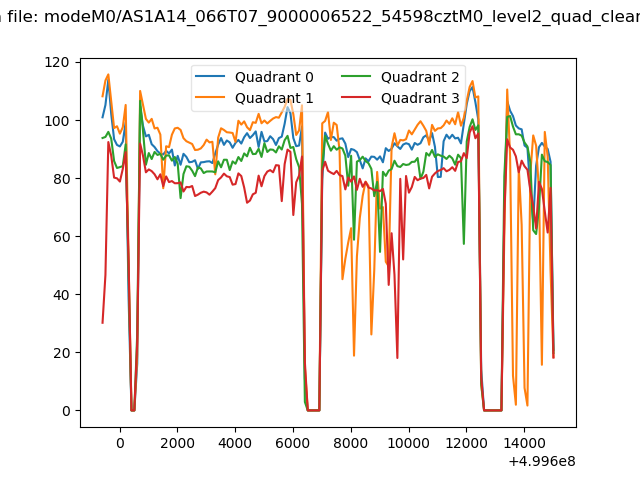 |
|
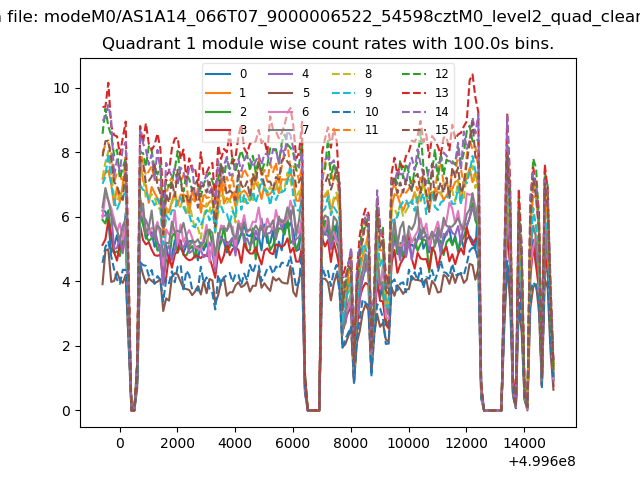
| Module-wise count rates for Quadrant A Data is divided into 100 sec bins |
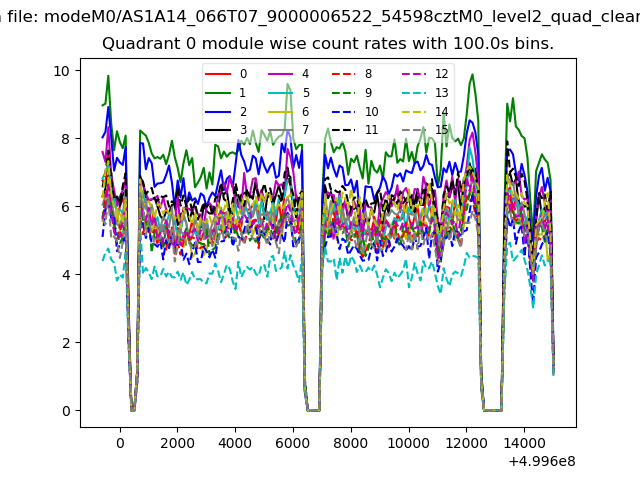 |
 |
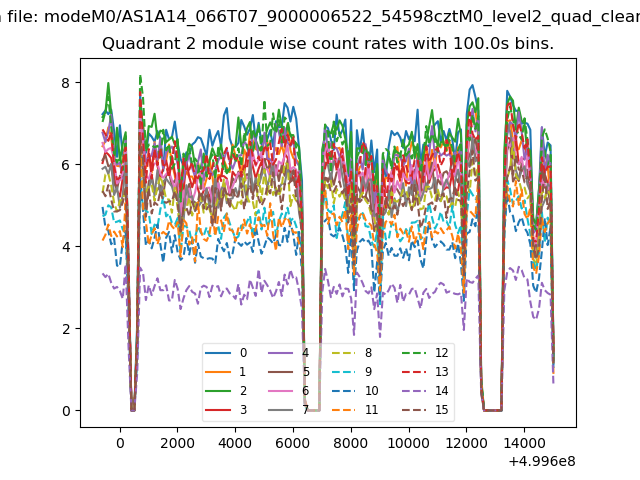
| Module-wise count rates for Quadrant B Data is divided into 100 sec bins |
 |
 |
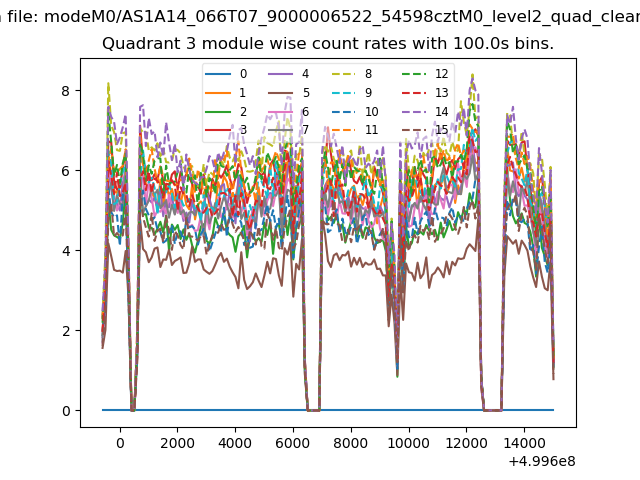
| Module-wise count rates for Quadrant C Data is divided into 100 sec bins |
 |
 |
| Module-wise count rates for Quadrant D Data is divided into 100 sec bins |
 |
 |
| Parameter | Plot |
|---|---|
| CZT HV Monitor | 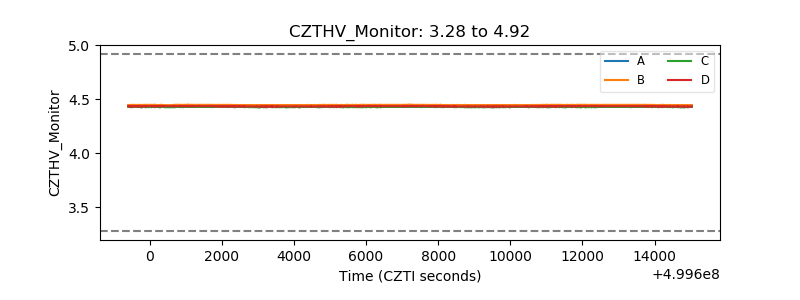 |
| D_VDD | 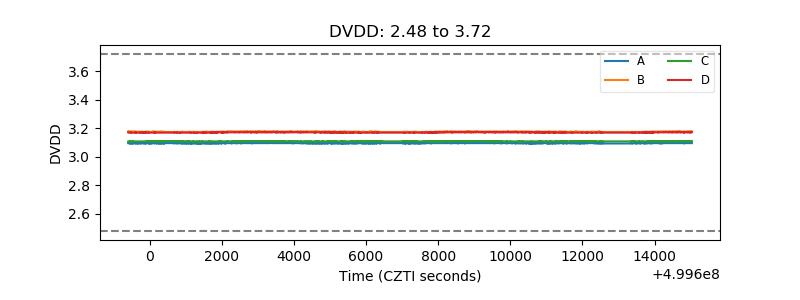 |
| Temperature 1 | 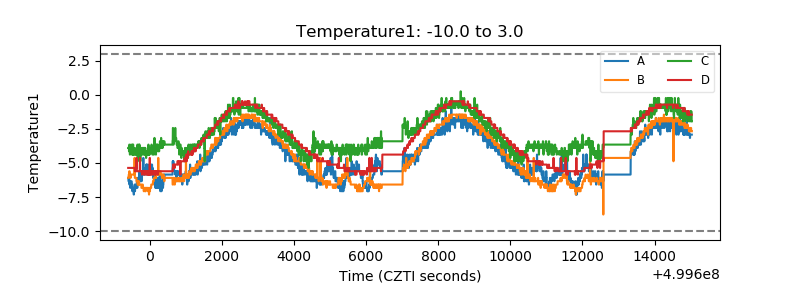 |
| Veto HV Monitor | 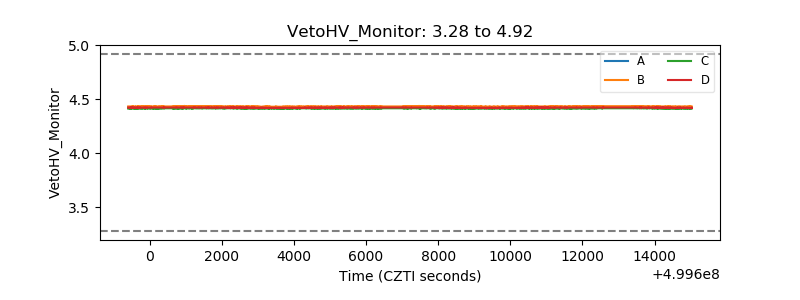 |
| Veto LLD | 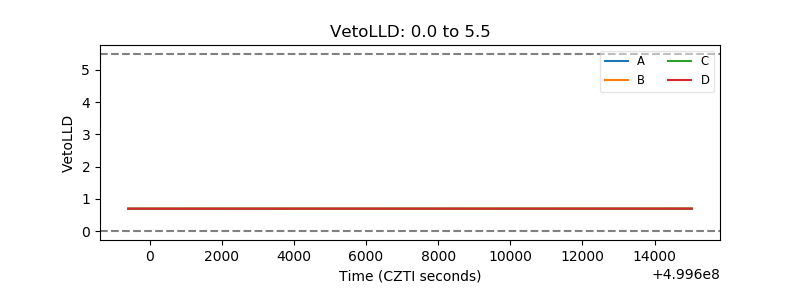 |
| Alpha Counter | 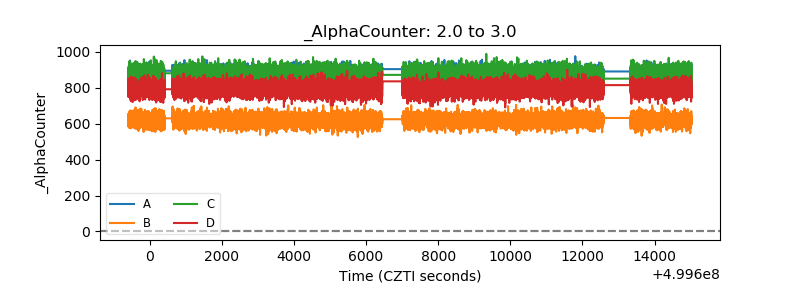 |
| _CPM_Rate | 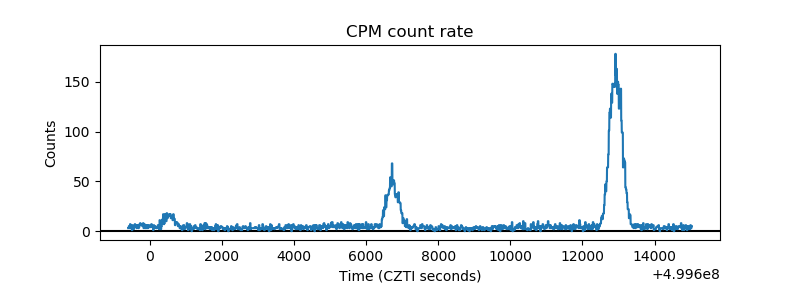 |
| CZT Counter | 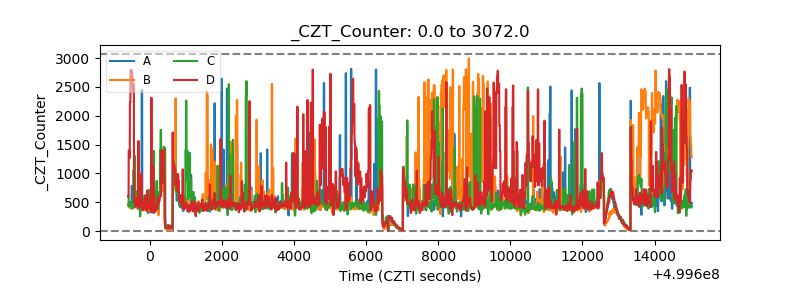 |
| +2.5 Volts monitor |  |
| +5 Volts monitor |  |
| _ROLL_ROT | 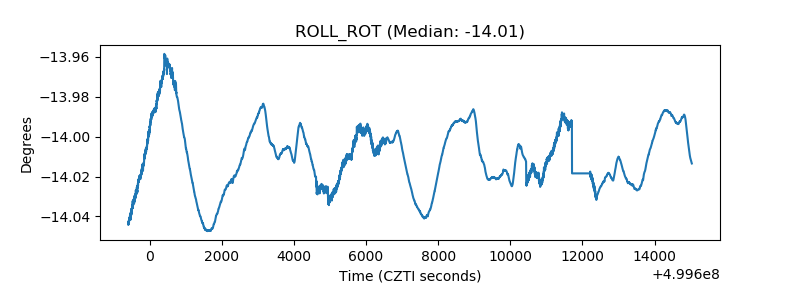 |
| _Roll_DEC | 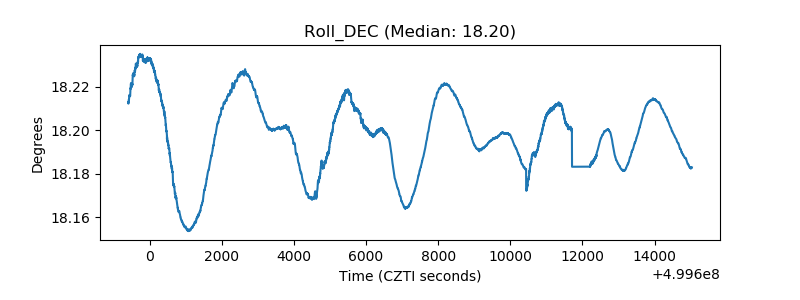 |
| _Roll_RA | 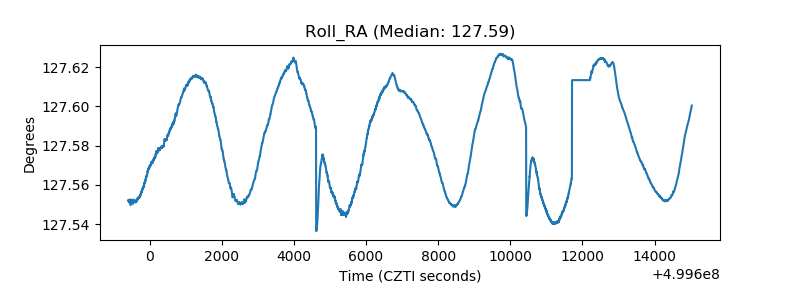 |
| Veto Counter | 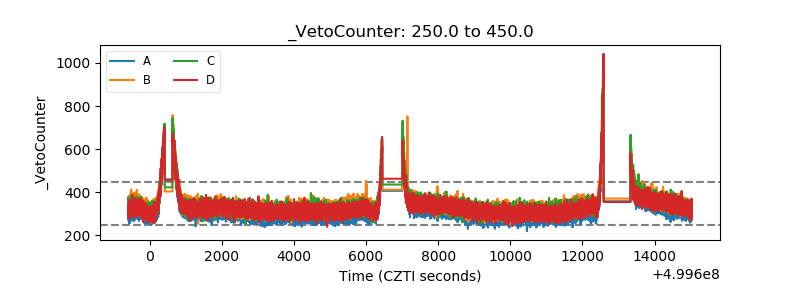 |