| Param | Original file | Final file |
|---|---|---|
| Filename | modeM0/AS1A14_066T07_9000006522_54601cztM0_level2.fits | modeM0/AS1A14_066T07_9000006522_54601cztM0_level2_quad_clean.evt |
| Size (bytes) | 443,557,440 | 99,475,200 |
| Size | 423.0 MB | 94.9 MB |
| Events in quadrant A | 3,962,199 | 654,380 |
| Events in quadrant B | 3,427,149 | 704,909 |
| Events in quadrant C | 3,482,158 | 616,473 |
| Events in quadrant D | 5,035,739 | 577,104 |
| Mode M9 | |||
|---|---|---|---|
| Quadrant | BADHDUFLAG | Total packets | Discarded packets |
| A | 0 | 14 | 0 |
| B | 0 | 15 | 0 |
| C | 0 | 15 | 0 |
| D | 0 | 15 | 0 |
| Mode M0 | |||
|---|---|---|---|
| Quadrant | BADHDUFLAG | Total packets | Discarded packets |
| A | 0 | 15978 | 2 |
| B | 0 | 14787 | 2 |
| C | 0 | 14973 | 2 |
| D | 0 | 19658 | 2 |
| Mode SS | |||
|---|---|---|---|
| Quadrant | BADHDUFLAG | Total packets | Discarded packets |
| A | 0 | 132 | 0 |
| B | 0 | 132 | 0 |
| C | 0 | 132 | 0 |
| D | 0 | 132 | 0 |
| Quadrant | Total seconds | Saturated seconds | Saturation percentage |
|---|---|---|---|
| A | 6584 | 213 | 3.235115% |
| B | 6584 | 99 | 1.503645% |
| C | 6584 | 177 | 2.688335% |
| D | 6584 | 339 | 5.148846% |
Noise dominated data is calculated using 1-second bins in cleaned event files. If a bin has >2000 counts, and if more than 50% of those come from <1% of pixels, then it is considered to be noise-dominated and hence unusable.
| Quadrant | # 1 sec bins | Bins with >0 counts | Bins with >2000 counts | High rate bins dominated by noise | Noise dominated (total time) | Noise dominated (detector-on time) | Marked lightcurve |
|---|---|---|---|---|---|---|---|
| A | 7654 | 6584 | 118 | 118 | 1.54% | 1.79% | 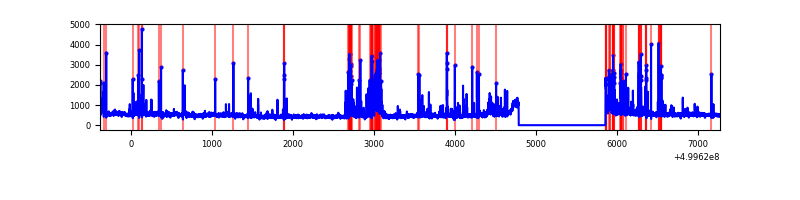 |
| B | 7654 | 6584 | 13 | 13 | 0.17% | 0.20% | 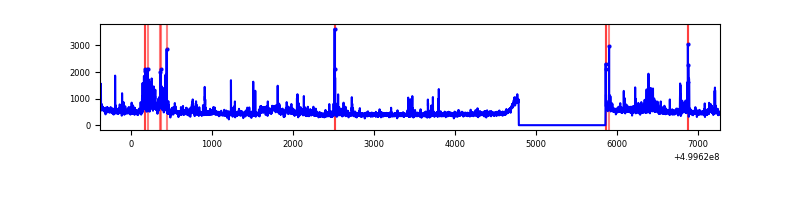 |
| C | 7654 | 6584 | 90 | 90 | 1.18% | 1.37% | 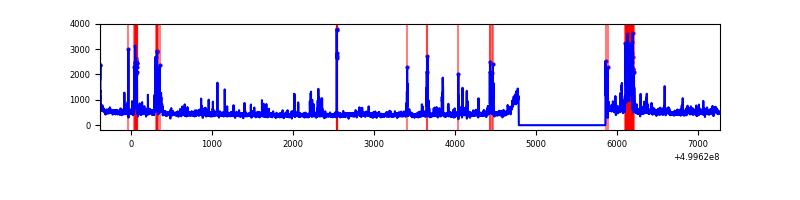 |
| D | 7654 | 6584 | 226 | 226 | 2.95% | 3.43% | 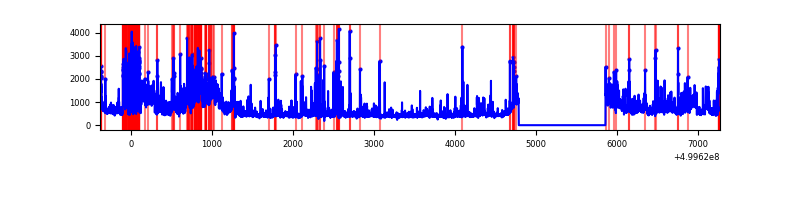 |
Top three noisy pixels from each quadrant. If the there are fewer than three noisy pixels in the level2.evt file, extra rows are filled as -1
| Pixel properties | Quadrant properties | ||||||
|---|---|---|---|---|---|---|---|
| Quadrant | DetID | PixID | Counts | Sigma | Mean | Median | Sigma |
| A | 0 | 8 | 296449 | 1611.32 | 744 | 727 | 183.5 |
| A | 3 | 14 | 281461 | 1529.66 | 744 | 727 | 183.5 |
| A | 11 | 3 | 185960 | 1009.29 | 744 | 727 | 183.5 |
| B | 5 | 185 | 158561 | 990.1 | 737 | 711 | 159.4 |
| B | 0 | 213 | 121571 | 758.08 | 737 | 711 | 159.4 |
| B | 10 | 247 | 56111 | 347.49 | 737 | 711 | 159.4 |
| C | 15 | 254 | 310975 | 1572.09 | 723 | 717 | 197.4 |
| C | 13 | 3 | 97505 | 490.43 | 723 | 717 | 197.4 |
| C | 1 | 16 | 74436 | 373.54 | 723 | 717 | 197.4 |
| D | 12 | 33 | 913662 | 4404.38 | 719 | 686 | 207.3 |
| D | 2 | 62 | 524052 | 2524.82 | 719 | 686 | 207.3 |
| D | 3 | 12 | 196563 | 944.95 | 719 | 686 | 207.3 |
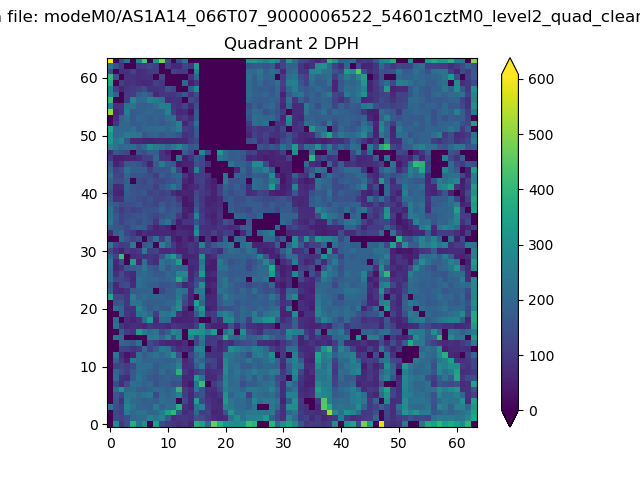
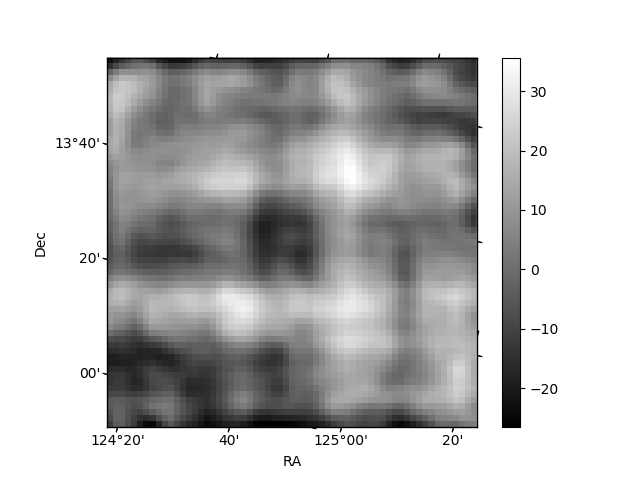
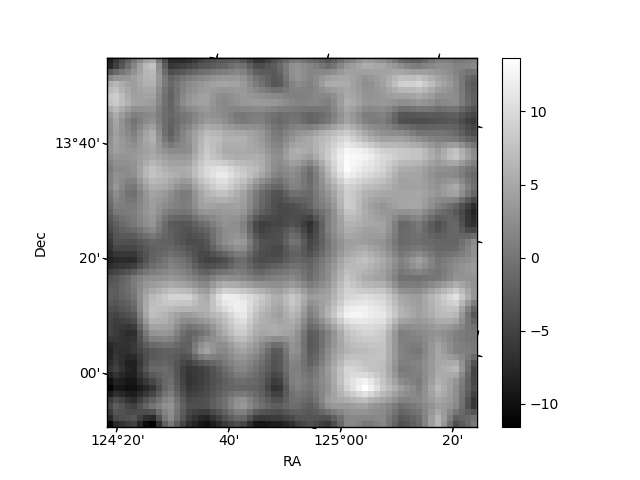
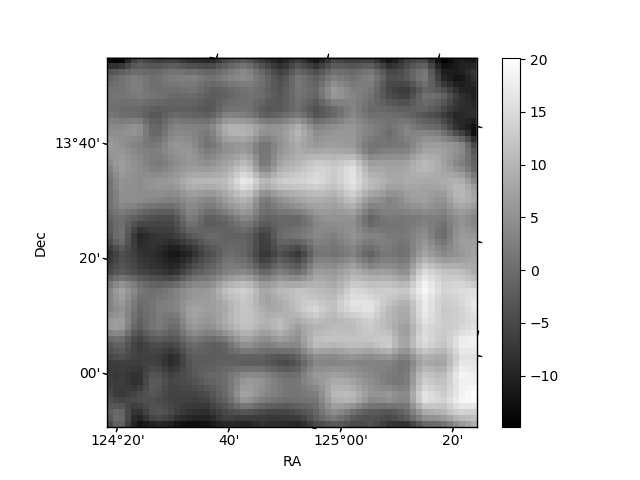
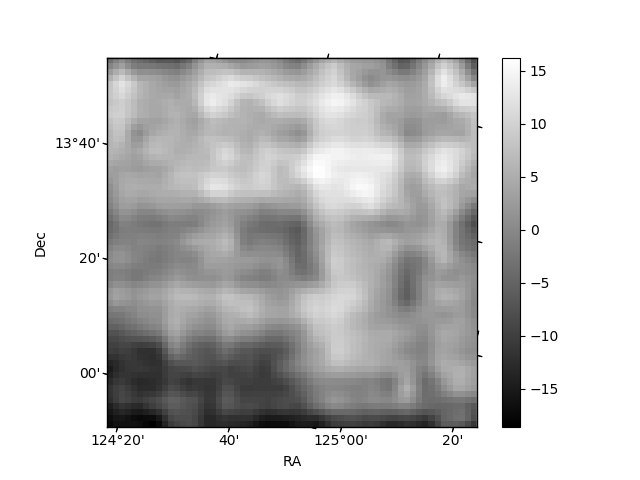
Histogram calculated using DETX and DETY for each event in the final _common_clean file
| Quadrant A | 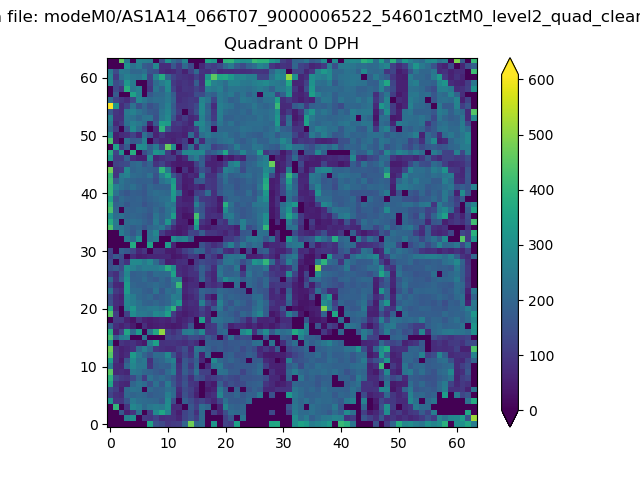 |
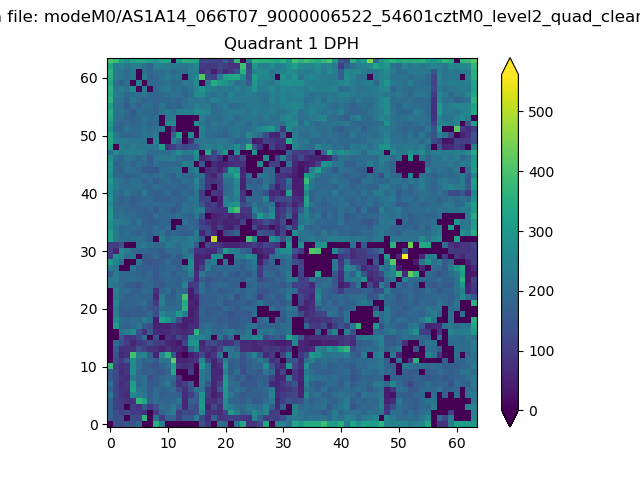 |
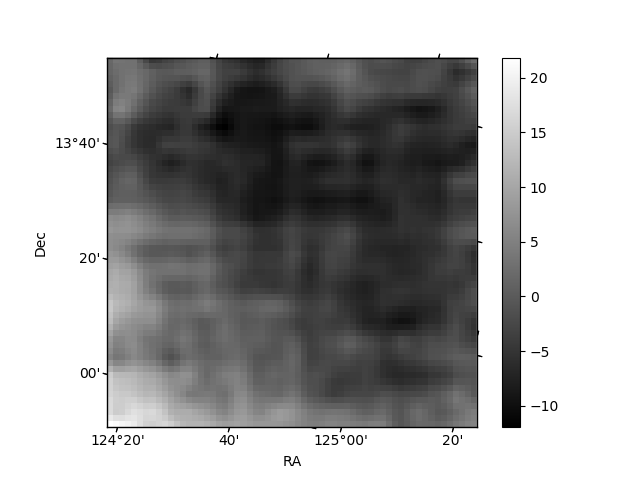
Quadrant B |
|---|---|---|---|
| Quadrant D | 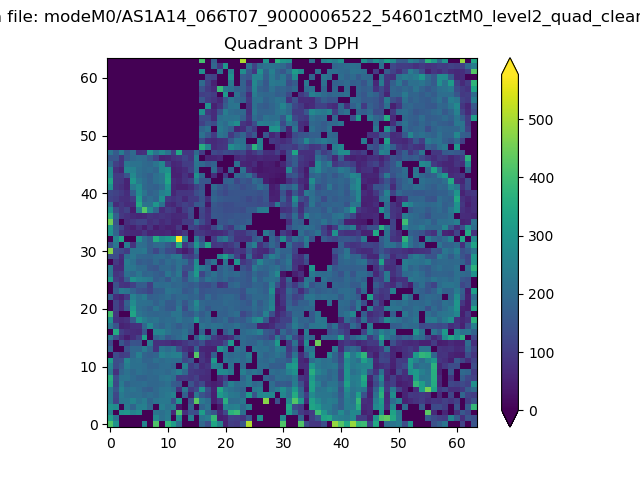 |
 |
Quadrant C |
| Plot type | Count rate plots | Images |
|---|---|---|
| Comparison with Poisson distribution Blue bars denote a histogram of data divided into 1 sec bins. Red curve is a Poisson curve with rate = median count rate of data. |
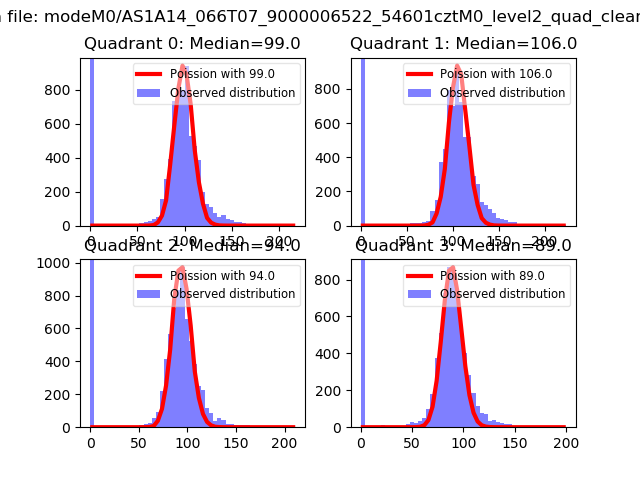 |
 |
| Quadrant-wise count rates Data is divided into 100 sec bins |
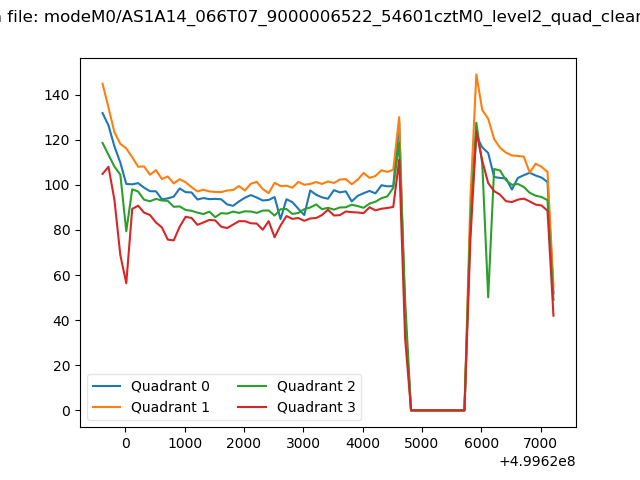 |
|
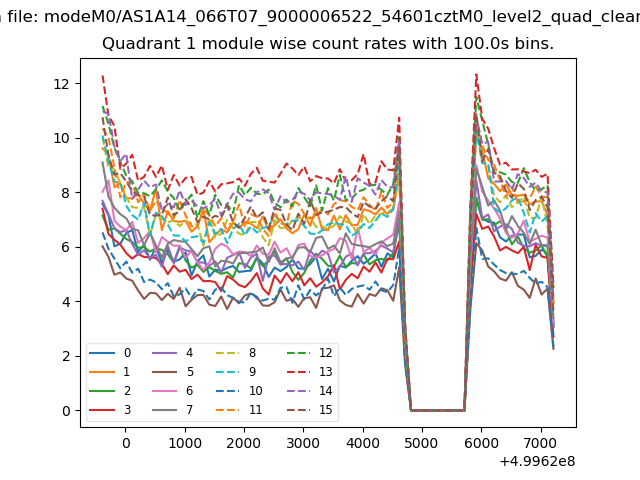
| Module-wise count rates for Quadrant A Data is divided into 100 sec bins |
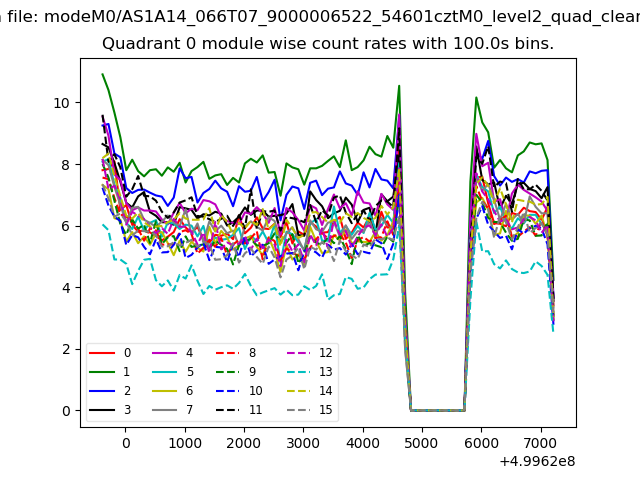 |
 |
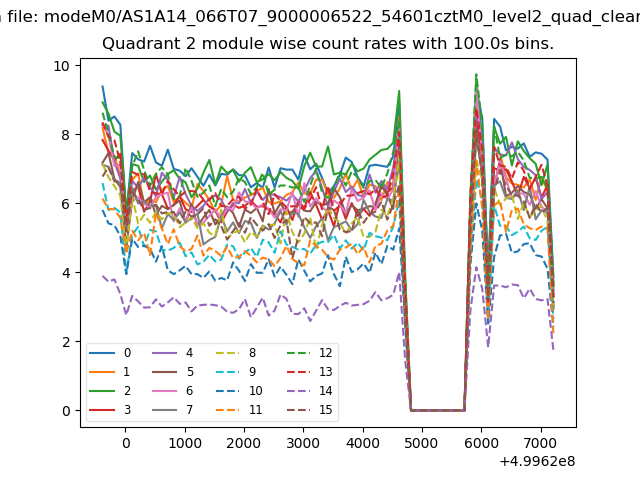
| Module-wise count rates for Quadrant B Data is divided into 100 sec bins |
 |
 |
| Module-wise count rates for Quadrant C Data is divided into 100 sec bins |
 |
 |
| Module-wise count rates for Quadrant D Data is divided into 100 sec bins |
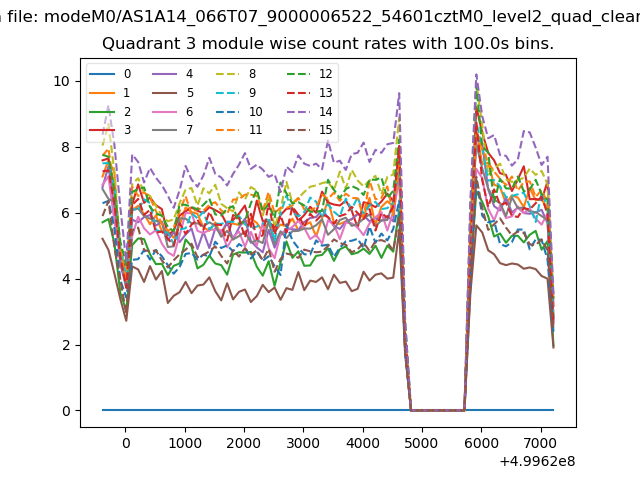 |
 |
| Parameter | Plot |
|---|---|
| CZT HV Monitor | 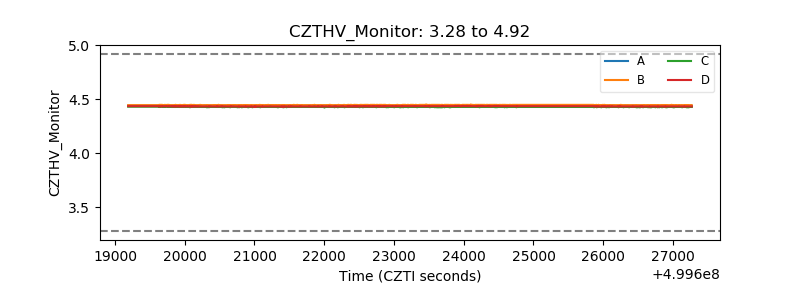 |
| D_VDD | 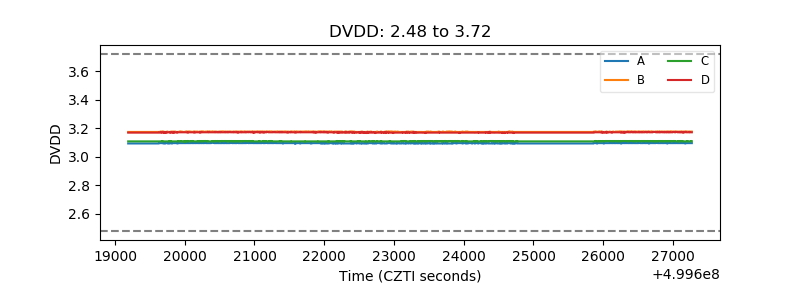 |
| Temperature 1 | 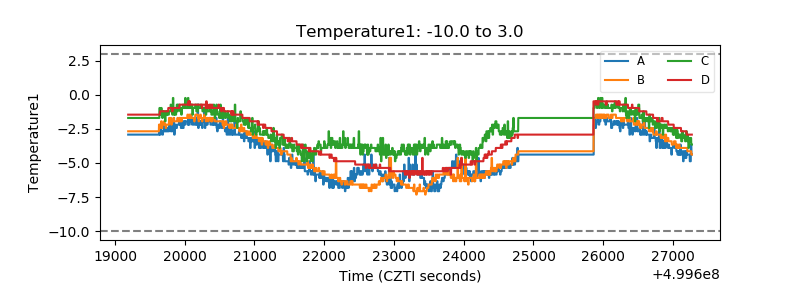 |
| Veto HV Monitor | 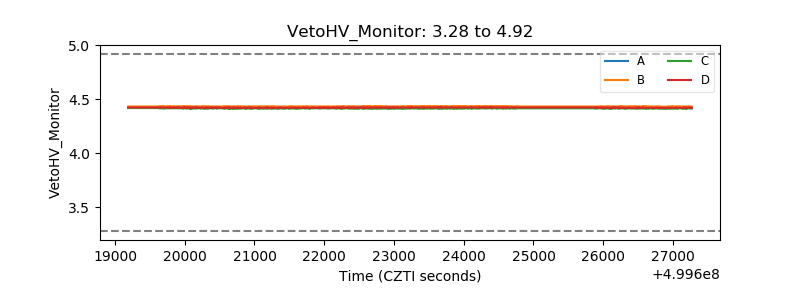 |
| Veto LLD | 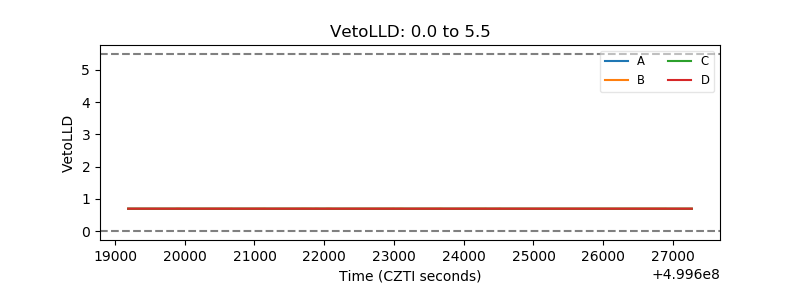 |
| Alpha Counter | 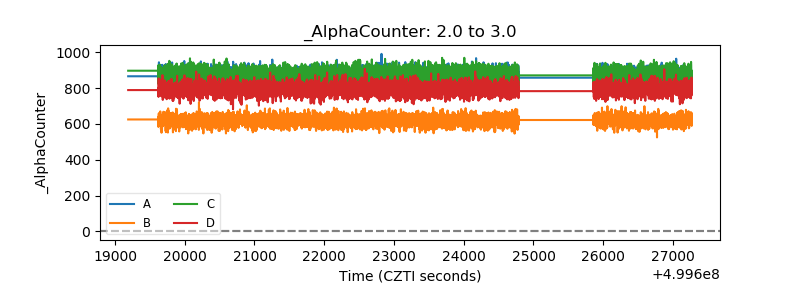 |
| _CPM_Rate | 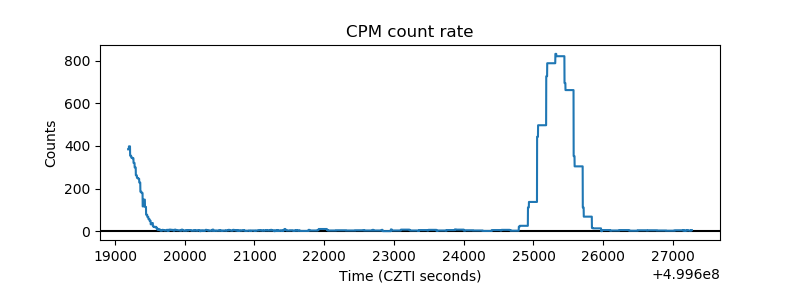 |
| CZT Counter |  |
| +2.5 Volts monitor | 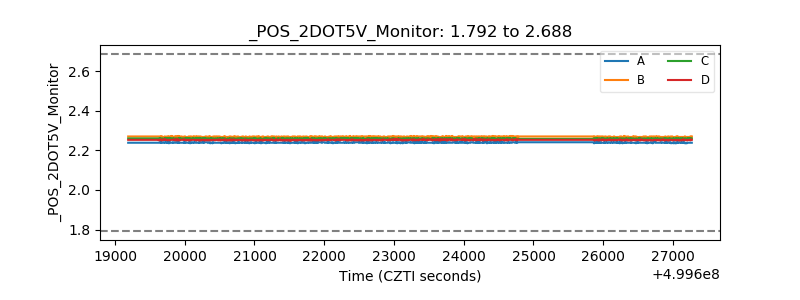 |
| +5 Volts monitor | 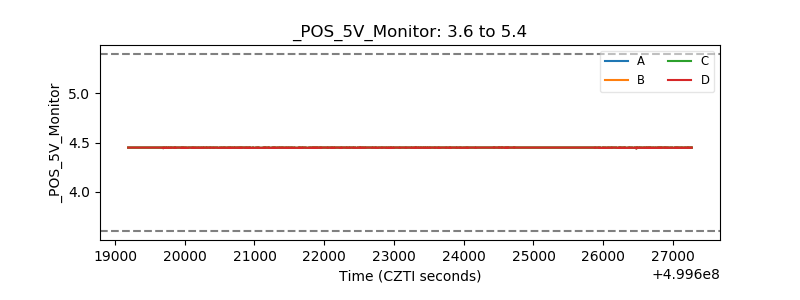 |
| _ROLL_ROT | 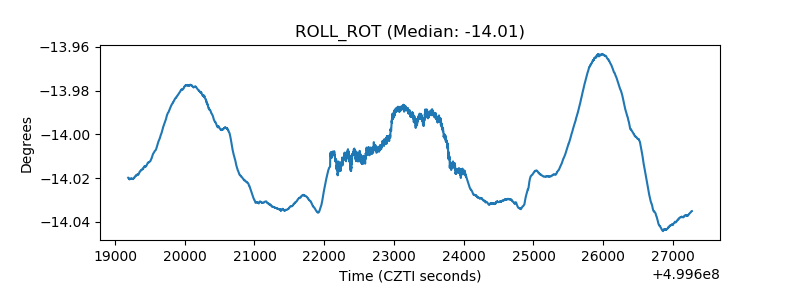 |
| _Roll_DEC | 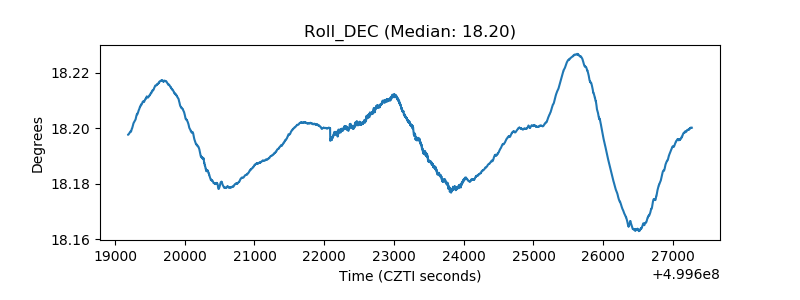 |
| _Roll_RA | 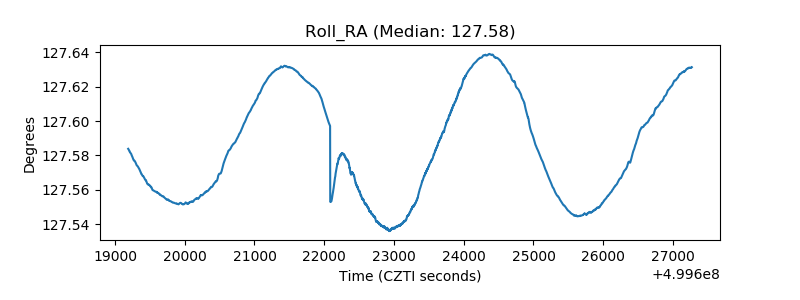 |
| Veto Counter | 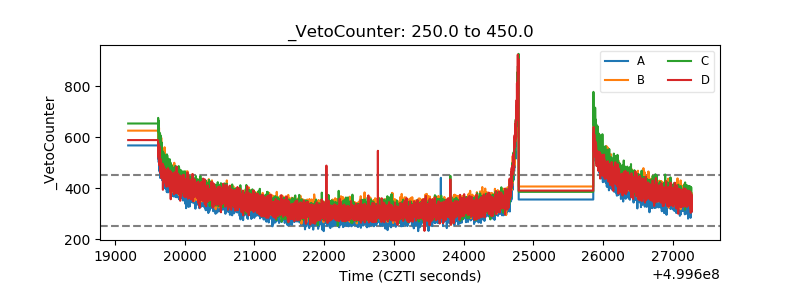 |