| Param | Original file | Final file |
|---|---|---|
| Filename | modeM0/AS1A14_066T07_9000006522_54603cztM0_level2.fits | modeM0/AS1A14_066T07_9000006522_54603cztM0_level2_quad_clean.evt |
| Size (bytes) | 482,639,040 | 97,119,360 |
| Size | 460.3 MB | 92.6 MB |
| Events in quadrant A | 5,262,727 | 628,271 |
| Events in quadrant B | 4,019,494 | 672,884 |
| Events in quadrant C | 3,254,318 | 620,990 |
| Events in quadrant D | 4,832,540 | 571,948 |
| Mode M9 | |||
|---|---|---|---|
| Quadrant | BADHDUFLAG | Total packets | Discarded packets |
| A | 0 | 21 | 0 |
| B | 0 | 22 | 0 |
| C | 0 | 22 | 0 |
| D | 0 | 22 | 0 |
| Mode M0 | |||
|---|---|---|---|
| Quadrant | BADHDUFLAG | Total packets | Discarded packets |
| A | 0 | 19893 | 2 |
| B | 0 | 16438 | 2 |
| C | 0 | 14281 | 2 |
| D | 0 | 18774 | 2 |
| Mode SS | |||
|---|---|---|---|
| Quadrant | BADHDUFLAG | Total packets | Discarded packets |
| A | 0 | 134 | 0 |
| B | 0 | 134 | 0 |
| C | 0 | 134 | 0 |
| D | 0 | 134 | 0 |
| Quadrant | Total seconds | Saturated seconds | Saturation percentage |
|---|---|---|---|
| A | 6396 | 457 | 7.145091% |
| B | 6396 | 393 | 6.144465% |
| C | 6396 | 108 | 1.688555% |
| D | 6396 | 302 | 4.721701% |
Noise dominated data is calculated using 1-second bins in cleaned event files. If a bin has >2000 counts, and if more than 50% of those come from <1% of pixels, then it is considered to be noise-dominated and hence unusable.
| Quadrant | # 1 sec bins | Bins with >0 counts | Bins with >2000 counts | High rate bins dominated by noise | Noise dominated (total time) | Noise dominated (detector-on time) | Marked lightcurve |
|---|---|---|---|---|---|---|---|
| A | 7566 | 6396 | 330 | 330 | 4.36% | 5.16% | 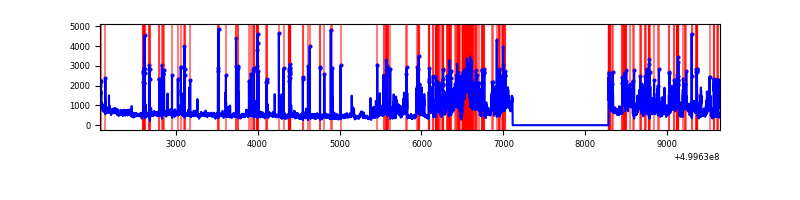 |
| B | 7566 | 6396 | 178 | 178 | 2.35% | 2.78% | 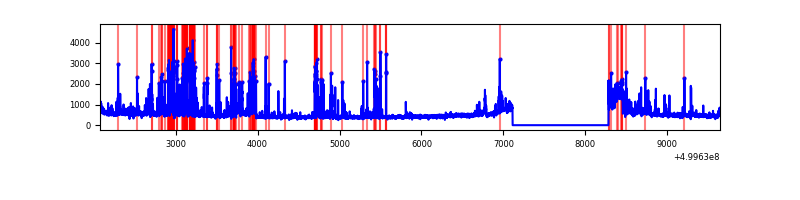 |
| C | 7566 | 6396 | 41 | 41 | 0.54% | 0.64% | 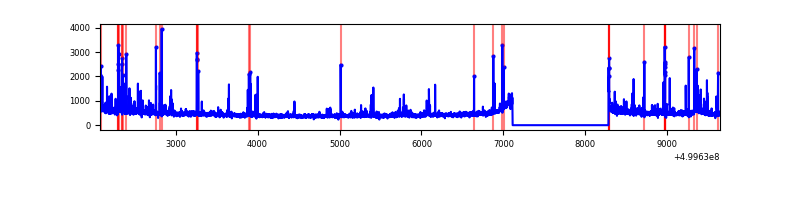 |
| D | 7566 | 6397 | 216 | 216 | 2.85% | 3.38% | 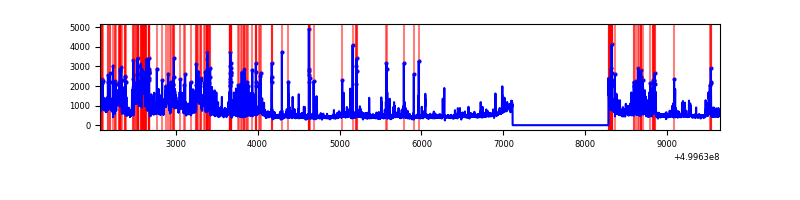 |
Top three noisy pixels from each quadrant. If the there are fewer than three noisy pixels in the level2.evt file, extra rows are filled as -1
| Pixel properties | Quadrant properties | ||||||
|---|---|---|---|---|---|---|---|
| Quadrant | DetID | PixID | Counts | Sigma | Mean | Median | Sigma |
| A | 3 | 14 | 1740635 | 9920.23 | 711 | 693 | 175.4 |
| A | 11 | 3 | 335816 | 1910.69 | 711 | 693 | 175.4 |
| A | 0 | 8 | 178797 | 1015.45 | 711 | 693 | 175.4 |
| B | 1 | 207 | 561077 | 3698.78 | 707 | 683 | 151.5 |
| B | 5 | 172 | 399689 | 2633.57 | 707 | 683 | 151.5 |
| B | 10 | 247 | 74768 | 488.99 | 707 | 683 | 151.5 |
| C | 13 | 3 | 213335 | 1085.38 | 714 | 708 | 195.9 |
| C | 12 | 249 | 42529 | 213.48 | 714 | 708 | 195.9 |
| C | 12 | 250 | 32123 | 160.36 | 714 | 708 | 195.9 |
| D | 2 | 172 | 769598 | 3831.03 | 701 | 671 | 200.7 |
| D | 3 | 12 | 379891 | 1889.39 | 701 | 671 | 200.7 |
| D | 8 | 160 | 215374 | 1069.72 | 701 | 671 | 200.7 |
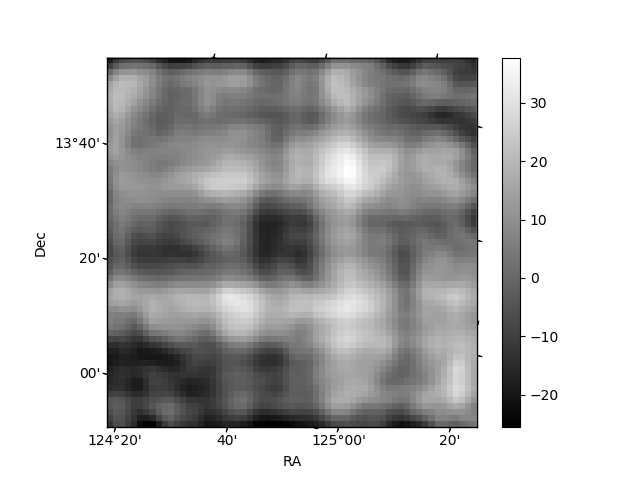
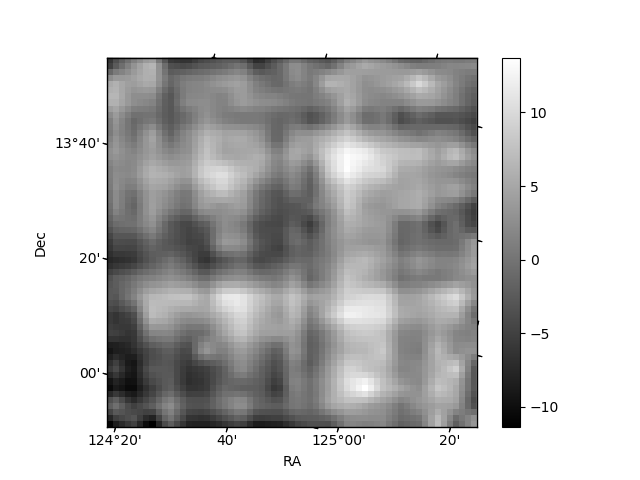
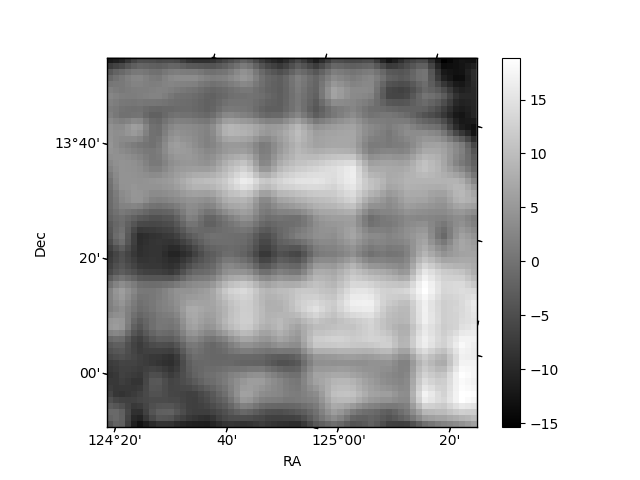
Histogram calculated using DETX and DETY for each event in the final _common_clean file
| Quadrant A | 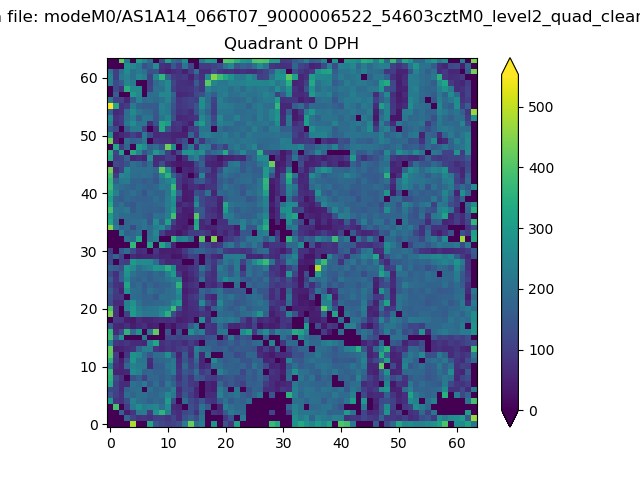 |
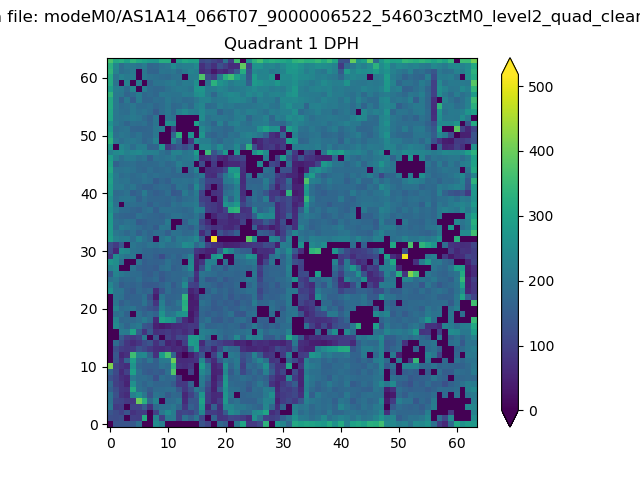 |
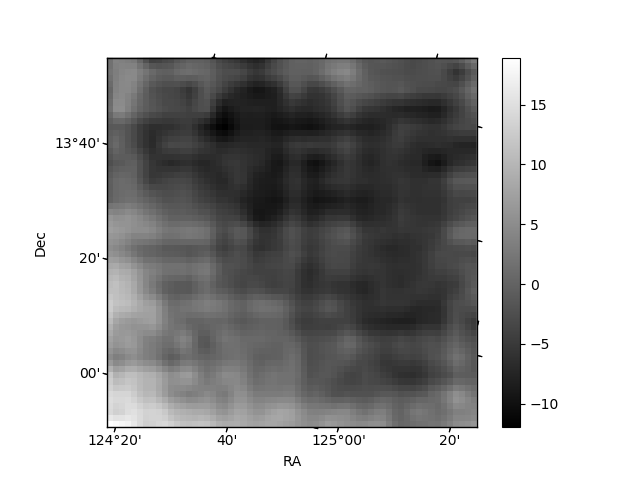
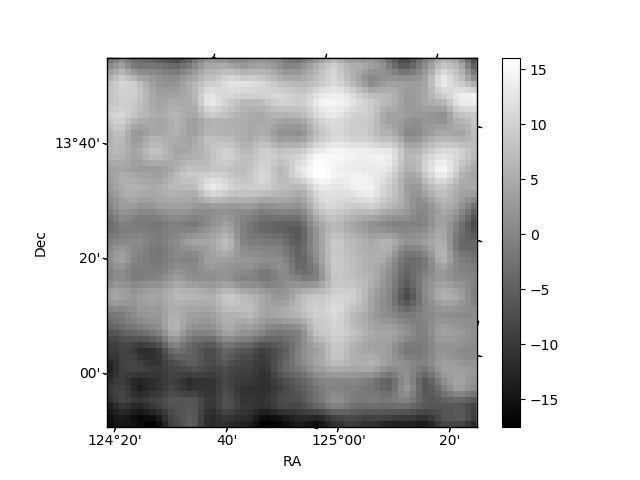
Quadrant B |
|---|---|---|---|
| Quadrant D | 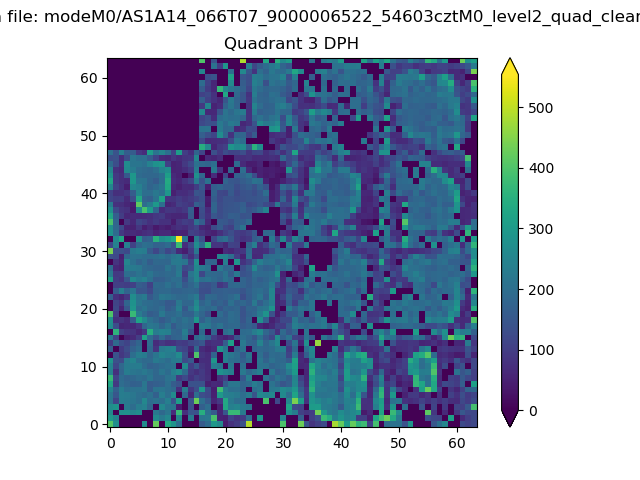 |
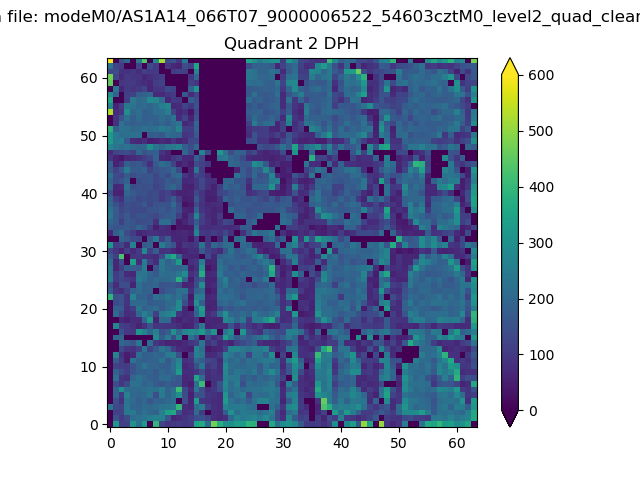 |
Quadrant C |
| Plot type | Count rate plots | Images |
|---|---|---|
| Comparison with Poisson distribution Blue bars denote a histogram of data divided into 1 sec bins. Red curve is a Poisson curve with rate = median count rate of data. |
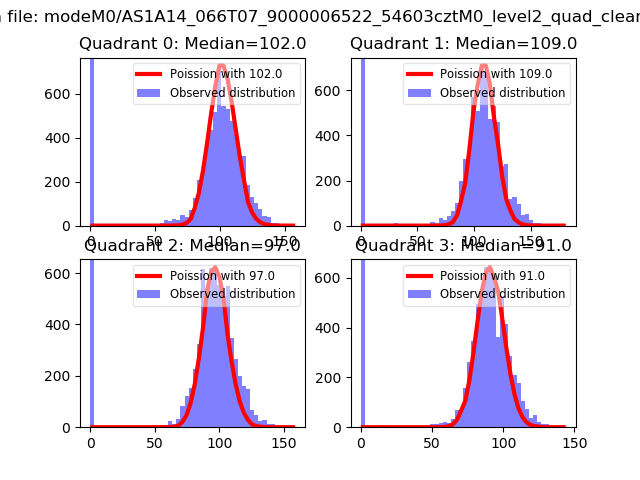 |
 |
| Quadrant-wise count rates Data is divided into 100 sec bins |
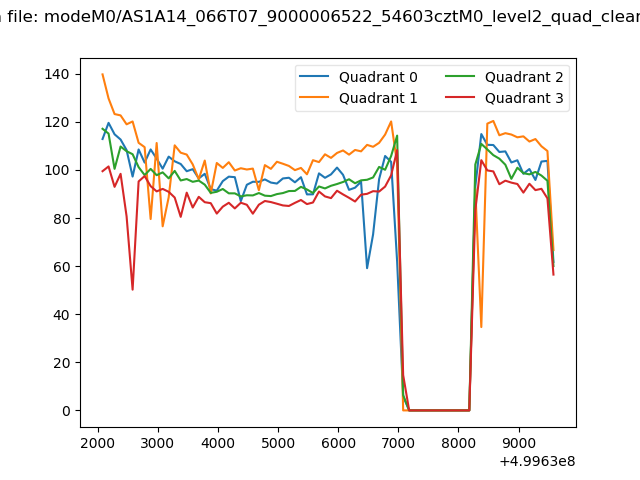 |
|
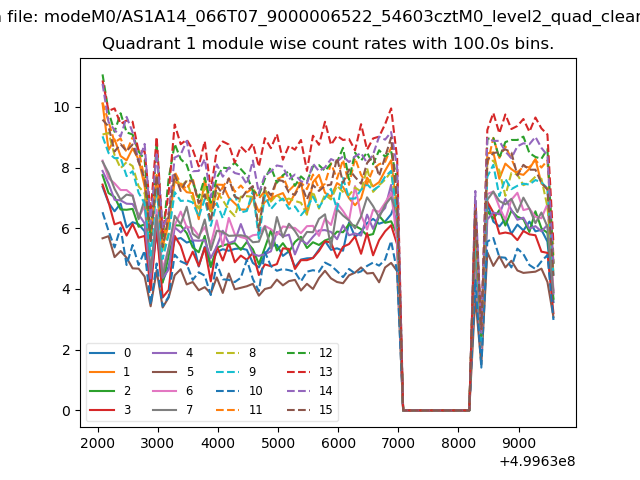
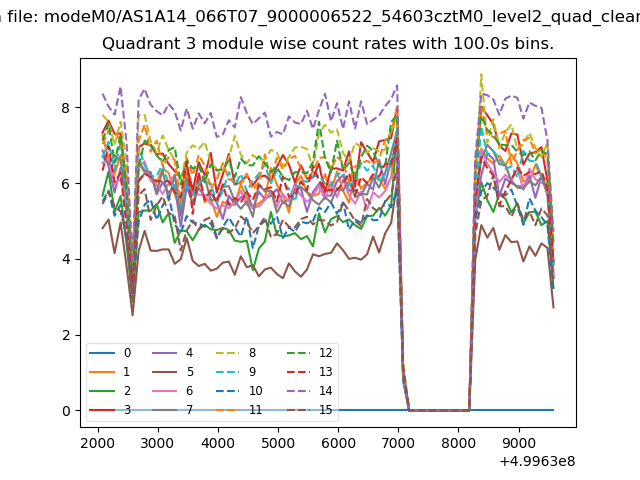
| Module-wise count rates for Quadrant A Data is divided into 100 sec bins |
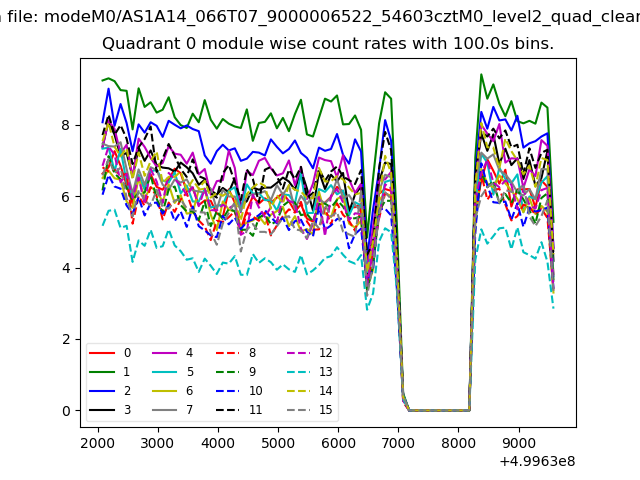 |
 |
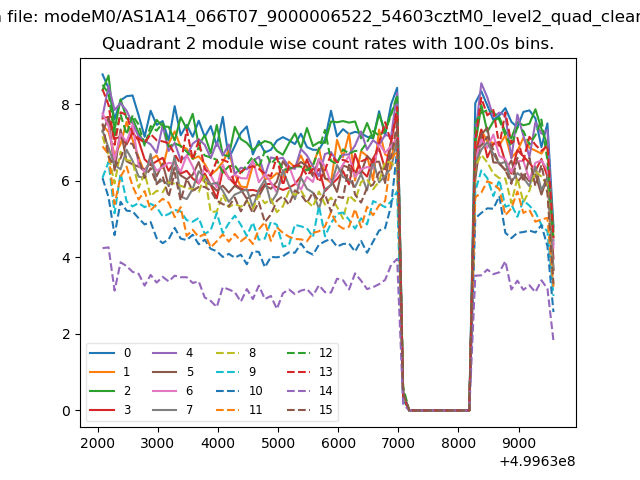
| Module-wise count rates for Quadrant B Data is divided into 100 sec bins |
 |
 |
| Module-wise count rates for Quadrant C Data is divided into 100 sec bins |
 |
 |
| Module-wise count rates for Quadrant D Data is divided into 100 sec bins |
 |
 |
| Parameter | Plot |
|---|---|
| CZT HV Monitor | 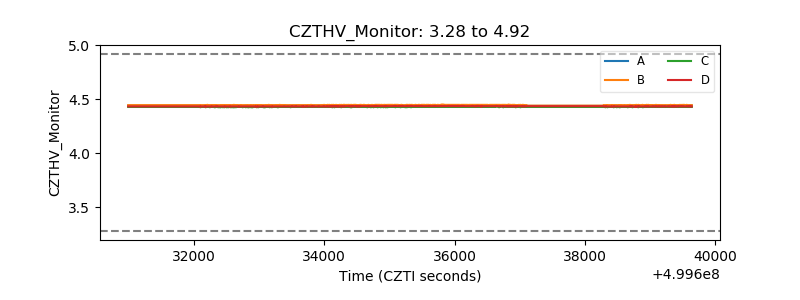 |
| D_VDD | 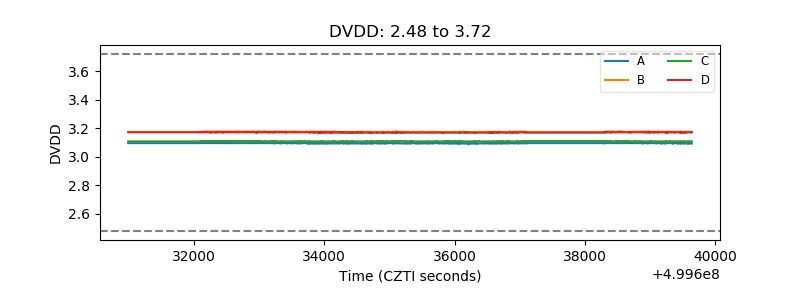 |
| Temperature 1 | 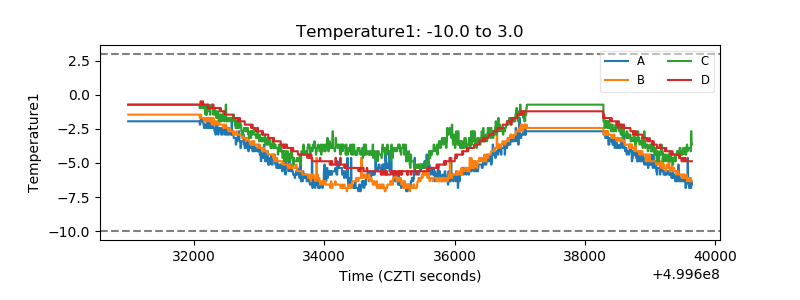 |
| Veto HV Monitor | 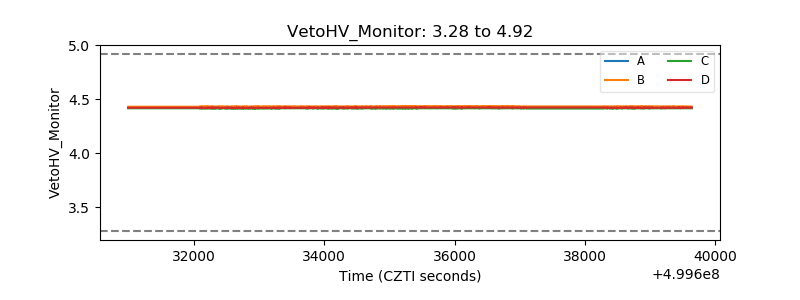 |
| Veto LLD | 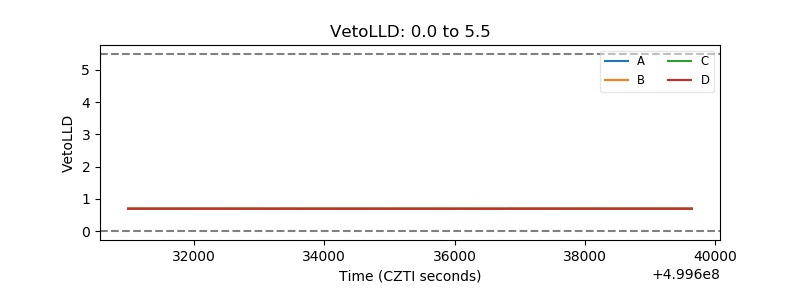 |
| Alpha Counter | 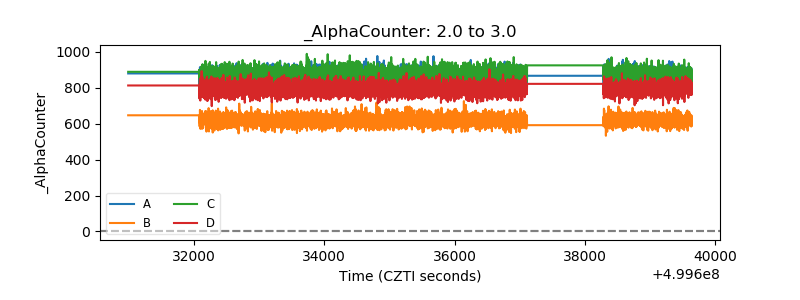 |
| _CPM_Rate | 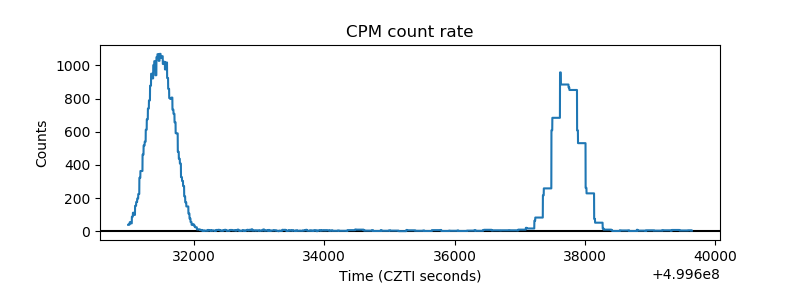 |
| CZT Counter | 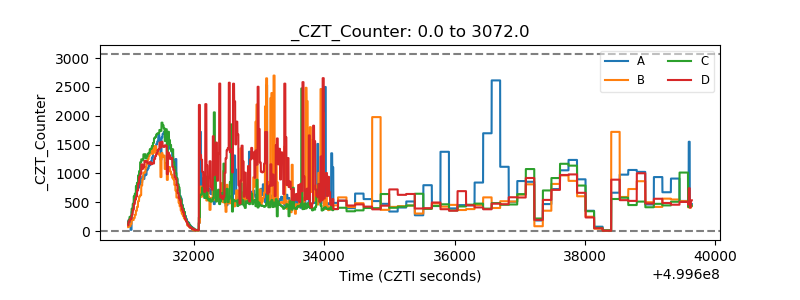 |
| +2.5 Volts monitor |  |
| +5 Volts monitor | 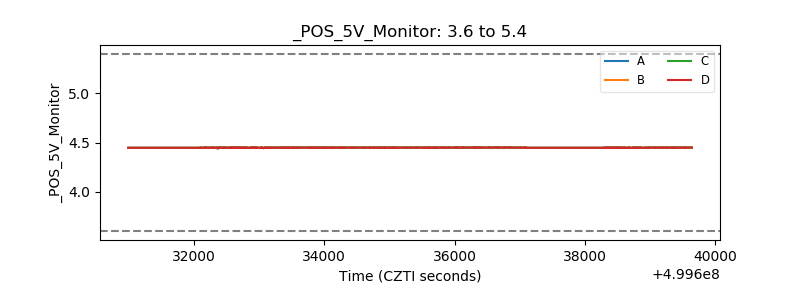 |
| _ROLL_ROT | 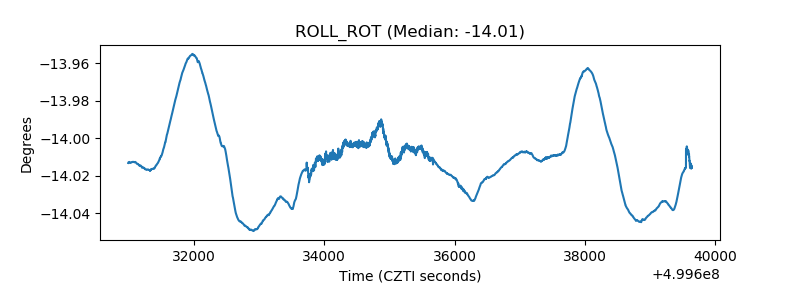 |
| _Roll_DEC | 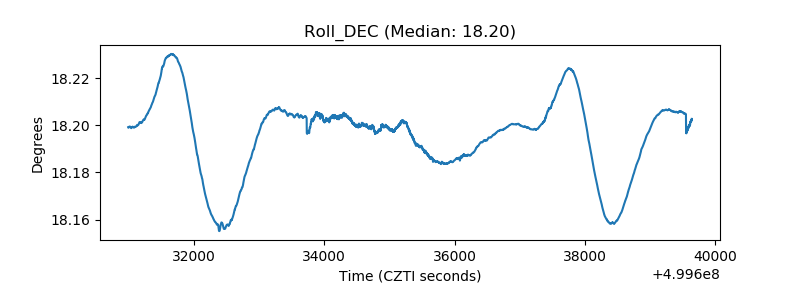 |
| _Roll_RA | 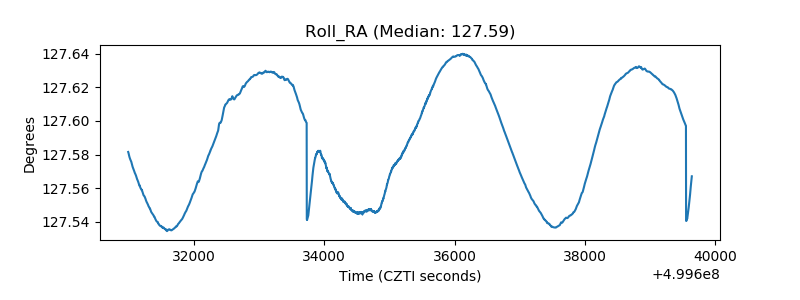 |
| Veto Counter | 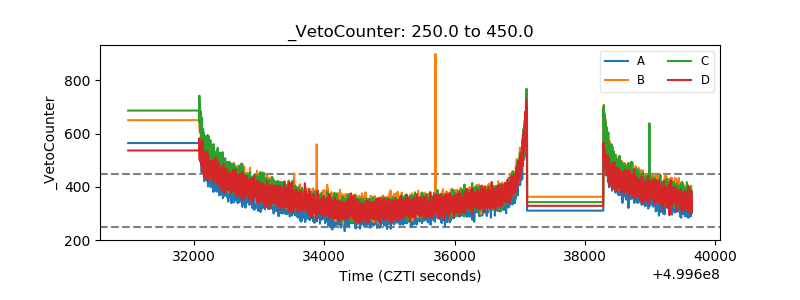 |