| Param | Original file | Final file |
|---|---|---|
| Filename | modeM0/AS1A14_066T07_9000006522_54604cztM0_level2.fits | modeM0/AS1A14_066T07_9000006522_54604cztM0_level2_quad_clean.evt |
| Size (bytes) | 539,593,920 | 96,670,080 |
| Size | 514.6 MB | 92.2 MB |
| Events in quadrant A | 6,502,610 | 625,021 |
| Events in quadrant B | 4,074,168 | 672,129 |
| Events in quadrant C | 3,602,801 | 618,896 |
| Events in quadrant D | 5,288,979 | 556,152 |
| Mode M9 | |||
|---|---|---|---|
| Quadrant | BADHDUFLAG | Total packets | Discarded packets |
| A | 0 | 13 | 0 |
| B | 0 | 14 | 0 |
| C | 0 | 14 | 0 |
| D | 0 | 14 | 0 |
| Mode M0 | |||
|---|---|---|---|
| Quadrant | BADHDUFLAG | Total packets | Discarded packets |
| A | 0 | 23905 | 4 |
| B | 0 | 16698 | 2 |
| C | 0 | 15189 | 2 |
| D | 0 | 20348 | 2 |
| Mode SS | |||
|---|---|---|---|
| Quadrant | BADHDUFLAG | Total packets | Discarded packets |
| A | 0 | 134 | 0 |
| B | 0 | 134 | 0 |
| C | 0 | 134 | 0 |
| D | 0 | 134 | 0 |
| Quadrant | Total seconds | Saturated seconds | Saturation percentage |
|---|---|---|---|
| A | 6518 | 572 | 8.775698% |
| B | 6518 | 410 | 6.290273% |
| C | 6518 | 132 | 2.025161% |
| D | 6518 | 407 | 6.244247% |
Noise dominated data is calculated using 1-second bins in cleaned event files. If a bin has >2000 counts, and if more than 50% of those come from <1% of pixels, then it is considered to be noise-dominated and hence unusable.
| Quadrant | # 1 sec bins | Bins with >0 counts | Bins with >2000 counts | High rate bins dominated by noise | Noise dominated (total time) | Noise dominated (detector-on time) | Marked lightcurve |
|---|---|---|---|---|---|---|---|
| A | 7668 | 6519 | 484 | 484 | 6.31% | 7.42% | 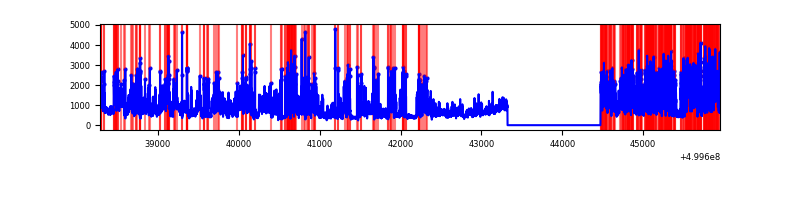 |
| B | 7668 | 6519 | 167 | 167 | 2.18% | 2.56% | 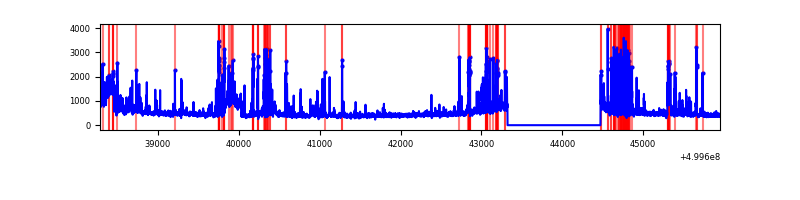 |
| C | 7668 | 6519 | 90 | 90 | 1.17% | 1.38% | 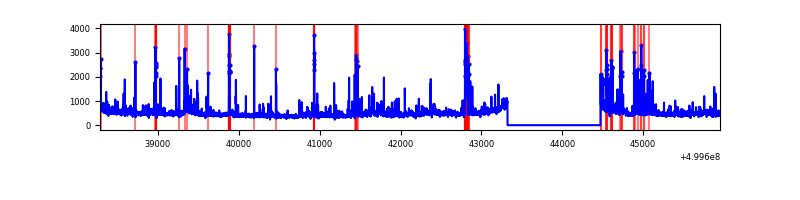 |
| D | 7668 | 6519 | 437 | 437 | 5.70% | 6.70% | 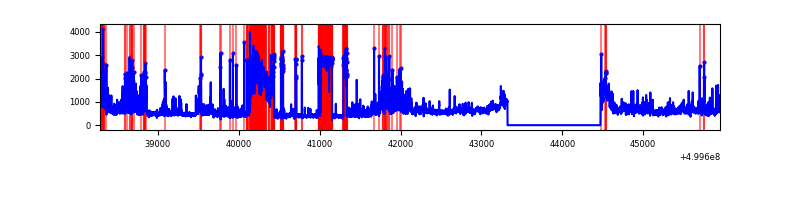 |
Top three noisy pixels from each quadrant. If the there are fewer than three noisy pixels in the level2.evt file, extra rows are filled as -1
| Pixel properties | Quadrant properties | ||||||
|---|---|---|---|---|---|---|---|
| Quadrant | DetID | PixID | Counts | Sigma | Mean | Median | Sigma |
| A | 3 | 14 | 3141487 | 17855.05 | 709 | 692 | 175.9 |
| A | 11 | 3 | 240981 | 1366.01 | 709 | 692 | 175.9 |
| A | 13 | 248 | 168683 | 955.01 | 709 | 692 | 175.9 |
| B | 1 | 207 | 507252 | 3355.33 | 703 | 679 | 151.0 |
| B | 5 | 172 | 421442 | 2786.96 | 703 | 679 | 151.0 |
| B | 10 | 247 | 150964 | 995.43 | 703 | 679 | 151.0 |
| C | 13 | 3 | 348317 | 1789.49 | 708 | 701 | 194.3 |
| C | 6 | 223 | 149425 | 765.61 | 708 | 701 | 194.3 |
| C | 3 | 248 | 86059 | 439.41 | 708 | 701 | 194.3 |
| D | 9 | 19 | 1658886 | 8372.05 | 690 | 658 | 198.1 |
| D | 8 | 160 | 274604 | 1383.1 | 690 | 658 | 198.1 |
| D | 5 | 113 | 116004 | 582.36 | 690 | 658 | 198.1 |
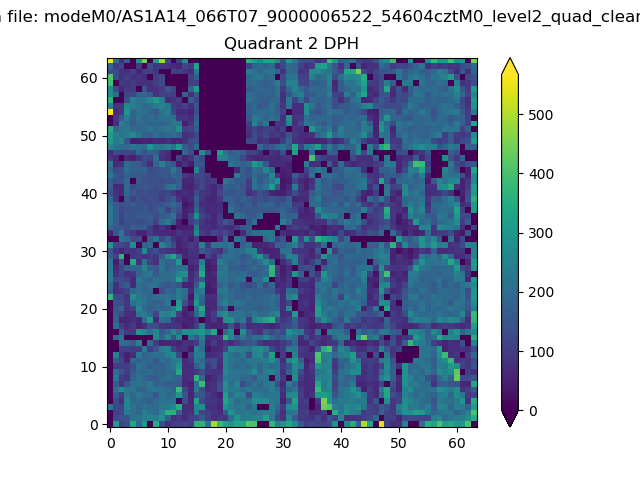
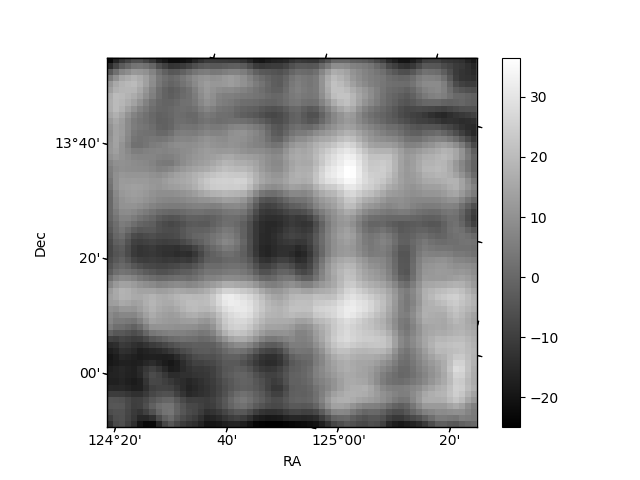
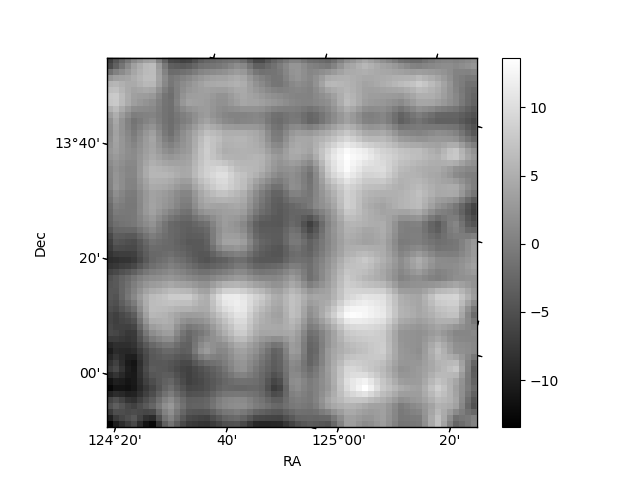
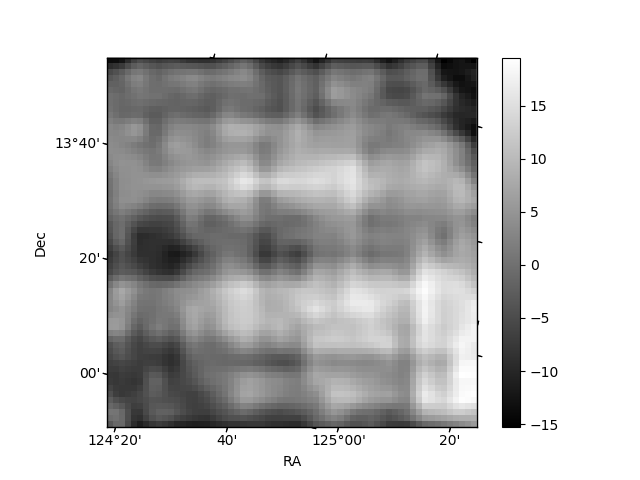
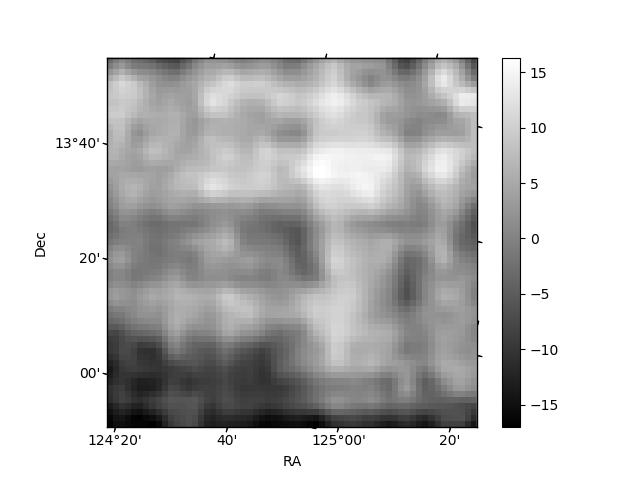
Histogram calculated using DETX and DETY for each event in the final _common_clean file
| Quadrant A | 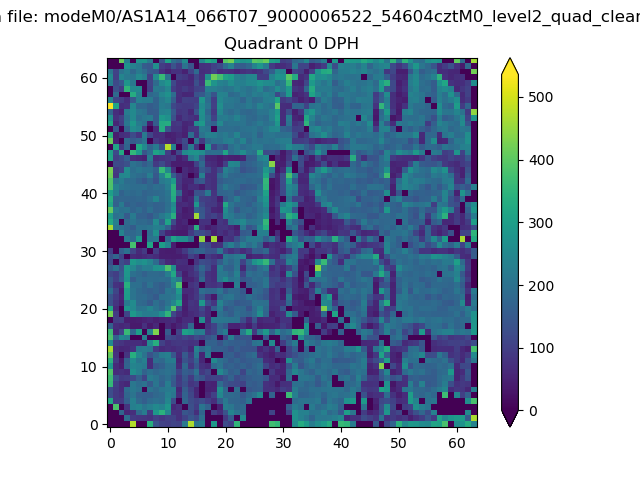 |
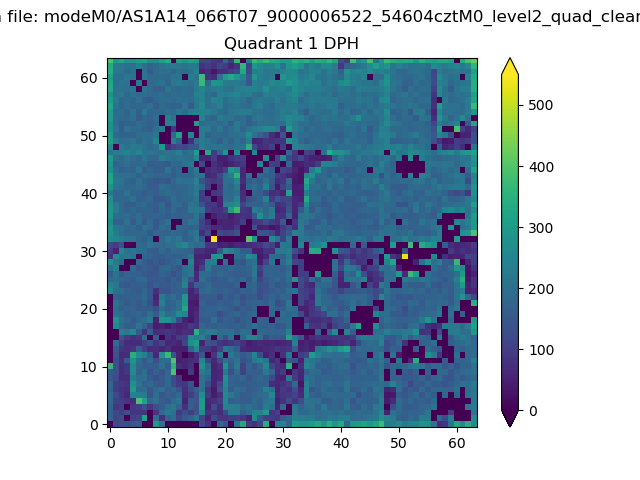 |
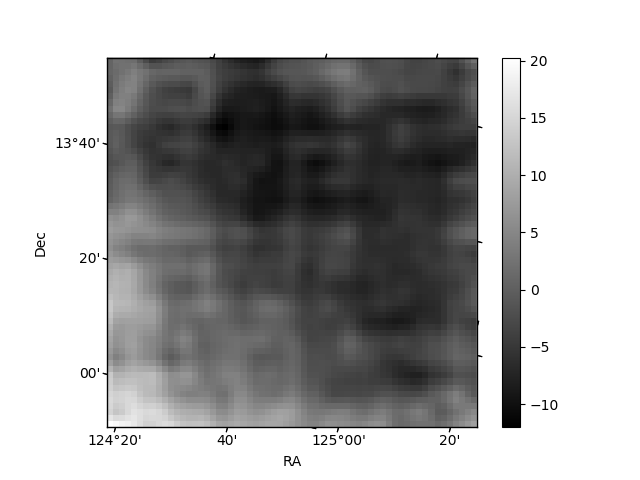
Quadrant B |
|---|---|---|---|
| Quadrant D | 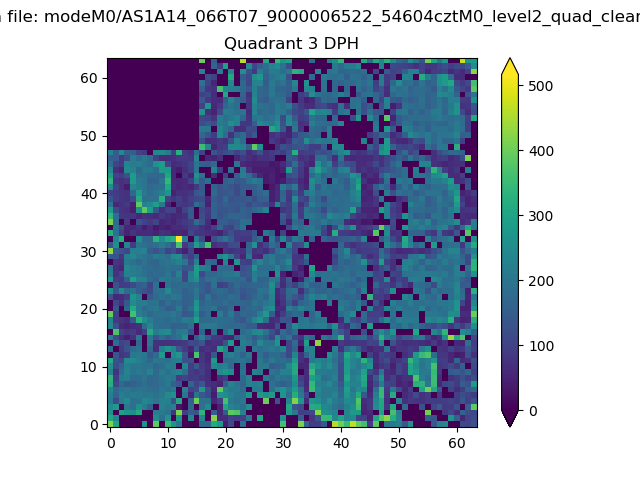 |
 |
Quadrant C |
| Plot type | Count rate plots | Images |
|---|---|---|
| Comparison with Poisson distribution Blue bars denote a histogram of data divided into 1 sec bins. Red curve is a Poisson curve with rate = median count rate of data. |
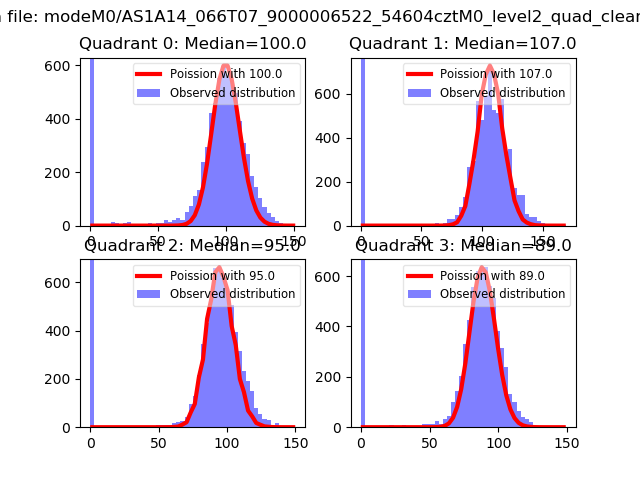 |
 |
| Quadrant-wise count rates Data is divided into 100 sec bins |
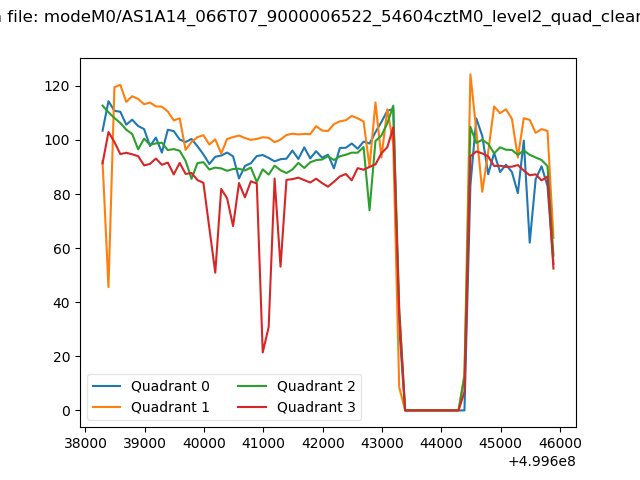 |
|
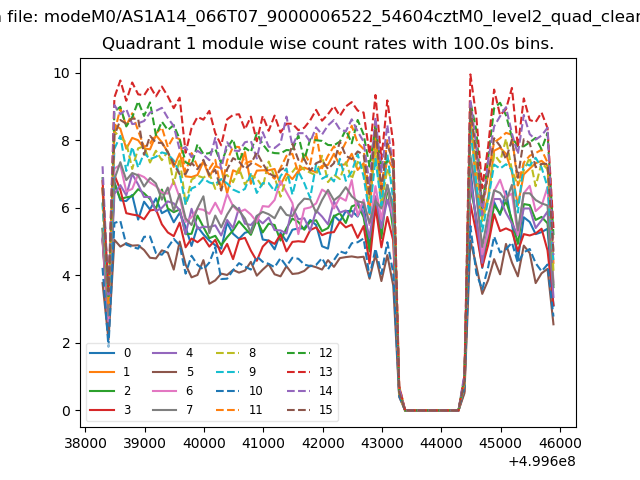
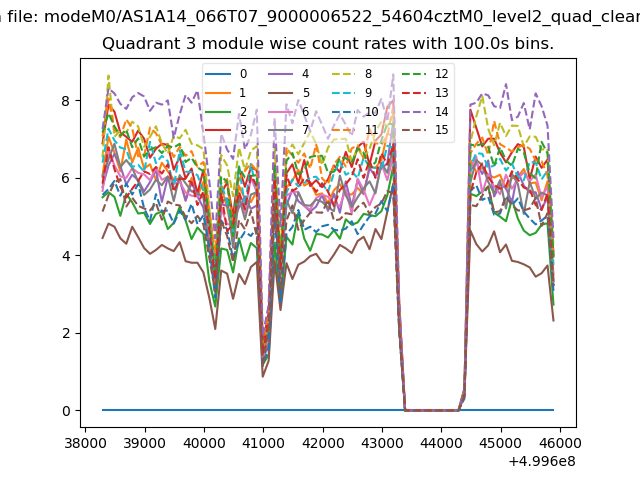
| Module-wise count rates for Quadrant A Data is divided into 100 sec bins |
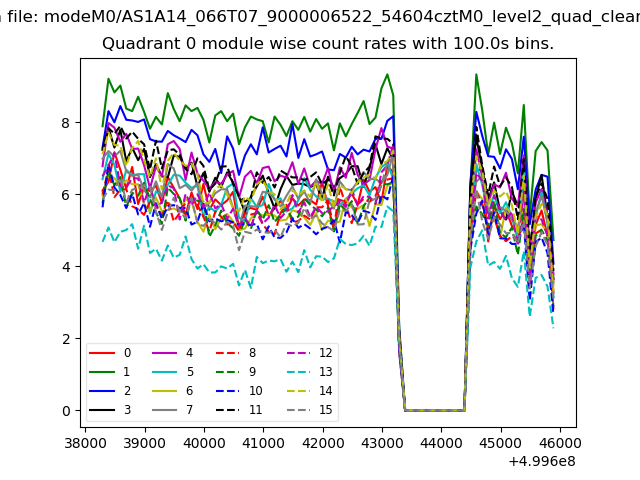 |
 |
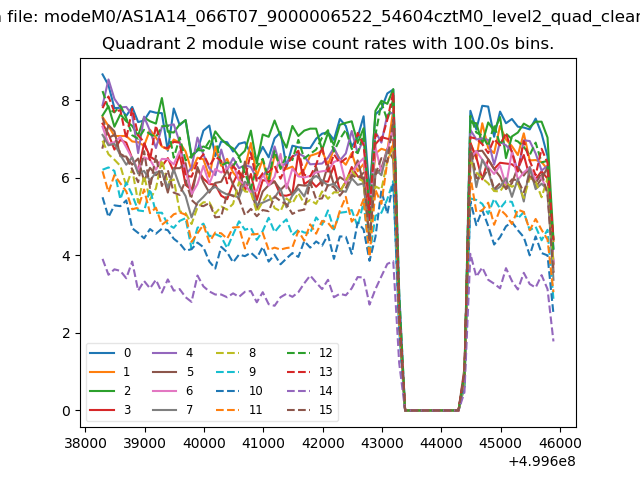
| Module-wise count rates for Quadrant B Data is divided into 100 sec bins |
 |
 |
| Module-wise count rates for Quadrant C Data is divided into 100 sec bins |
 |
 |
| Module-wise count rates for Quadrant D Data is divided into 100 sec bins |
 |
 |
| Parameter | Plot |
|---|---|
| CZT HV Monitor | 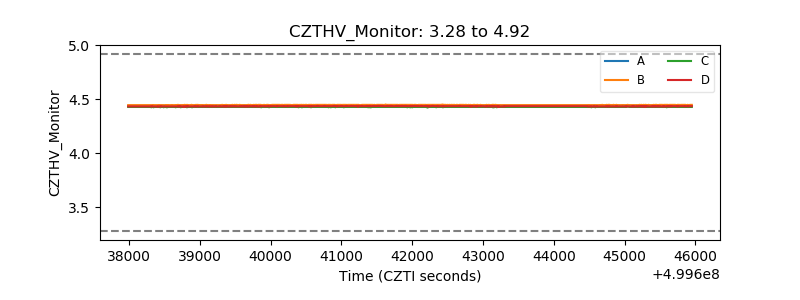 |
| D_VDD | 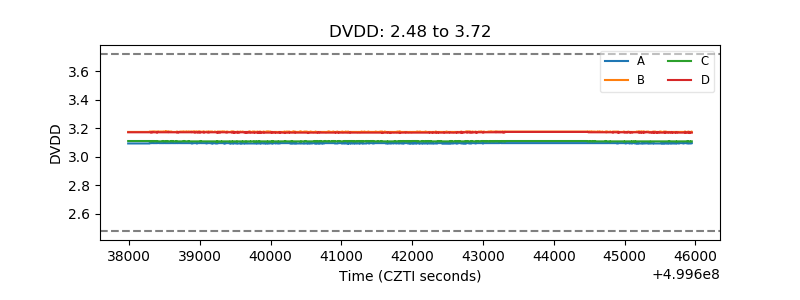 |
| Temperature 1 | 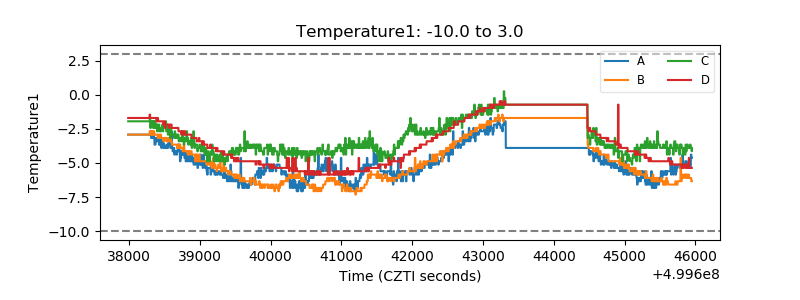 |
| Veto HV Monitor | 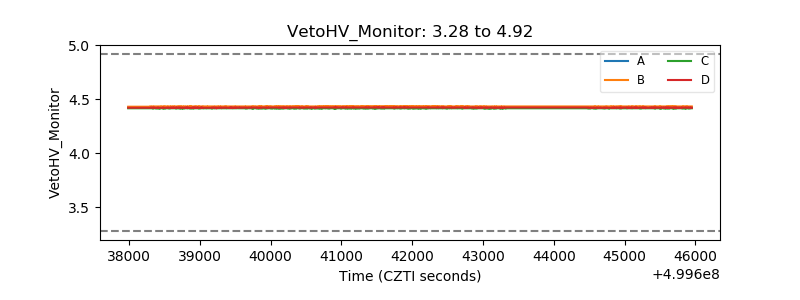 |
| Veto LLD | 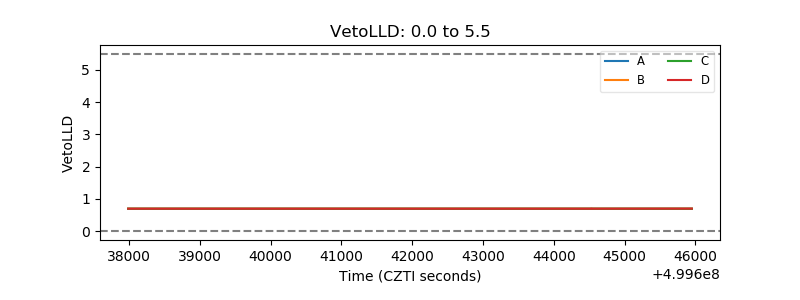 |
| Alpha Counter | 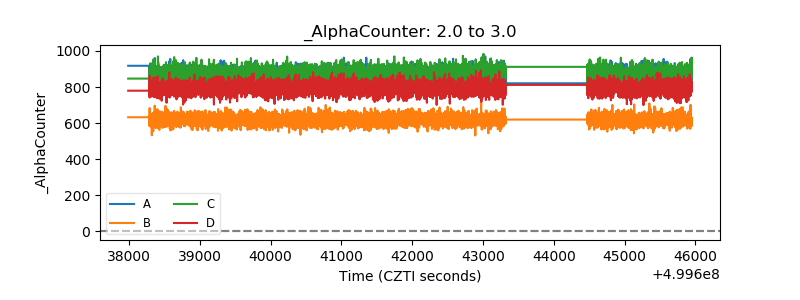 |
| _CPM_Rate | 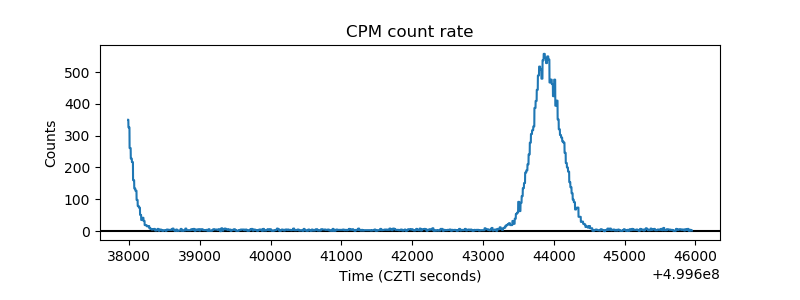 |
| CZT Counter | 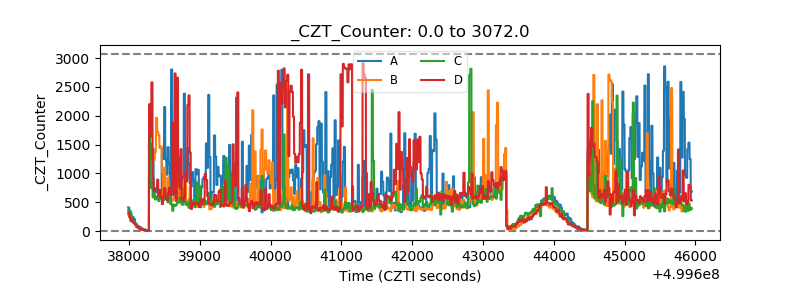 |
| +2.5 Volts monitor |  |
| +5 Volts monitor | 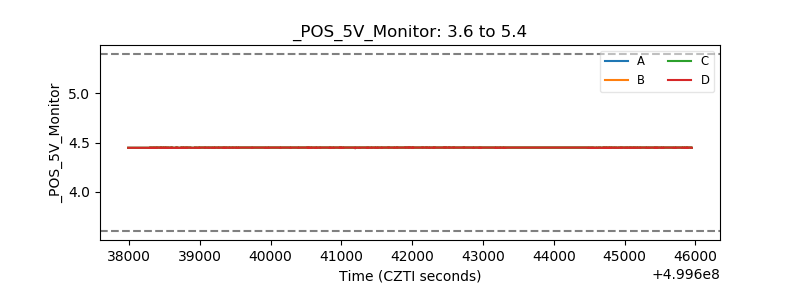 |
| _ROLL_ROT | 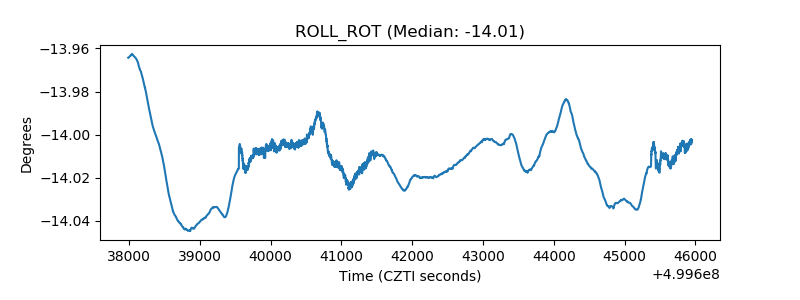 |
| _Roll_DEC | 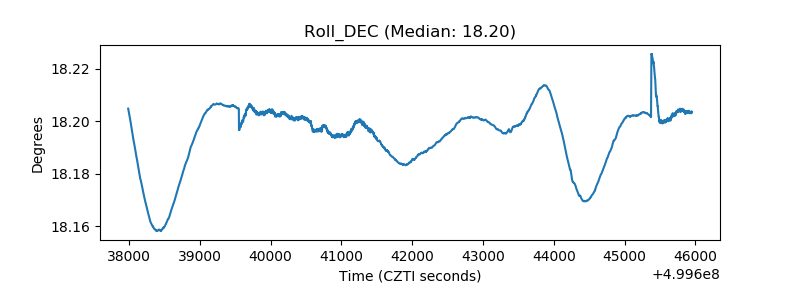 |
| _Roll_RA | 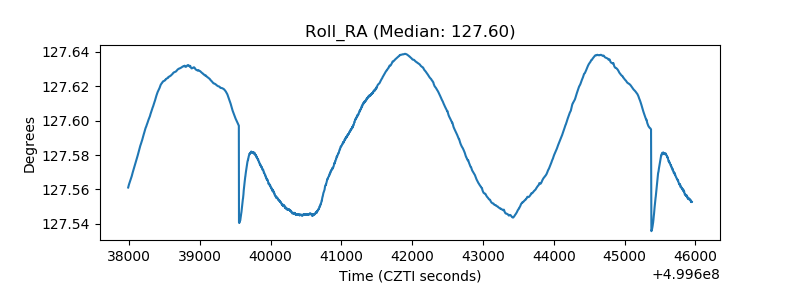 |
| Veto Counter | 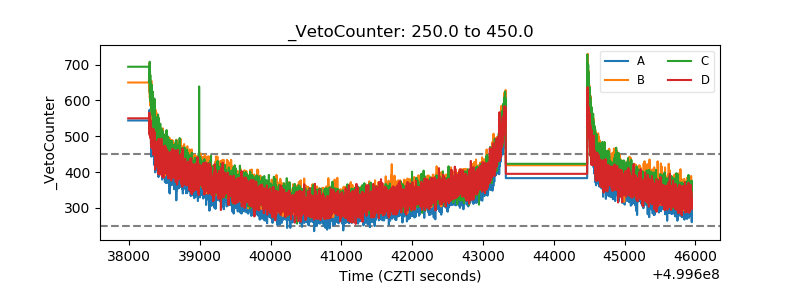 |