| Param | Original file | Final file |
|---|---|---|
| Filename | modeM0/AS1A14_066T07_9000006522_54605cztM0_level2.fits | modeM0/AS1A14_066T07_9000006522_54605cztM0_level2_quad_clean.evt |
| Size (bytes) | 571,677,120 | 94,694,400 |
| Size | 545.2 MB | 90.3 MB |
| Events in quadrant A | 9,304,279 | 540,423 |
| Events in quadrant B | 3,659,674 | 677,297 |
| Events in quadrant C | 3,716,205 | 610,734 |
| Events in quadrant D | 3,967,254 | 576,130 |
| Mode M9 | |||
|---|---|---|---|
| Quadrant | BADHDUFLAG | Total packets | Discarded packets |
| A | 0 | 13 | 0 |
| B | 0 | 14 | 0 |
| C | 0 | 14 | 0 |
| D | 0 | 14 | 0 |
| Mode M0 | |||
|---|---|---|---|
| Quadrant | BADHDUFLAG | Total packets | Discarded packets |
| A | 0 | 32269 | 7 |
| B | 0 | 15703 | 2 |
| C | 0 | 15674 | 2 |
| D | 0 | 16389 | 2 |
| Mode SS | |||
|---|---|---|---|
| Quadrant | BADHDUFLAG | Total packets | Discarded packets |
| A | 0 | 136 | 0 |
| B | 0 | 136 | 0 |
| C | 0 | 136 | 0 |
| D | 0 | 136 | 0 |
| Quadrant | Total seconds | Saturated seconds | Saturation percentage |
|---|---|---|---|
| A | 6629 | 1619 | 24.422990% |
| B | 6629 | 265 | 3.997586% |
| C | 6629 | 144 | 2.172273% |
| D | 6629 | 99 | 1.493438% |
Noise dominated data is calculated using 1-second bins in cleaned event files. If a bin has >2000 counts, and if more than 50% of those come from <1% of pixels, then it is considered to be noise-dominated and hence unusable.
| Quadrant | # 1 sec bins | Bins with >0 counts | Bins with >2000 counts | High rate bins dominated by noise | Noise dominated (total time) | Noise dominated (detector-on time) | Marked lightcurve |
|---|---|---|---|---|---|---|---|
| A | 7644 | 6631 | 1394 | 1394 | 18.24% | 21.02% | 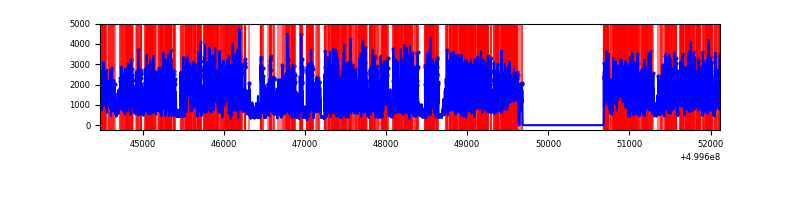 |
| B | 7644 | 6631 | 130 | 130 | 1.70% | 1.96% | 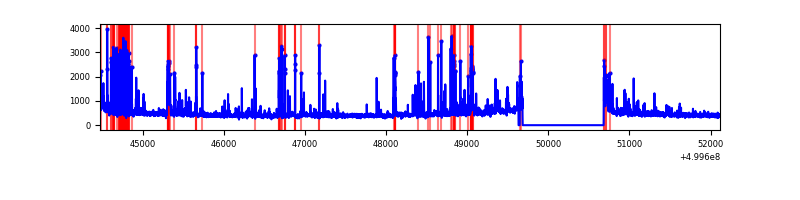 |
| C | 7644 | 6631 | 100 | 100 | 1.31% | 1.51% | 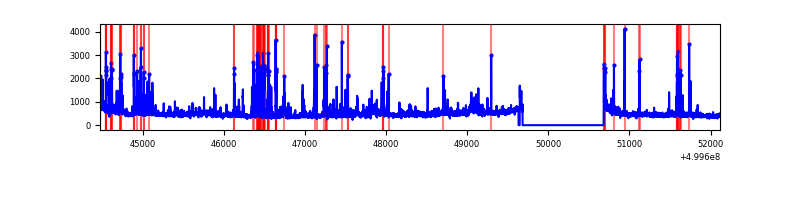 |
| D | 7644 | 6631 | 62 | 62 | 0.81% | 0.94% | 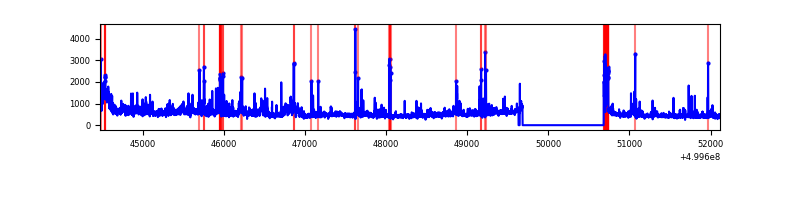 |
Top three noisy pixels from each quadrant. If the there are fewer than three noisy pixels in the level2.evt file, extra rows are filled as -1
| Pixel properties | Quadrant properties | ||||||
|---|---|---|---|---|---|---|---|
| Quadrant | DetID | PixID | Counts | Sigma | Mean | Median | Sigma |
| A | 3 | 14 | 5789169 | 34779.74 | 665 | 648 | 166.4 |
| A | 11 | 3 | 318582 | 1910.27 | 665 | 648 | 166.4 |
| A | 13 | 248 | 224276 | 1343.64 | 665 | 648 | 166.4 |
| B | 1 | 207 | 331439 | 2175.64 | 710 | 687 | 152.0 |
| B | 5 | 185 | 132463 | 866.8 | 710 | 687 | 152.0 |
| B | 5 | 172 | 127387 | 833.41 | 710 | 687 | 152.0 |
| C | 6 | 223 | 307073 | 1586.89 | 706 | 701 | 193.1 |
| C | 13 | 3 | 288019 | 1488.2 | 706 | 701 | 193.1 |
| C | 12 | 249 | 106107 | 545.96 | 706 | 701 | 193.1 |
| D | 9 | 19 | 468011 | 2344.16 | 700 | 668 | 199.4 |
| D | 8 | 160 | 154904 | 773.64 | 700 | 668 | 199.4 |
| D | 5 | 113 | 138138 | 689.54 | 700 | 668 | 199.4 |
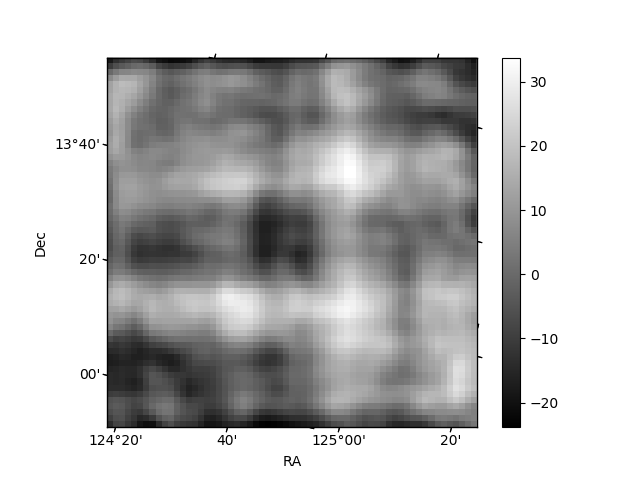
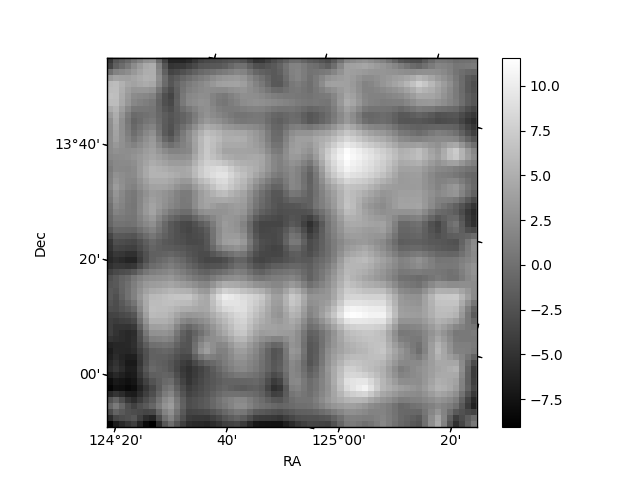
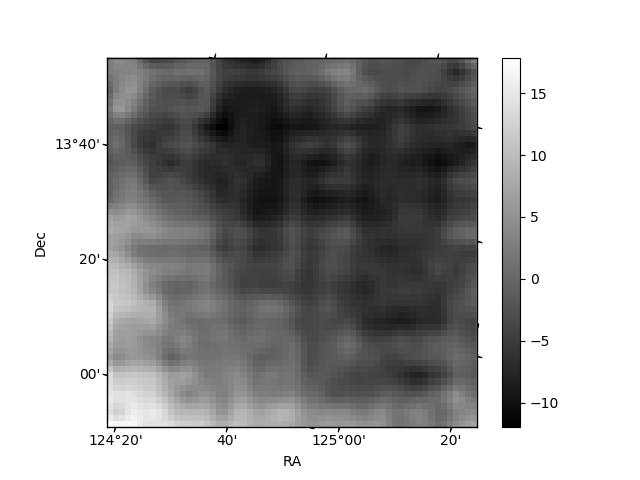
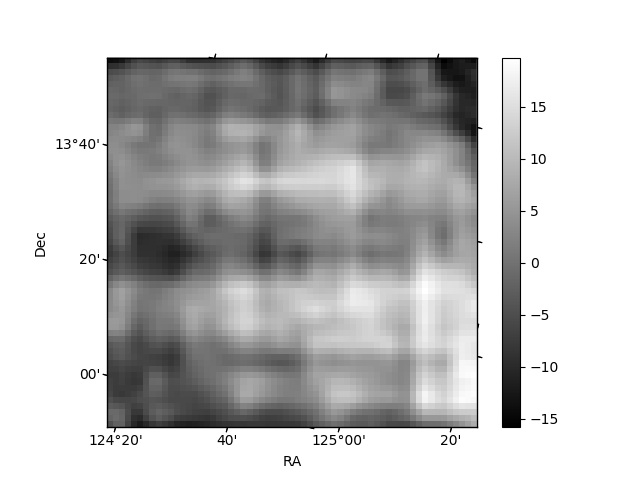
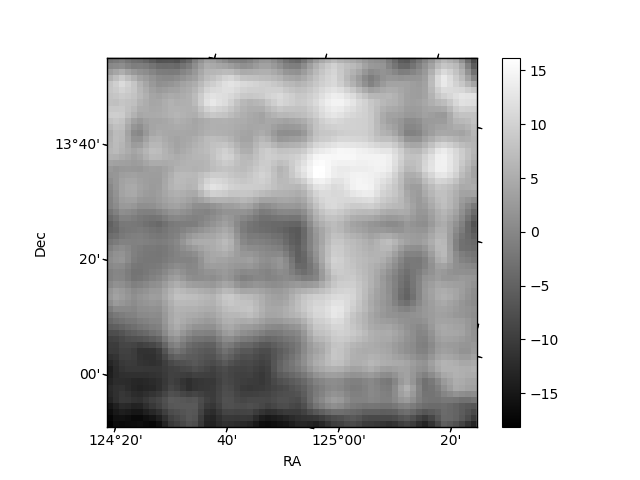
Histogram calculated using DETX and DETY for each event in the final _common_clean file
| Quadrant A | 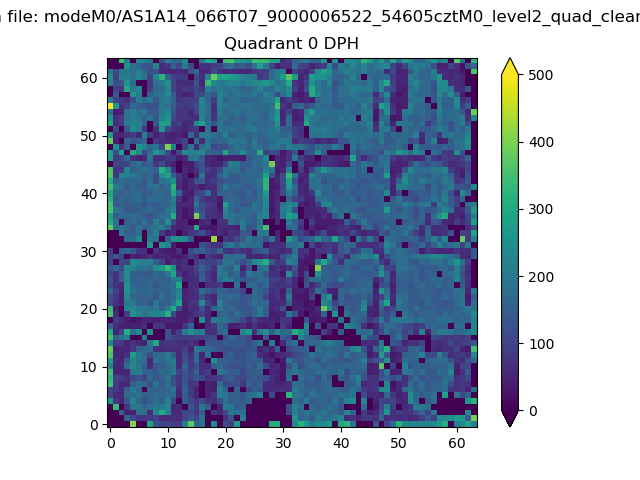 |
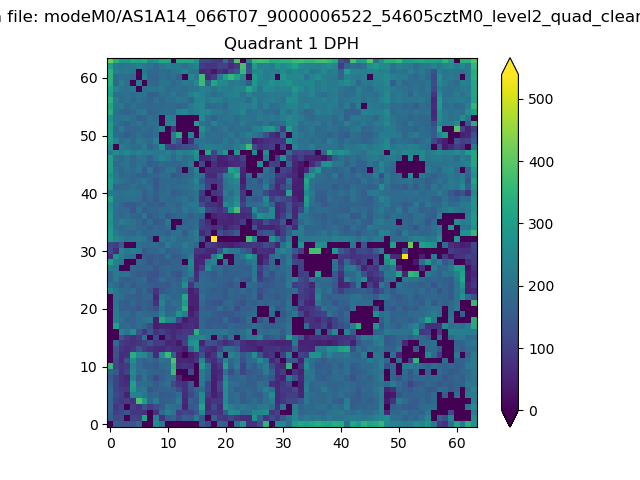 |
Quadrant B |
|---|---|---|---|
| Quadrant D | 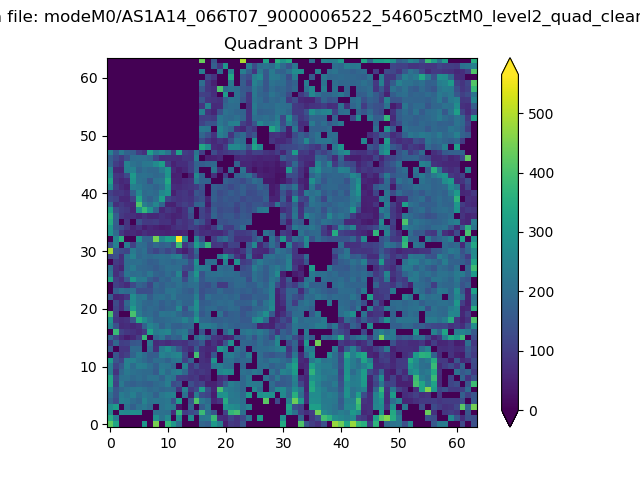 |
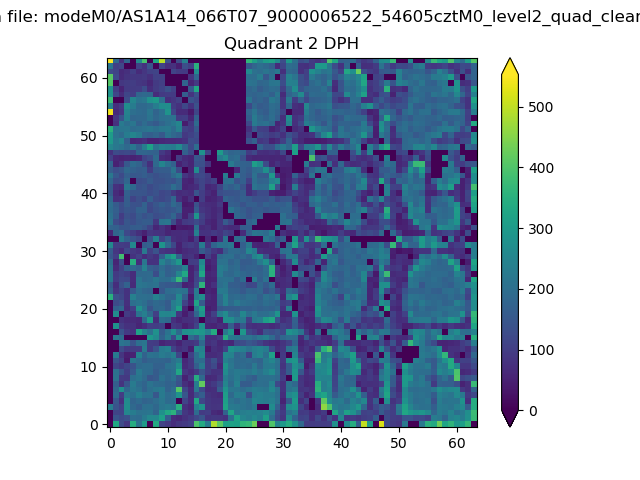 |
Quadrant C |
| Plot type | Count rate plots | Images |
|---|---|---|
| Comparison with Poisson distribution Blue bars denote a histogram of data divided into 1 sec bins. Red curve is a Poisson curve with rate = median count rate of data. |
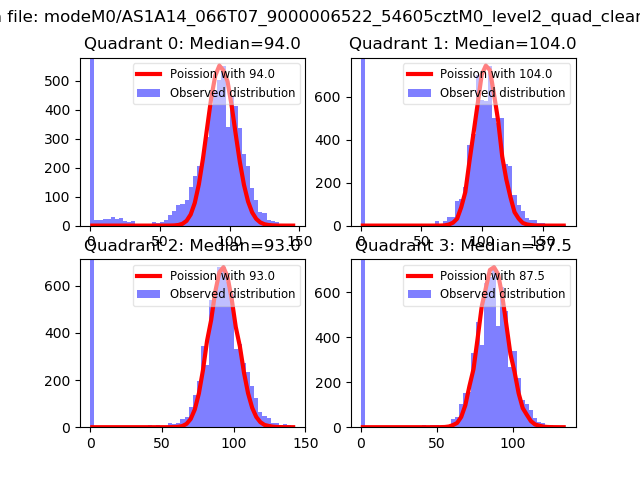 |
 |
| Quadrant-wise count rates Data is divided into 100 sec bins |
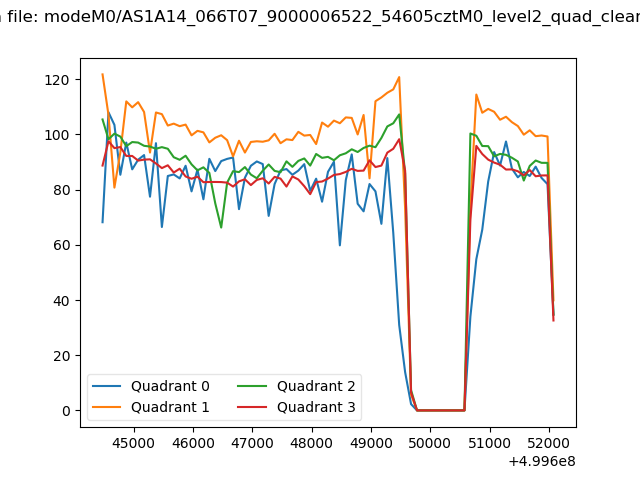 |
|
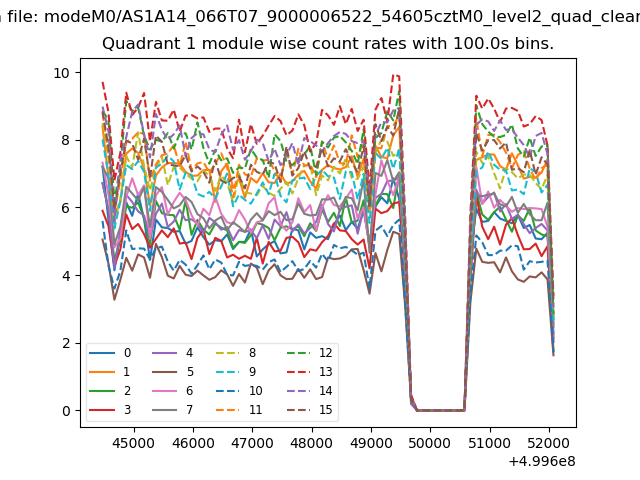
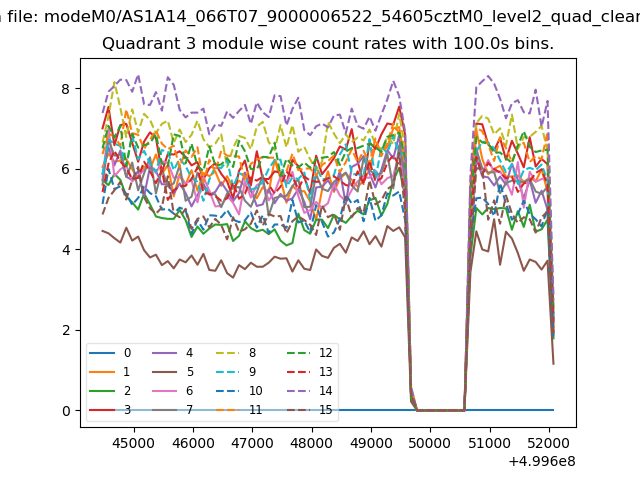
| Module-wise count rates for Quadrant A Data is divided into 100 sec bins |
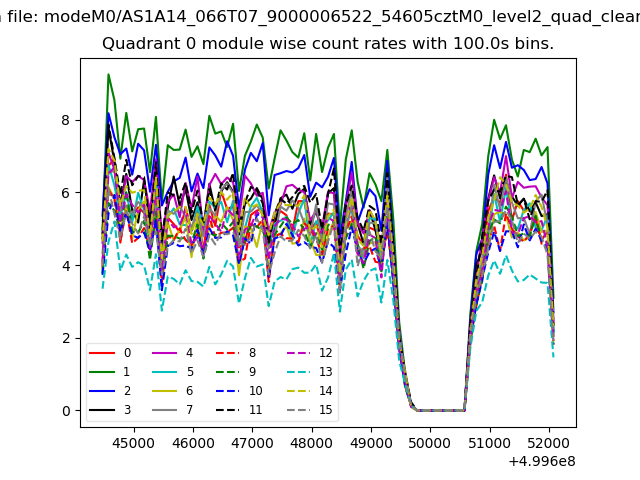 |
 |
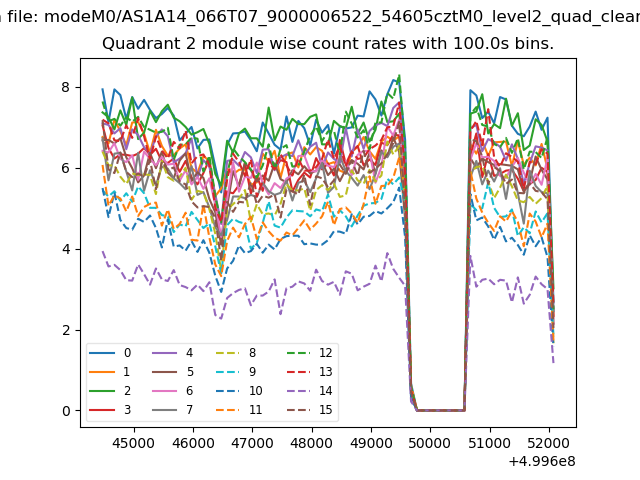
| Module-wise count rates for Quadrant B Data is divided into 100 sec bins |
 |
 |
| Module-wise count rates for Quadrant C Data is divided into 100 sec bins |
 |
 |
| Module-wise count rates for Quadrant D Data is divided into 100 sec bins |
 |
 |
| Parameter | Plot |
|---|---|
| CZT HV Monitor | 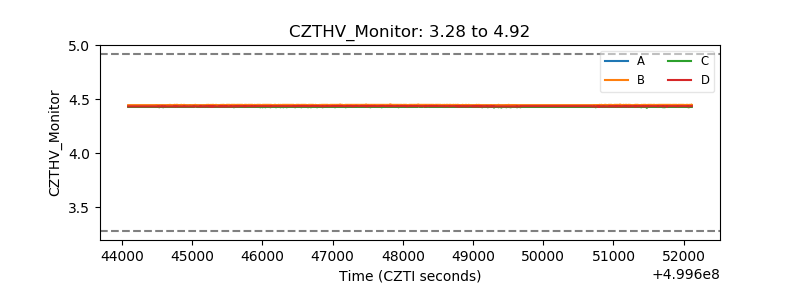 |
| D_VDD | 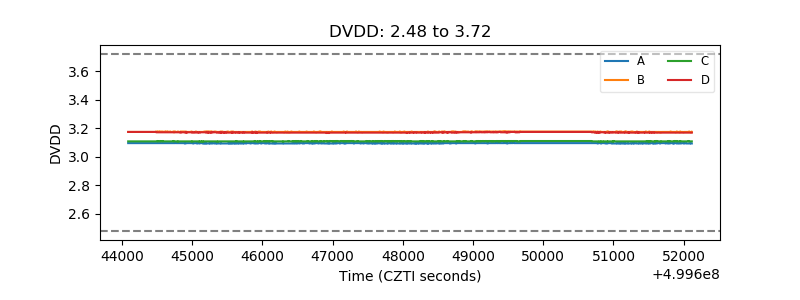 |
| Temperature 1 | 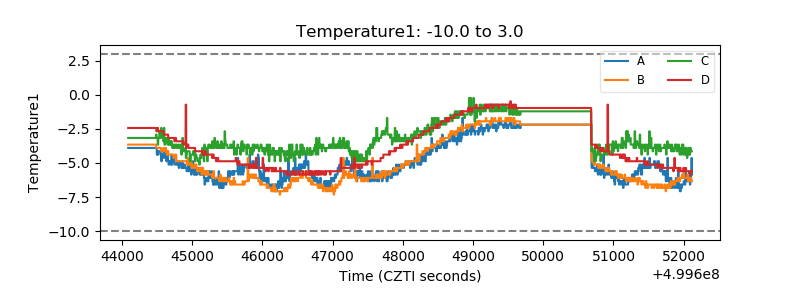 |
| Veto HV Monitor | 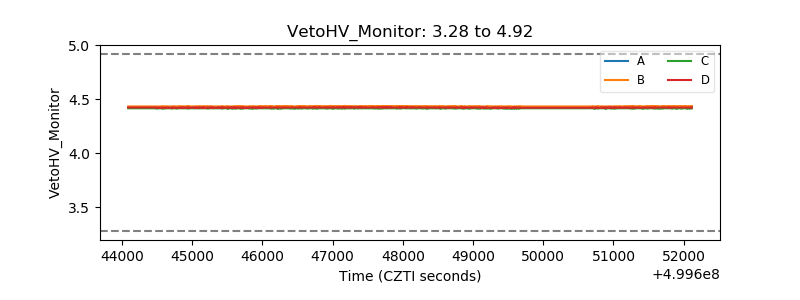 |
| Veto LLD | 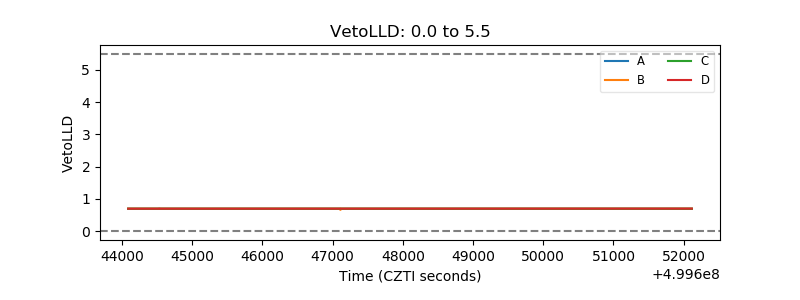 |
| Alpha Counter | 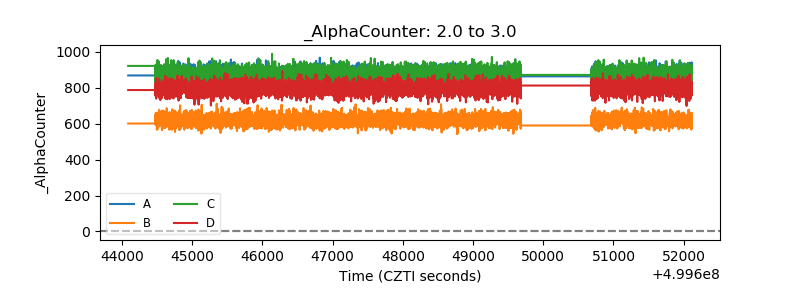 |
| _CPM_Rate | 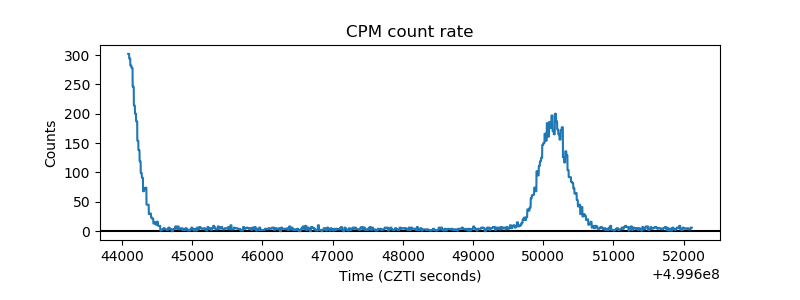 |
| CZT Counter | 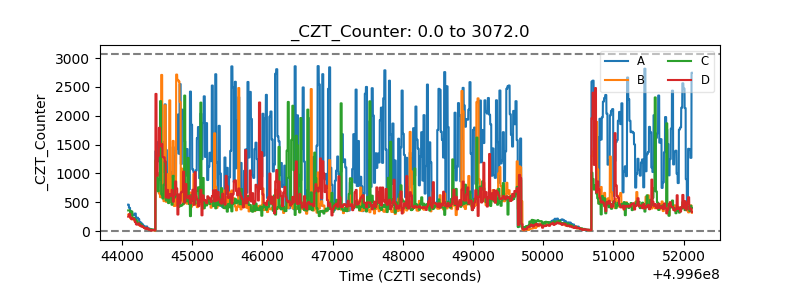 |
| +2.5 Volts monitor | 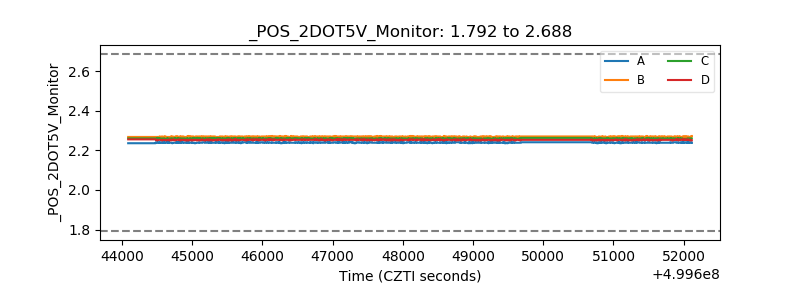 |
| +5 Volts monitor | 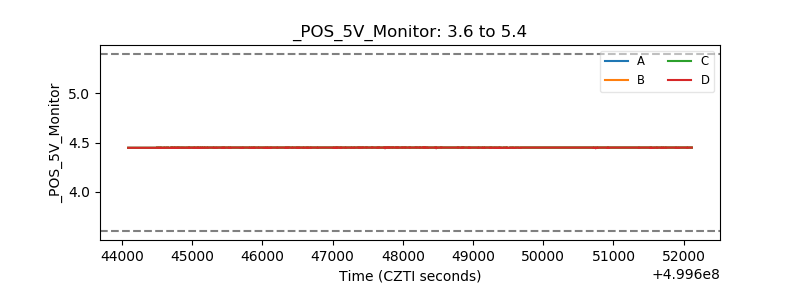 |
| _ROLL_ROT | 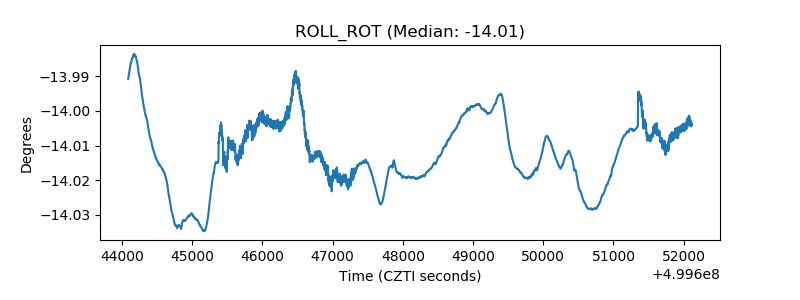 |
| _Roll_DEC | 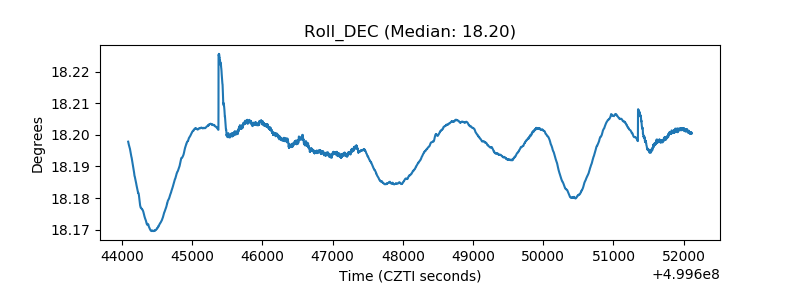 |
| _Roll_RA | 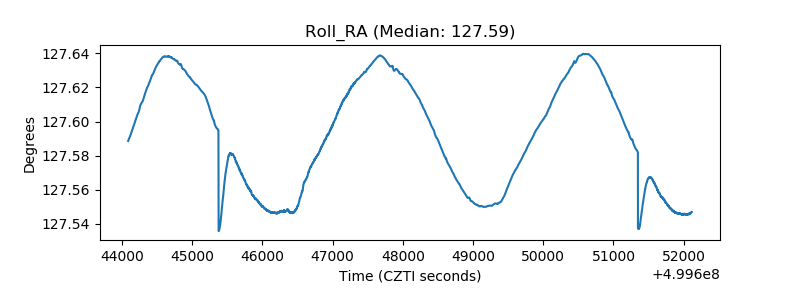 |
| Veto Counter | 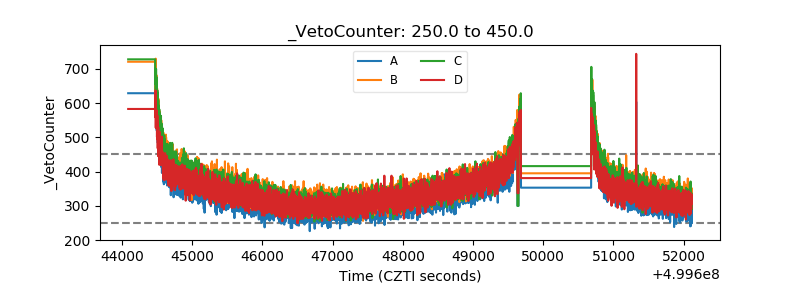 |