| Param | Original file | Final file |
|---|---|---|
| Filename | modeM0/AS1A14_066T07_9000006522_54606cztM0_level2.fits | modeM0/AS1A14_066T07_9000006522_54606cztM0_level2_quad_clean.evt |
| Size (bytes) | 607,536,000 | 96,984,000 |
| Size | 579.4 MB | 92.5 MB |
| Events in quadrant A | 9,422,974 | 569,582 |
| Events in quadrant B | 3,420,627 | 708,445 |
| Events in quadrant C | 4,537,729 | 607,437 |
| Events in quadrant D | 4,568,336 | 566,254 |
| Mode M9 | |||
|---|---|---|---|
| Quadrant | BADHDUFLAG | Total packets | Discarded packets |
| A | 0 | 13 | 0 |
| B | 0 | 14 | 0 |
| C | 0 | 14 | 0 |
| D | 0 | 14 | 0 |
| Mode M0 | |||
|---|---|---|---|
| Quadrant | BADHDUFLAG | Total packets | Discarded packets |
| A | 0 | 32791 | 2 |
| B | 0 | 15380 | 2 |
| C | 0 | 18429 | 2 |
| D | 0 | 18798 | 2 |
| Mode SS | |||
|---|---|---|---|
| Quadrant | BADHDUFLAG | Total packets | Discarded packets |
| A | 0 | 142 | 0 |
| B | 0 | 142 | 0 |
| C | 0 | 142 | 0 |
| D | 0 | 142 | 0 |
| Quadrant | Total seconds | Saturated seconds | Saturation percentage |
|---|---|---|---|
| A | 6955 | 1448 | 20.819554% |
| B | 6955 | 132 | 1.897915% |
| C | 6955 | 381 | 5.478073% |
| D | 6955 | 418 | 6.010065% |
Noise dominated data is calculated using 1-second bins in cleaned event files. If a bin has >2000 counts, and if more than 50% of those come from <1% of pixels, then it is considered to be noise-dominated and hence unusable.
| Quadrant | # 1 sec bins | Bins with >0 counts | Bins with >2000 counts | High rate bins dominated by noise | Noise dominated (total time) | Noise dominated (detector-on time) | Marked lightcurve |
|---|---|---|---|---|---|---|---|
| A | 7645 | 6956 | 1286 | 1286 | 16.82% | 18.49% | 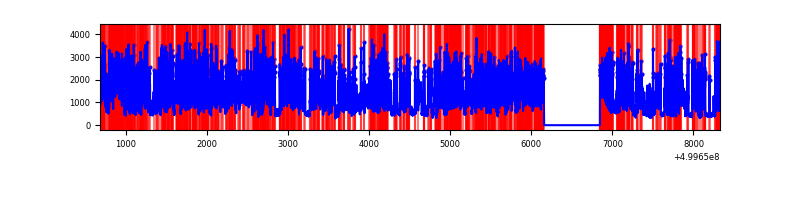 |
| B | 7645 | 6956 | 37 | 37 | 0.48% | 0.53% | 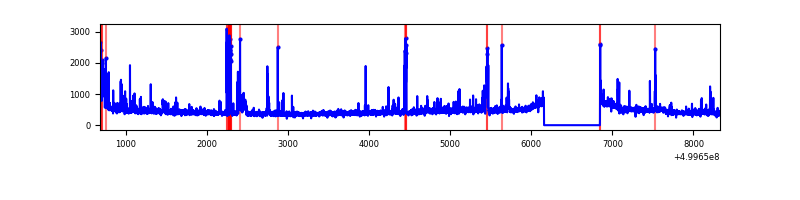 |
| C | 7645 | 6956 | 321 | 321 | 4.20% | 4.61% | 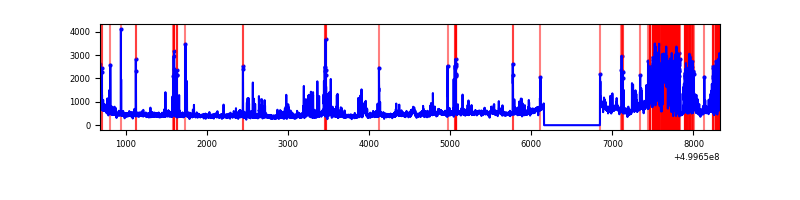 |
| D | 7645 | 6956 | 326 | 326 | 4.26% | 4.69% | 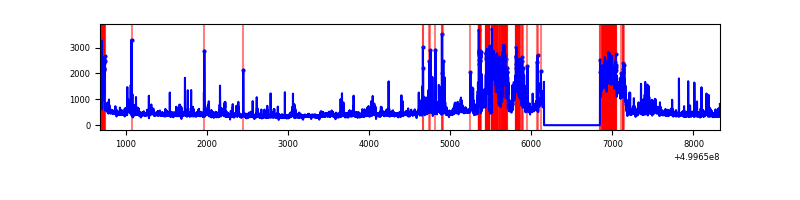 |
Top three noisy pixels from each quadrant. If the there are fewer than three noisy pixels in the level2.evt file, extra rows are filled as -1
| Pixel properties | Quadrant properties | ||||||
|---|---|---|---|---|---|---|---|
| Quadrant | DetID | PixID | Counts | Sigma | Mean | Median | Sigma |
| A | 3 | 14 | 5767558 | 33196.38 | 698 | 681 | 173.7 |
| A | 11 | 3 | 416960 | 2396.26 | 698 | 681 | 173.7 |
| A | 0 | 8 | 251636 | 1444.59 | 698 | 681 | 173.7 |
| B | 5 | 172 | 131538 | 812.03 | 746 | 718 | 161.1 |
| B | 6 | 255 | 113974 | 703.01 | 746 | 718 | 161.1 |
| B | 10 | 247 | 100834 | 621.45 | 746 | 718 | 161.1 |
| C | 6 | 223 | 942118 | 4729.63 | 723 | 719 | 199.0 |
| C | 4 | 5 | 379106 | 1901.03 | 723 | 719 | 199.0 |
| C | 13 | 3 | 125332 | 626.06 | 723 | 719 | 199.0 |
| D | 12 | 33 | 1157456 | 5653.9 | 713 | 681 | 204.6 |
| D | 8 | 240 | 154147 | 750.09 | 713 | 681 | 204.6 |
| D | 8 | 160 | 108949 | 529.17 | 713 | 681 | 204.6 |
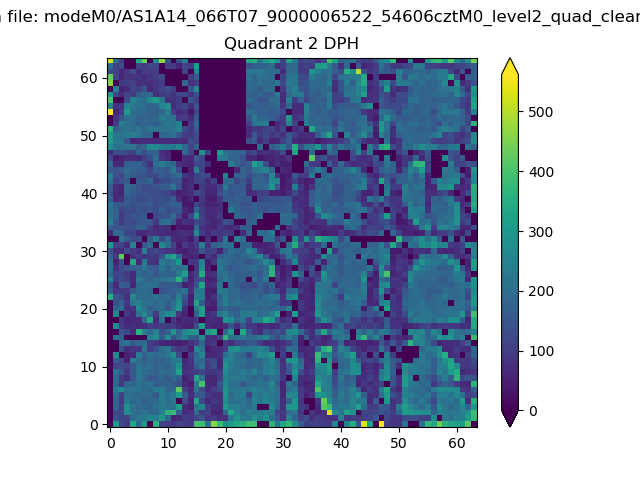
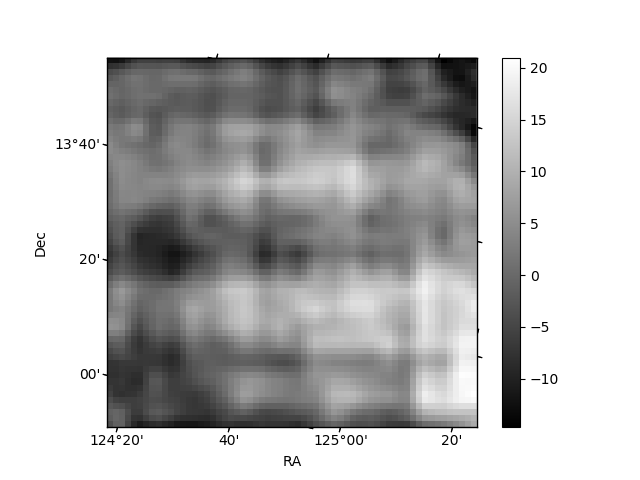
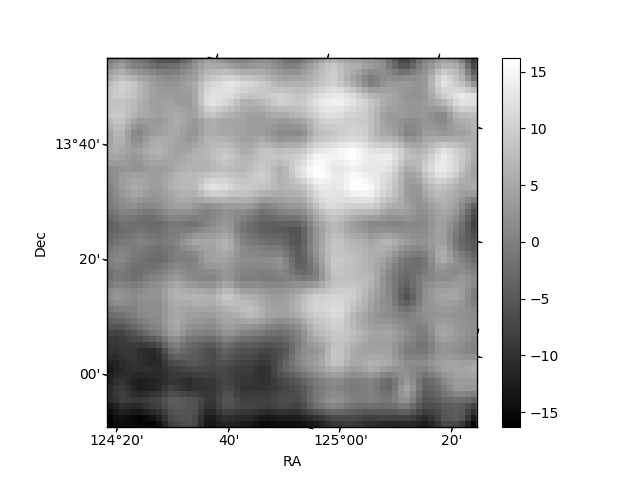
Histogram calculated using DETX and DETY for each event in the final _common_clean file
| Quadrant A | 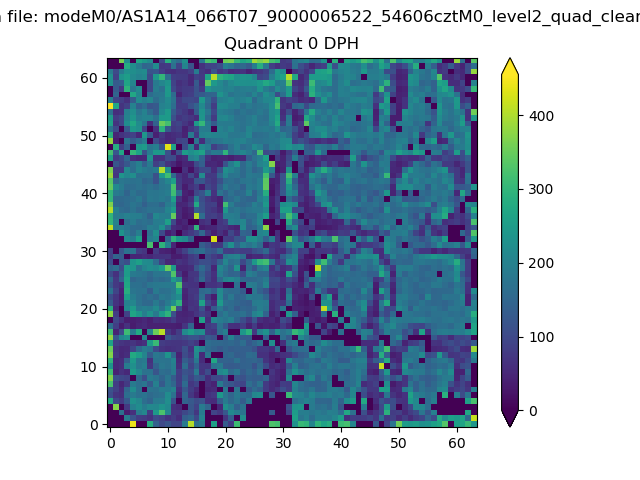 |
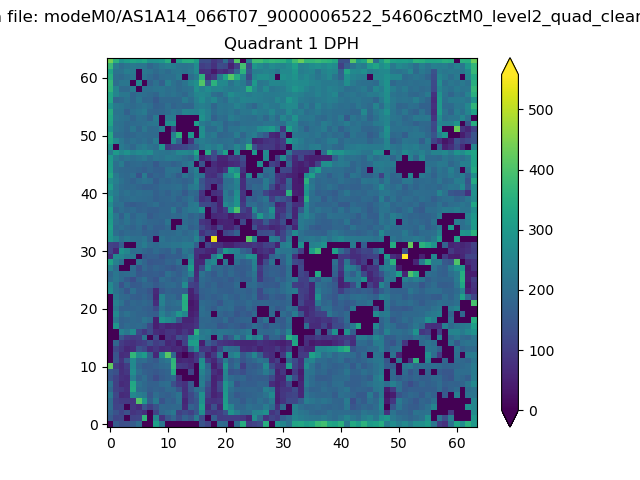 |
Quadrant B |
|---|---|---|---|
| Quadrant D | 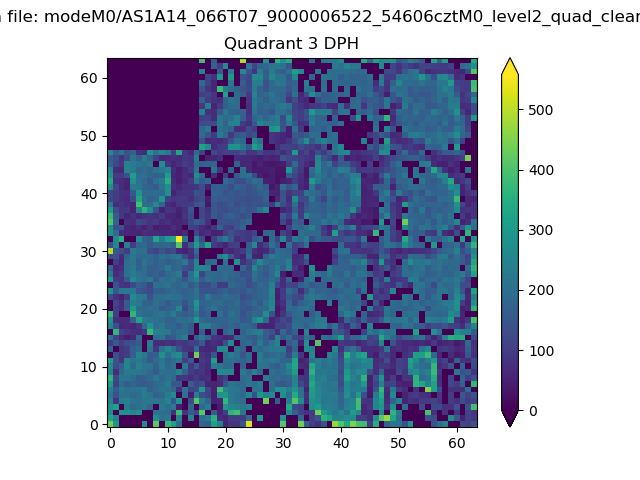 |
 |
Quadrant C |
| Plot type | Count rate plots | Images |
|---|---|---|
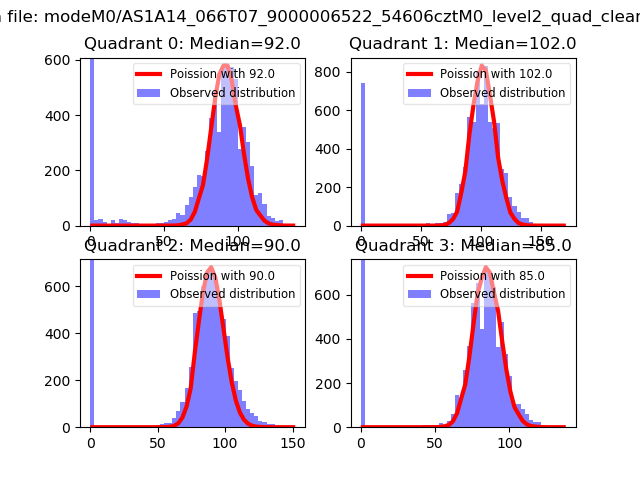
| Comparison with Poisson distribution Blue bars denote a histogram of data divided into 1 sec bins. Red curve is a Poisson curve with rate = median count rate of data. |
 |
 |
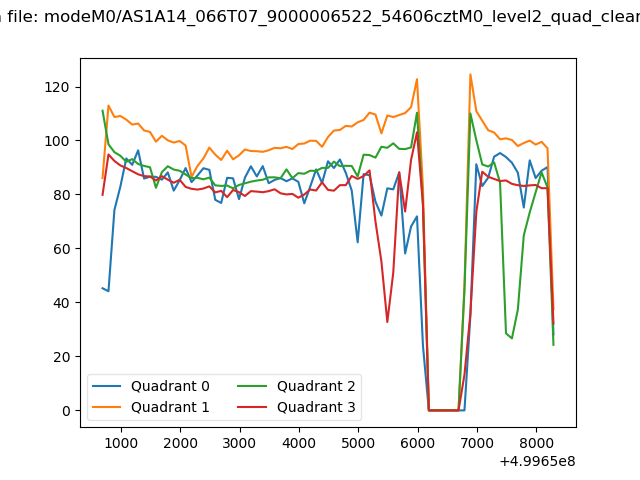
| Quadrant-wise count rates Data is divided into 100 sec bins |
 |
|
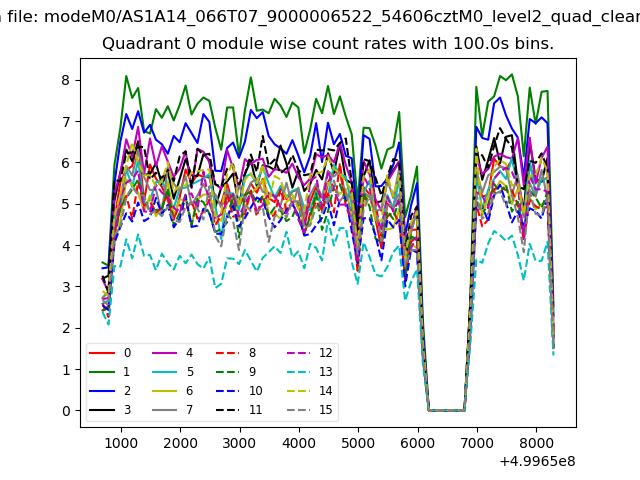
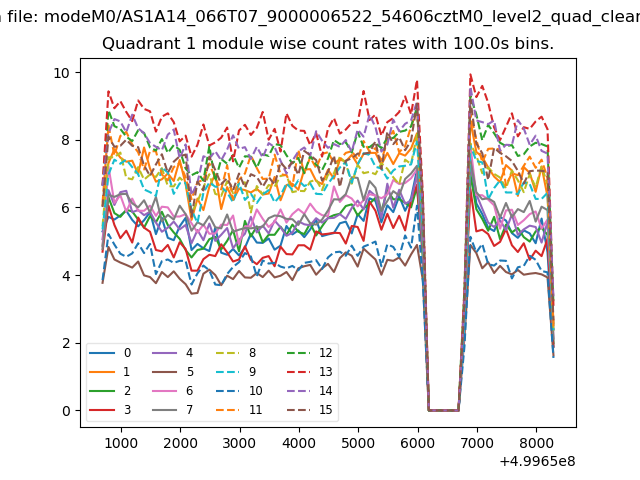
| Module-wise count rates for Quadrant A Data is divided into 100 sec bins |
 |
 |
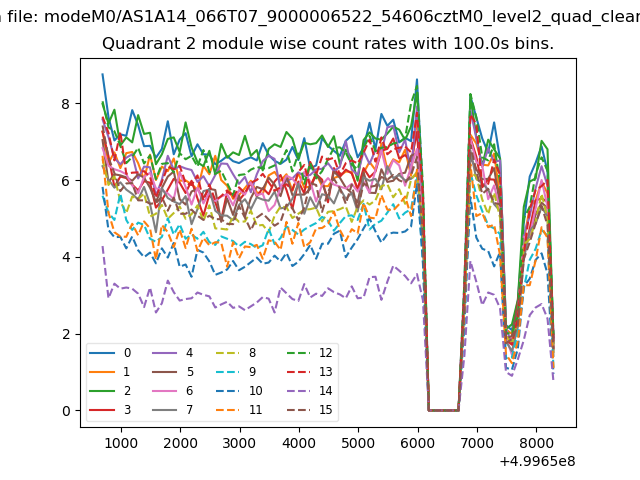
| Module-wise count rates for Quadrant B Data is divided into 100 sec bins |
 |
 |
| Module-wise count rates for Quadrant C Data is divided into 100 sec bins |
 |
 |
| Module-wise count rates for Quadrant D Data is divided into 100 sec bins |
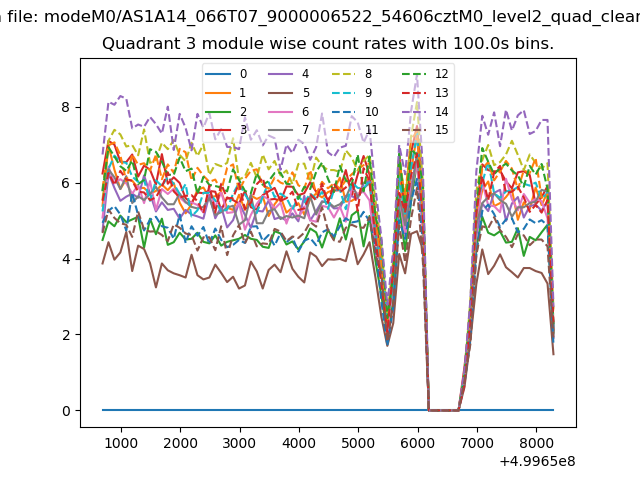 |
 |
| Parameter | Plot |
|---|---|
| CZT HV Monitor | 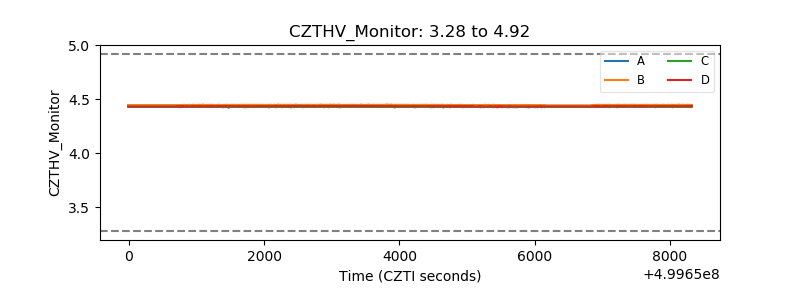 |
| D_VDD | 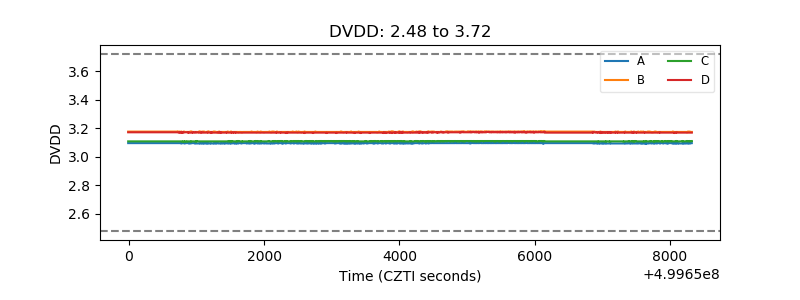 |
| Temperature 1 | 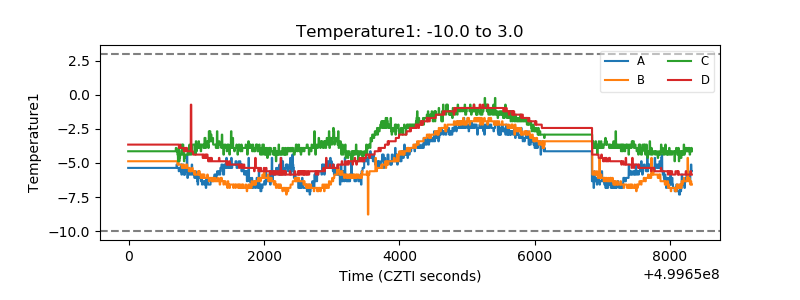 |
| Veto HV Monitor | 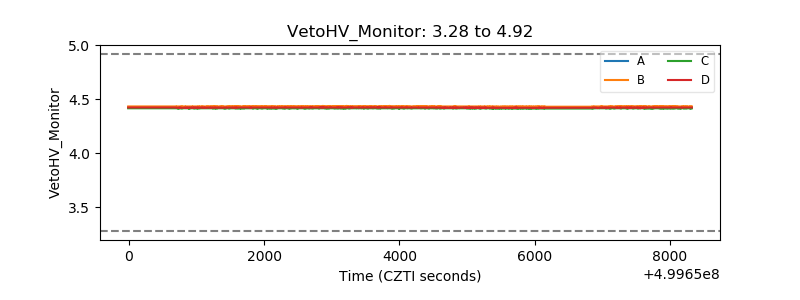 |
| Veto LLD | 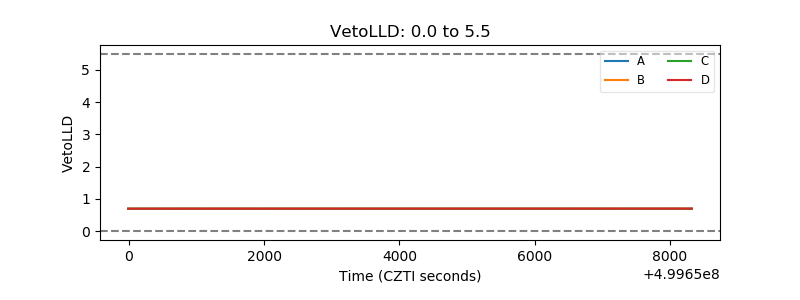 |
| Alpha Counter | 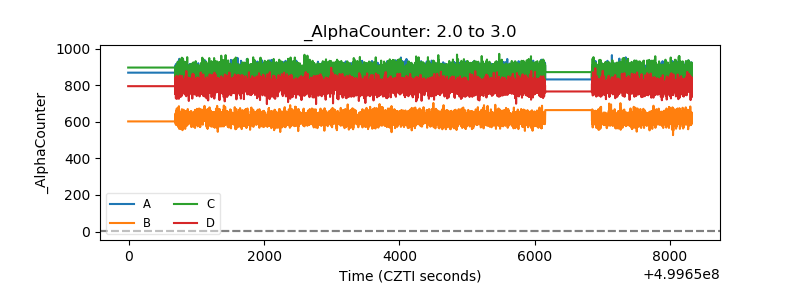 |
| _CPM_Rate | 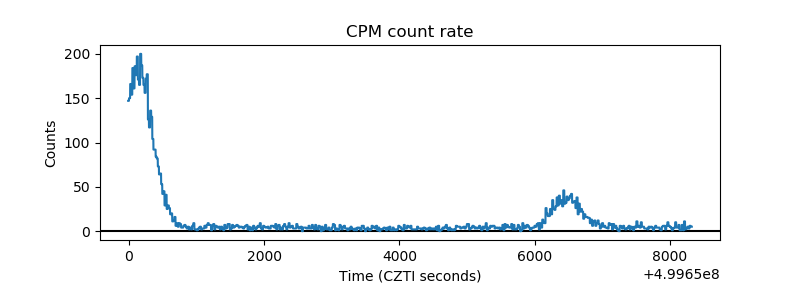 |
| CZT Counter | 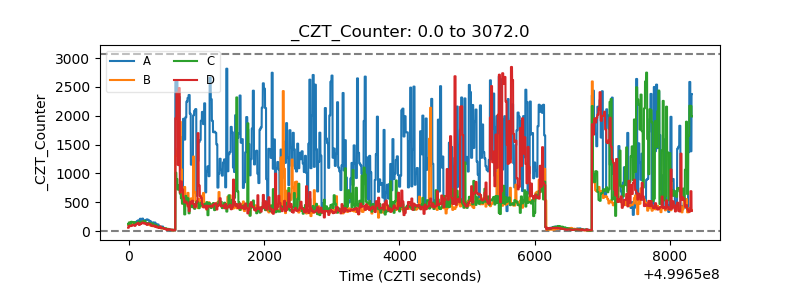 |
| +2.5 Volts monitor |  |
| +5 Volts monitor | 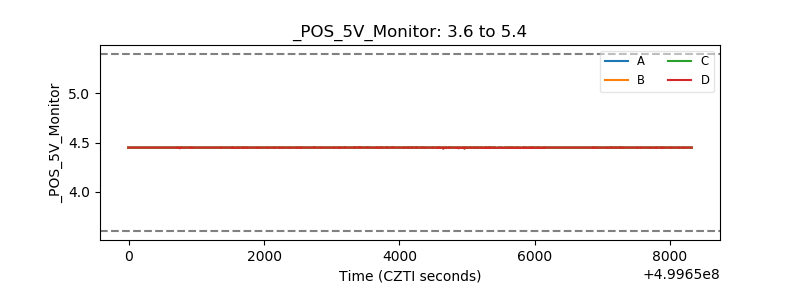 |
| _ROLL_ROT | 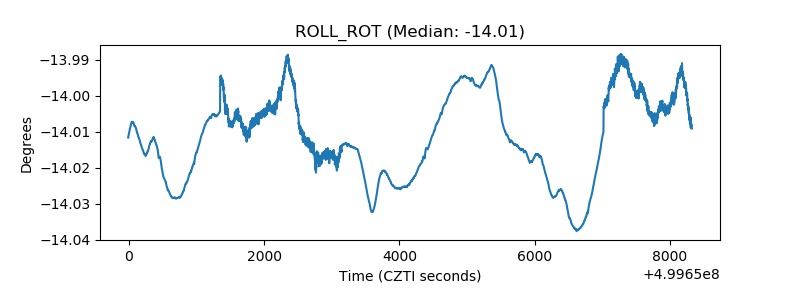 |
| _Roll_DEC | 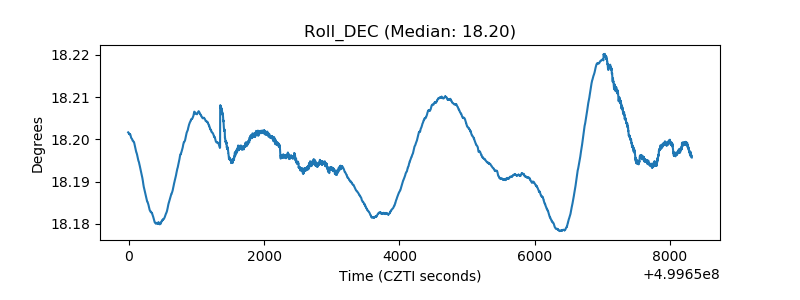 |
| _Roll_RA | 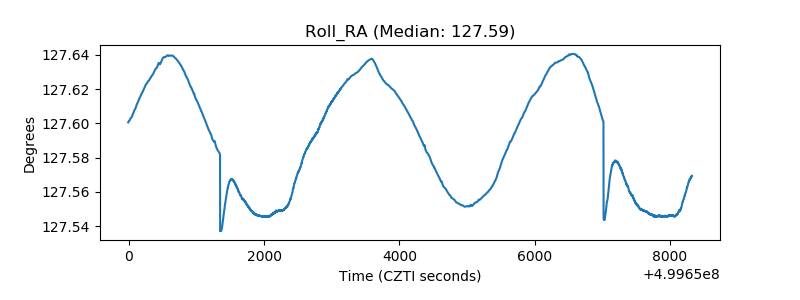 |
| Veto Counter | 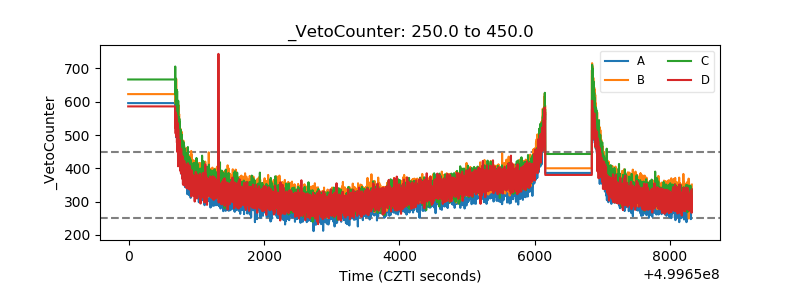 |